
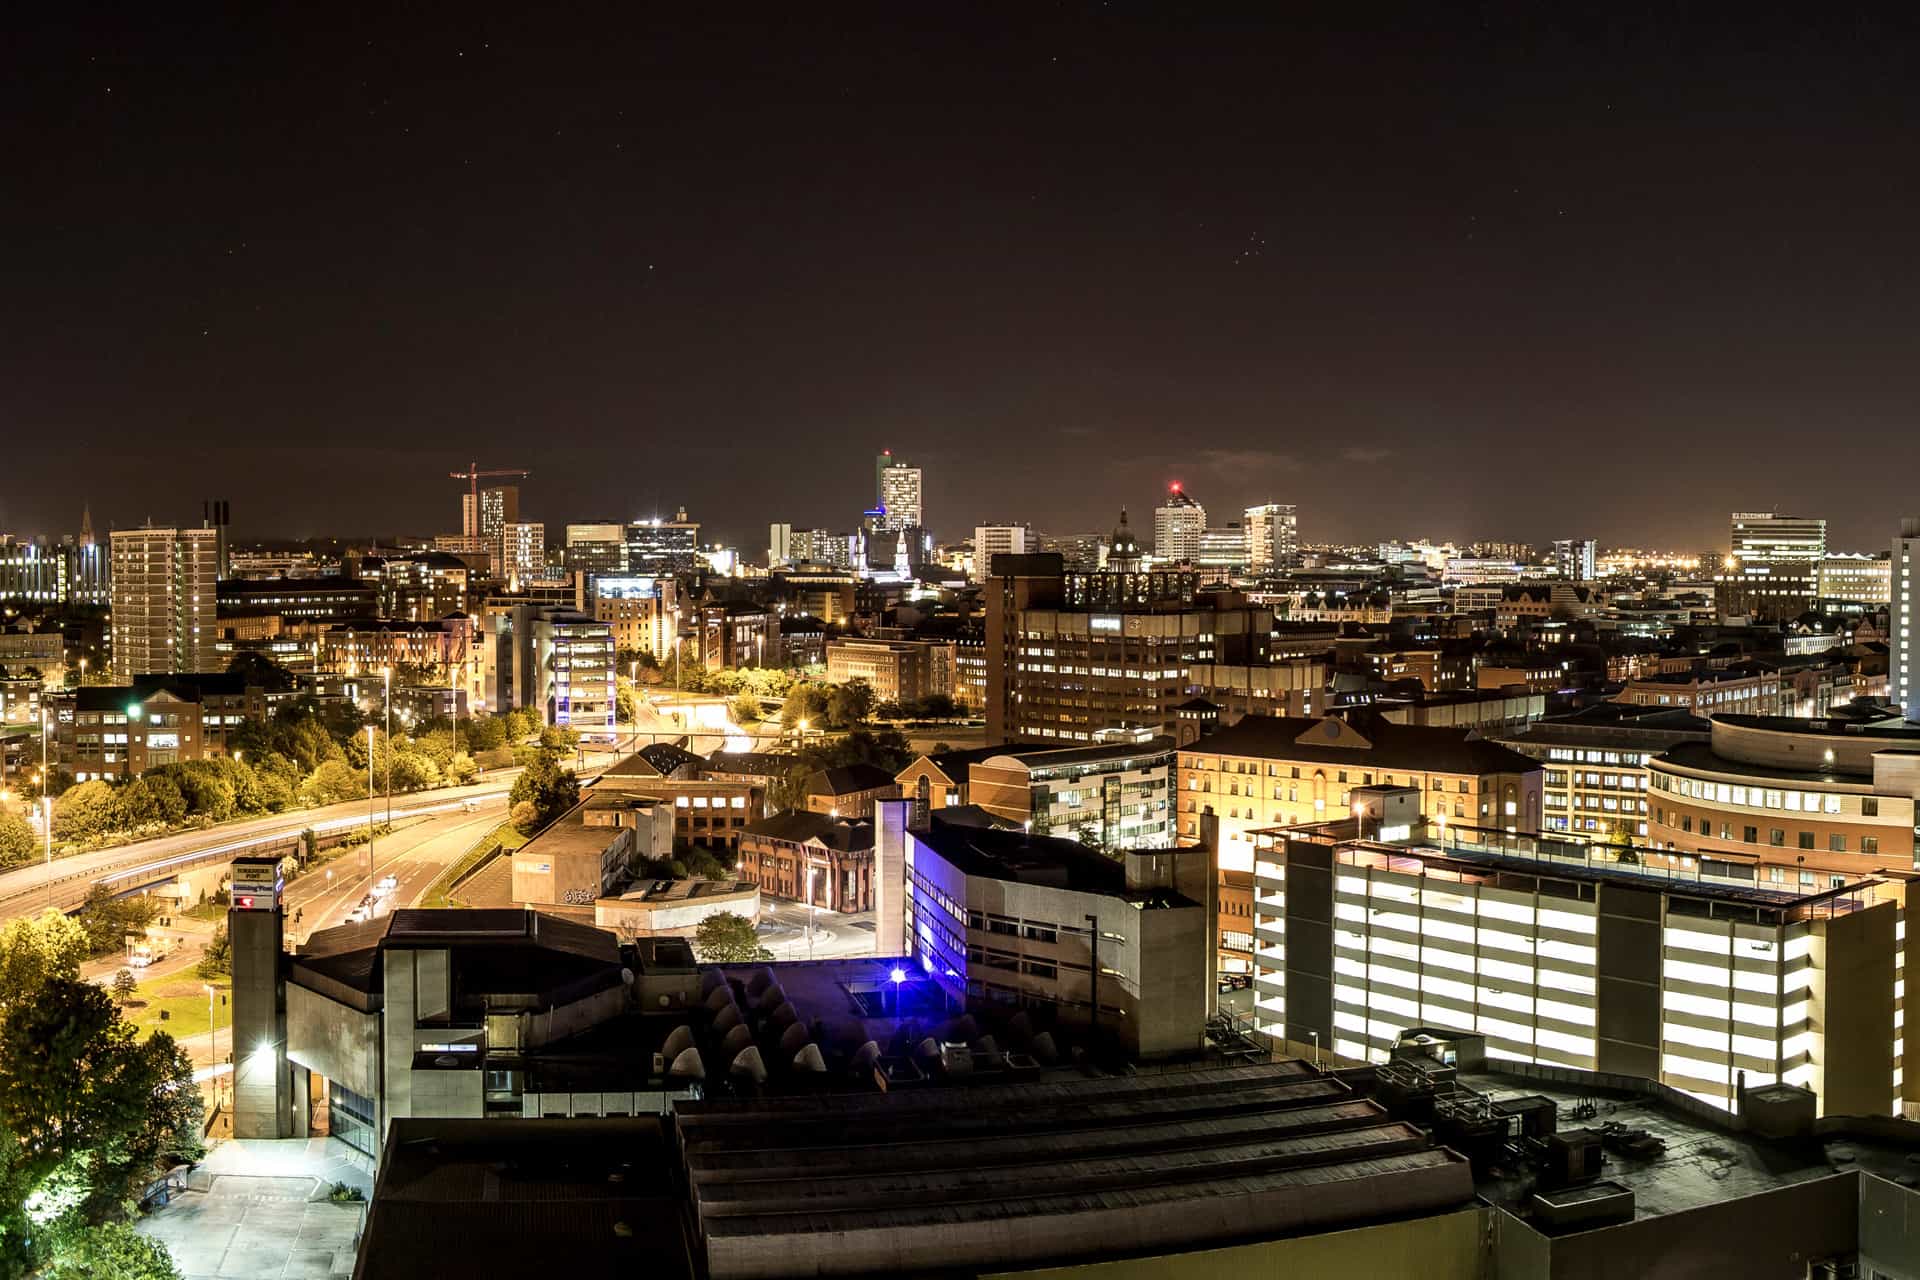
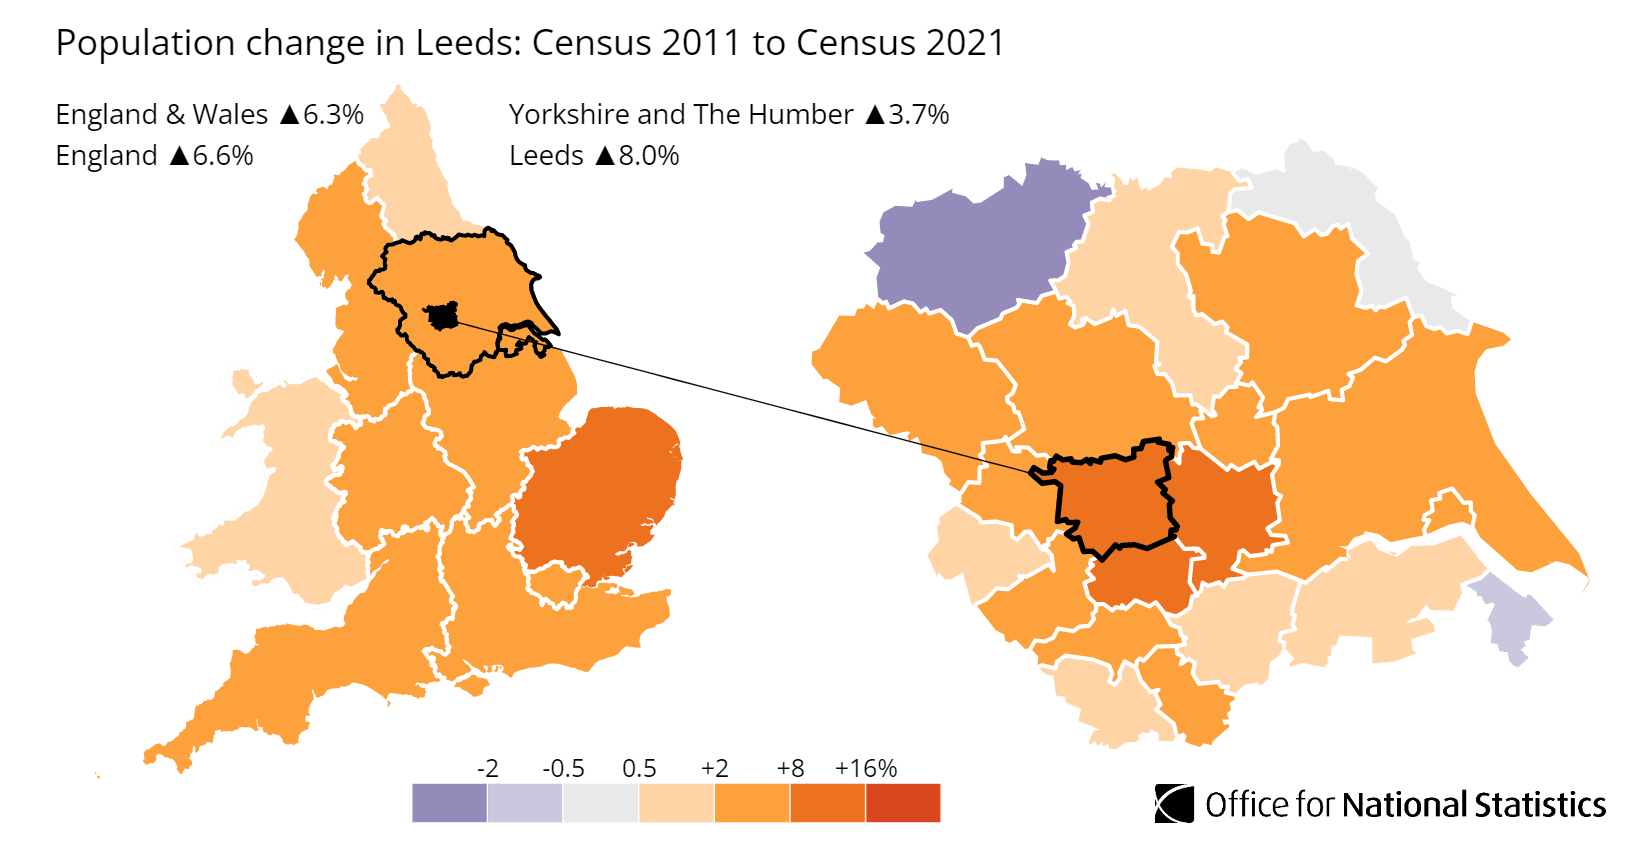
Leeds is a city in West Yorkshire, in northern England. The average sold price across Leeds is £244,430 on the HM Land Registry House Price Index, 15.7% below the England average of £289,946 yet 17.7% above the Yorkshire and the Humber regional average of £207,750. That sits Leeds in an unusual spot: affordable by national standards but the dearest large city in its own region, carried there by a financial and professional services economy that is the biggest in the north of England. The metropolitan district's population grew 8.05% between the 2011 and 2021 censuses, from 751,485 to 811,956 residents.
What separates Leeds from most cities for a buy-to-let investor is the gap between its postcodes. Gross yields run from 8.9% in LS2 on the city-centre fringe down to 3.1% in LS16 out in the affluent north, a 5.8 percentage point spread that is among the widest of any UK city. The cheapest way in is LS2 at a £147,361 asking price; the dearest postcode with rental data, LS6 in Headingley, asks £279,346 and earns its keep from the student market. One city holds both a high-yield inner belt and a low-yield commuter fringe, and the data below shows where each sits.
This guide covers the metropolitan district of Leeds (ONS code E08000035), running from the LS1 city centre out to the LS29 Wharfe Valley, plus the WF3, WF10 and BD11 fringe. Leeds sits at the centre of West Yorkshire, 25 miles east of Manchester and 10 miles north-east of Bradford. Investors comparing the wider region may also weigh Wakefield to the south and York to the north-east.
Article updated: July 2026
Why Invest in Leeds?
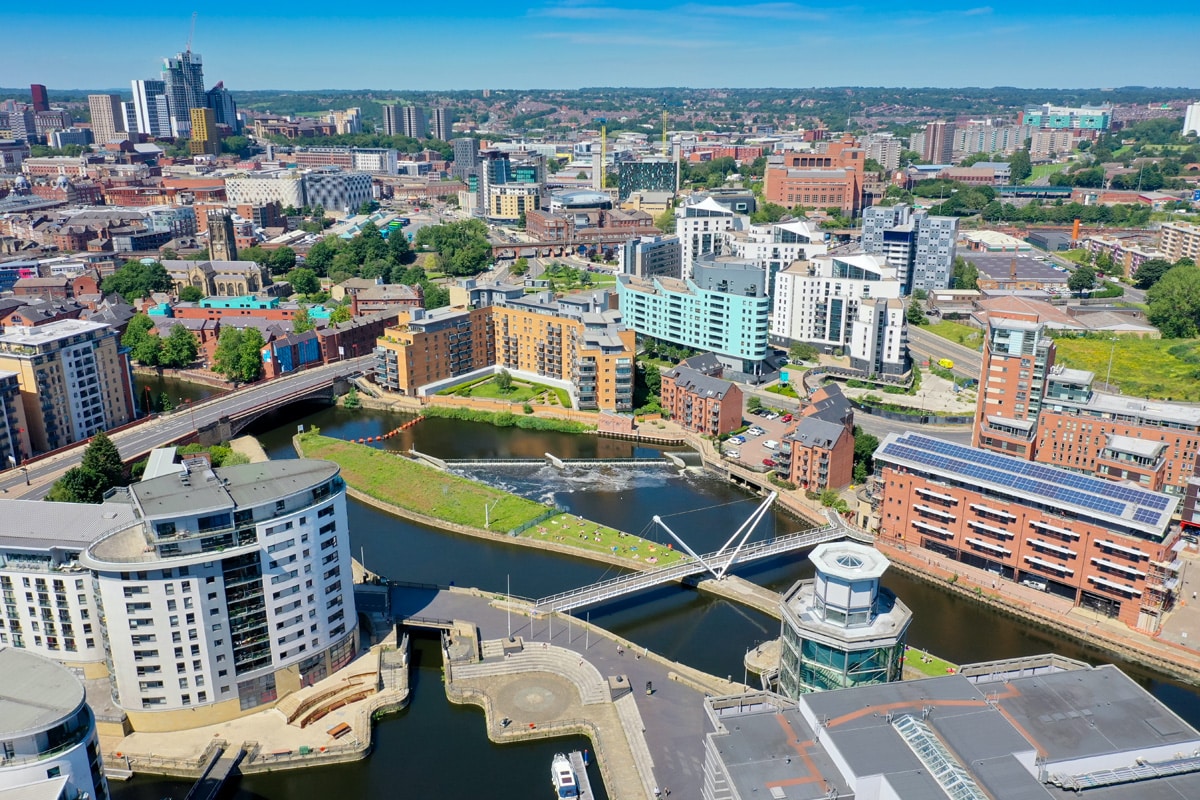
Leeds runs the largest economy of any city in the north of England, and that scale is the backbone of its rental market. Financial and professional services anchor the city, with Legal & General, Direct Line, KPMG and the big accountancy firms all holding major offices, and the city processing more legal work than anywhere outside London. That sits alongside two universities bringing tens of thousands of students into the inner postcodes each year, and the NHS, whose Leeds Teaching Hospitals trust is one of the largest single employers in the region. A tenant base spread across finance, healthcare, higher education and digital does not lean on any one sector.
The population grew 8.05% between the 2011 and 2021 censuses, from 751,485 to 811,956, ahead of the England and Wales average of 6.3%. Most of that growth landed in the city centre and inner suburbs, fed by graduate retention and inward migration from across the wider region. For a landlord, a growing, churning inner-city population is what keeps the LS2, LS3 and LS6 rental markets deep.
Median gross annual earnings in Leeds are £36,716, above the Yorkshire and the Humber median of around £34,900 but below the Great Britain figure of £39,125. That position matters. Wages sit high enough to support genuine rents across the inner belt, while staying low enough that asking prices have never run as far ahead of incomes as they have in the south. The employment rate of 74.2% is just below the regional 74.3% and national 75.6%, held down in part by the large student population the universities bring in.
Leeds Economic Summary
- Population: 811,956 (2021 Census). Growth of 8.05% from 2011.
- Median annual salary: £36,716 (Leeds), £34,900 (Yorkshire and the Humber), £39,125 (Great Britain)
- Employment rate: 74.2% (Leeds), 74.3% (Yorkshire and the Humber), 75.6% (Great Britain)
- Unemployment rate: 4.7% (Leeds)
- Key employment sectors: Financial and professional services, healthcare, higher education, digital and tech, advanced manufacturing
Source: ONS Census 2021, Nomis Labour Market Profile (ASHE 2025, Employment Oct 2024-Sep 2025)
Source: Office for National Statistics - Population for Leeds
Regeneration and Investment in Leeds
The single biggest change in central Leeds is South Bank, a 640-acre regeneration zone south of the river that is set to roughly double the size of the city centre. The schemes below are the ones already pulling rental demand into postcodes that were industrial land a decade ago, and the inner-city yield figures later in this guide sit directly on top of them.
- South Bank and Aire Park (underway): A 640-acre regeneration of former industrial land south of the city centre, built around Aire Park, the largest new city-centre green space created in the UK in recent years. The wider scheme is the council's headline driver of new homes and jobs in central Leeds, and it pulls directly into the LS11 and LS10 postcodes that carry some of the city's lowest asking prices. Updates at Leeds City Council.
- Sweetfields, South Bank (under construction, 1,350+ build-to-rent homes): Platform_'s 1.3 million sq ft mixed-use neighbourhood on Sweet Street West is delivering more than 1,350 build-to-rent apartments alongside 160,000 sq ft of Grade A office space, with the first 451 homes due to complete at the start of 2027. Institutional money committing at that scale sets a rent benchmark for the South Bank area and signals confidence in central Leeds demand. Updates at Place Yorkshire.
- Connecting Leeds and new rail stations (completed and ongoing, £270 million): The £270 million Connecting Leeds transport programme has delivered new park-and-ride capacity, a rebuilt bus station and city-centre gateways, with White Rose station in south Leeds now open and Leeds City Station improvements following. New stations create new commuter catchments and tend to push rental demand into postcodes that were previously off the map. Updates at Leeds City Council.
- West Yorkshire Mass Transit (planning phase, services late 2030s): A tram network connecting Bradford, Leeds city centre and south Leeds including St James's University Hospital, with the Strategic Outline Case due in 2026 and early works targeted for 2028. Tram routes have historically lifted land values along their corridors well before the first service runs, so route confirmation is the milestone to watch. Updates at West Yorkshire Combined Authority.
Leeds Property Market Analysis
Average prices across Leeds have risen 435.1% since January 1995, from £45,679 to £244,430. The sections below trace that path cycle by cycle, then drill into current postcode-level data for sold prices, price per square foot, asking prices, growth, transaction volumes and selling times.
When was the last house price crash in Leeds?
The Land Registry House Price Index tracks Leeds from January 1995 to the latest reading in March 2026, covering 31 years and one major crash.
The slow build, 1995 to 2000: Leeds started 1995 at £45,679 and barely moved for five years, edging only to £53,992 by January 2000 while London ran away. The north came late to that cycle.
The boom, 2000 to 2007: Then it caught up fast. Prices nearly tripled to a peak of £157,612 in September 2007, with the sharpest run in 2002 to 2004 as cheap credit, the first buy-to-let wave and Leeds's growth as a financial centre pushed values well beyond what local wages could sustain.
The financial crisis, 2007 to 2009: From that £157,612 peak the market fell to a trough of £127,044 in April 2009, a drop of 19.4% in 19 months, with the worst year-on-year reading at -17.7% in March 2009. Leeds fell slightly harder than the Yorkshire and the Humber region, which dropped 17.6% from £141,405 to £116,556 over the same period. As a financial-services hub, Leeds carried more exposure to the credit crunch than the wider region did.
The stagnation, 2009 to 2013: Prices bounced off the trough but then went sideways for four years. The average was £137,311 in December 2010 and still only £138,396 by December 2013, leaving Leeds well short of its pre-crash peak. This was the longest flat stretch in its modern record.
The recovery, 2014 to 2016: Growth returned from 2014, and prices finally passed the September 2007 peak in December 2015 at £157,722. That recovery took eight and a quarter years, faster than some northern cities but well behind London, where prices had cleared their pre-crash highs years earlier.
Pre-pandemic growth, 2017 to 2019: Steady single-digit gains carried the average from £173,365 in December 2017 to £185,001 by December 2019, as the city-centre apartment market matured and the professional-services sector kept expanding.
The pandemic surge, 2020 to 2022: The stamp duty holiday and the shift to hybrid working pushed Leeds sharply higher, from £182,392 in March 2020 to £233,785 by December 2022, growth of 28.2% in under three years. The outer suburbs and Wharfe Valley towns within the boundary saw the strongest demand as professionals reassessed where they wanted to live.
The rate shock, 2023: Higher mortgage rates cooled the market, easing the average from £233,785 to £228,265 across 2023, a dip of 2.4% that was brief and mild against the 2008 fall.
2024 to present: Prices steadied and resumed growth, reaching £238,383 by December 2024 and £244,430 by the latest reading in March 2026, up 2.3% on the year. The current price is 55.1% above the September 2007 peak.
Long-term growth summary:
- 5 years (March 2021 to March 2026): 20.9% growth (£202,185 to £244,430)
- 10 years (March 2016 to March 2026): 58.5% growth (£154,251 to £244,430)
- 15 years (March 2011 to March 2026): 78.6% growth (£136,854 to £244,430)
- 20 years (March 2006 to March 2026): 73.4% growth (£140,948 to £244,430)
- 30 years (January 1995 to March 2026): 435.1% growth (£45,679 to £244,430)
The 15-year and 20-year returns sit close together, 78.6% against 73.4%, and that near-match is the stagnation phase showing up in the numbers: a buyer in 2006 and a buyer in 2011 hold similar equity today. Over the full 31 years Leeds returned 435.1% through one major crash, and the city's economy is more diversified now than it was in 2007. Someone who bought at the exact September 2007 peak would be 55.1% ahead on the Land Registry average.
- All property types
- Detached
- Semi-detached
- Terraced
- Flats
- All property types
- Detached
- Semi-detached
- Terraced
- Flats
Sold House Prices in Leeds
The average sold price across all property types in Leeds is £244,430, which is 15.7% below the England average of £289,946. That discount is not spread evenly. Detached houses sit only 4.5% below England, while flats are 30.2% cheaper. The gap reflects the city's housing mix: the detached stock in the northern suburbs competes with national buyers, while the large city-centre flat market, built out in the 2000s, trades well below southern apartment prices.
| Property Type | Leeds Average | England Average | Difference |
|---|---|---|---|
| Detached houses | £449,396 | £470,492 | -4.5% |
| Semi-detached houses | £267,175 | £288,185 | -7.3% |
| Terraced houses | £203,487 | £243,788 | -16.5% |
| Flats and maisonettes | £149,734 | £214,563 | -30.2% |
| All property types | £244,430 | £289,946 | -15.7% |
Detached houses at £449,396 carry the narrowest discount, 4.5% below England's £470,492. The detached stock concentrates in the northern suburbs and Wharfe Valley, LS17 Roundhay, LS16 Bramhope and Adel, and the market towns of LS29 Ilkley and LS22 Wetherby, where owner-occupier demand from professionals keeps prices close to the national line. Annual growth of 2.8% points to steady demand rather than froth.
Semi-detached houses at £267,175 sit 7.3% below England's £288,185 and track the city-wide average closely. Semis are the workhorse of suburban Leeds, dominating LS15 Cross Gates, LS25 Garforth and LS28 Pudsey, where families and first-time buyers compete with investors. That competition keeps the discount modest. Annual growth here is the strongest of the four types at 3.4%.
Terraced houses at £203,487 offer a 16.5% discount to England's £243,788. The Victorian and Edwardian terraces of LS11 Beeston, LS9 Harehills and LS12 Armley are the backbone of Leeds's single-let buy-to-let stock: affordable entry, strong demand from young professionals and key workers, and the highest house-type yields in the city. Annual growth of 2.7% is in line with the wider market.
Flats and maisonettes at £149,734 show the deepest discount, 30.2% below England's £214,563. The city-centre apartment wave of the mid-2000s left LS1, LS2 and LS3 with a large stock of one and two-bed flats that trades far below Manchester or southern prices. Annual change of -2.0% is the only negative reading of the four types, and it is the supply overhang in the city-centre postcodes showing through.
Price Per Square Foot in Leeds
The cheapest space in Leeds is LS11 Beeston at £178 per square foot and the dearest is LS23 Boston Spa at £373, a spread of 110% across the city. Price per square foot strips out how big the homes are and shows what the location itself commands, so it separates a genuinely cheap postcode from one that is merely full of small flats.
| Rank | Area | Price Per Sq Ft |
|---|---|---|
| 1 | LS11 (Beeston, Holbeck) | £178 |
| 2 | LS9 (Harehills, Richmond Hill) | £187 |
| 3 | WF10 (Castleford, Allerton Bywater) | £202 |
| 4 | LS12 (Armley, Wortley) | £218 |
| 5 | LS10 (Hunslet, Belle Isle) | £222 |
| 6 | LS3 (Woodhouse, Little Woodhouse) | £232 |
| 7 | LS13 (Bramley, Rodley) | £233 |
| 8 | LS14 (Seacroft, Whinmoor) | £243 |
| 9 | LS4 (Burley, Kirkstall) | £251 |
| 10 | LS2 (City Centre) | £260 |
| 11 | LS27 (Morley, Gildersome) | £265 |
| 12 | WF3 (East Ardsley, Tingley) | £266 |
| 13 | BD11 (Birkenshaw, Drighlington) | £267 |
| 14 | LS5 (Kirkstall, Hawksworth) | £271 |
| 15 | LS8 (Roundhay, Oakwood) | £272 |
| 16 | LS26 (Rothwell, Woodlesford) | £273 |
| 17 | LS28 (Pudsey, Farsley) | £277 |
| 18 | LS6 (Headingley, Hyde Park) | £280 |
| 19 | LS25 (Garforth, Kippax) | £282 |
| 20 | LS1 (City Centre) | £288 |
| 21 | LS15 (Cross Gates, Manston) | £293 |
| 22 | LS24 (Tadcaster) | £295 |
| 23 | LS19 (Yeadon, Rawdon) | £300 |
| 24 | LS7 (Chapel Allerton, Chapeltown) | £303 |
| 25 | LS16 (Bramhope, Adel) | £316 |
| 26 | LS21 (Otley) | £322 |
| 27 | LS20 (Guiseley, Menston) | £328 |
| 28 | LS18 (Horsforth) | £335 |
| 29 | LS17 (Roundhay, Moortown) | £337 |
| 30 | LS29 (Ilkley, Burley in Wharfedale) | £365 |
| 31 | LS22 (Wetherby, Collingham) | £370 |
| 32 | LS23 (Boston Spa, Clifford) | £373 |
LS11 Beeston at £178 and LS9 Harehills at £187 are the cheapest space in the city, the Victorian-terrace and ex-industrial postcodes south and east of the centre. LS11 sits directly in the South Bank regeneration corridor, so it pairs the lowest bricks-and-mortar rate in Leeds with the largest infrastructure programme the city has seen in decades.
LS1 at £288 is the outlier worth flagging. Its asking price is mid-table, but the per-square-foot rate runs high because the stock is almost entirely small city-centre flats, where you pay more for each foot of a compact unit. The genuine top of the table is the Wharfe Valley, LS23 Boston Spa at £373 and LS22 Wetherby at £370, where the rate reflects village character, schools and the commute into Leeds rather than a quirk of unit size.
For Sale Asking Prices in Leeds
Asking prices across Leeds run from £147,361 in LS2 to £475,247 in LS23 Boston Spa, with a mean of £291,071 across all 32 postcodes. Asking prices show what sellers are hoping for rather than what buyers pay, and the spread of more than £327,000 inside one boundary is among the widest of any UK city. That mean is the figure used in the comparison section later.
| Rank | Area | Asking Price |
|---|---|---|
| 1 | LS2 (City Centre) | £147,361 |
| 2 | LS11 (Beeston, Holbeck) | £168,799 |
| 3 | LS10 (Hunslet, Belle Isle) | £182,665 |
| 4 | LS9 (Harehills, Richmond Hill) | £186,603 |
| 5 | LS12 (Armley, Wortley) | £195,987 |
| 6 | LS3 (Woodhouse, Little Woodhouse) | £196,922 |
| 7 | LS13 (Bramley, Rodley) | £210,096 |
| 8 | WF10 (Castleford, Allerton Bywater) | £214,107 |
| 9 | LS1 (City Centre) | £218,038 |
| 10 | LS4 (Burley, Kirkstall) | £225,844 |
| 11 | LS27 (Morley, Gildersome) | £234,672 |
| 12 | LS7 (Chapel Allerton, Chapeltown) | £241,911 |
| 13 | LS5 (Kirkstall, Hawksworth) | £255,106 |
| 14 | LS14 (Seacroft, Whinmoor) | £267,924 |
| 15 | LS28 (Pudsey, Farsley) | £270,826 |
| 16 | LS26 (Rothwell, Woodlesford) | £274,416 |
| 17 | LS6 (Headingley, Hyde Park) | £279,346 |
| 18 | WF3 (East Ardsley, Tingley) | £281,091 |
| 19 | LS19 (Yeadon, Rawdon) | £287,169 |
| 20 | LS25 (Garforth, Kippax) | £306,364 |
| 21 | BD11 (Birkenshaw, Drighlington) | £309,497 |
| 22 | LS15 (Cross Gates, Manston) | £310,164 |
| 23 | LS8 (Roundhay, Oakwood) | £325,454 |
| 24 | LS18 (Horsforth) | £336,863 |
| 25 | LS21 (Otley) | £367,543 |
| 26 | LS20 (Guiseley, Menston) | £384,085 |
| 27 | LS24 (Tadcaster) | £389,479 |
| 28 | LS16 (Bramhope, Adel) | £421,082 |
| 29 | LS17 (Roundhay, Moortown) | £433,820 |
| 30 | LS29 (Ilkley, Burley in Wharfedale) | £449,543 |
| 31 | LS22 (Wetherby, Collingham) | £466,243 |
| 32 | LS23 (Boston Spa, Clifford) | £475,247 |
LS2 at £147,361 is the cheapest way into Leeds, a city-centre-fringe postcode of converted and purpose-built flats. Six of these postcodes sit below £200,000, and at a 30% deposit that is under £60,000 to buy in. The cluster from LS2 through LS9, LS11 and LS12 is where most Leeds landlords begin, and it is also where the strongest yields sit.
LS23 Boston Spa at £475,247, LS22 Wetherby at £466,243 and LS29 Ilkley at £449,543 anchor the other end. These are the Wharfe Valley market towns and the established northern suburbs, where owner-occupier demand from professionals sets the price and rental returns compress accordingly. They are capital-growth and lifestyle postcodes, not yield plays, and the rental tables below show why.
House Price Growth in Leeds
Five-year growth across Leeds runs from 35.7% in LS11 Beeston down to -12.4% in LS1, and that split is the clearest signal in the data: the cheap inner terraces grew, the city-centre flats fell. The strongest gains landed in the postcodes that started from the lowest base, while the LS1 flat market has gone backwards over every timeframe as supply outran demand. LS3 shows no usable reading because its thin transaction volume does not produce a reliable growth figure.
| Area | 1 Year | 3 Years | 5 Years |
|---|---|---|---|
| LS11 (Beeston, Holbeck) | 2.6% | 3.9% | 35.7% |
| LS23 (Boston Spa, Clifford) | 10.4% | 14.5% | 30.2% |
| LS12 (Armley, Wortley) | -1.1% | 3.6% | 27.7% |
| LS13 (Bramley, Rodley) | 2.0% | 7.0% | 24.3% |
| WF3 (East Ardsley, Tingley) | -5.7% | 1.7% | 24.3% |
| LS14 (Seacroft, Whinmoor) | 0.7% | 12.6% | 23.1% |
| LS4 (Burley, Kirkstall) | 3.7% | 2.7% | 23.0% |
| LS5 (Kirkstall, Hawksworth) | 4.8% | 7.9% | 22.8% |
| LS7 (Chapel Allerton, Chapeltown) | -5.0% | -1.6% | 22.8% |
| LS9 (Harehills, Richmond Hill) | -8.6% | 10.7% | 20.3% |
| LS10 (Hunslet, Belle Isle) | 1.1% | 8.0% | 17.7% |
| LS6 (Headingley, Hyde Park) | -0.9% | 6.1% | 17.5% |
| LS26 (Rothwell, Woodlesford) | 2.2% | 2.7% | 17.5% |
| LS8 (Roundhay, Oakwood) | 8.2% | 7.2% | 17.0% |
| BD11 (Birkenshaw, Drighlington) | -1.9% | 9.1% | 16.5% |
| LS28 (Pudsey, Farsley) | 0.1% | 3.4% | 16.4% |
| LS15 (Cross Gates, Manston) | 2.1% | -0.2% | 15.9% |
| LS17 (Roundhay, Moortown) | 2.0% | 1.8% | 15.5% |
| LS27 (Morley, Gildersome) | 0.0% | 4.2% | 15.4% |
| LS24 (Tadcaster) | 2.9% | 3.8% | 14.4% |
| WF10 (Castleford, Allerton Bywater) | -0.7% | 2.7% | 14.4% |
| LS25 (Garforth, Kippax) | 2.4% | 4.7% | 13.9% |
| LS18 (Horsforth) | 2.4% | -1.1% | 13.4% |
| LS2 (City Centre) | -2.2% | 2.3% | 12.0% |
| LS19 (Yeadon, Rawdon) | 2.1% | 1.3% | 11.5% |
| LS21 (Otley) | 7.1% | 9.0% | 10.6% |
| LS22 (Wetherby, Collingham) | 1.4% | 7.1% | 7.5% |
| LS29 (Ilkley, Burley in Wharfedale) | -5.1% | -5.3% | 4.9% |
| LS20 (Guiseley, Menston) | 1.0% | 10.9% | -1.6% |
| LS16 (Bramhope, Adel) | -1.4% | -5.0% | -2.5% |
| LS1 (City Centre) | -15.6% | -41.1% | -12.4% |
| LS3 (Woodhouse, Little Woodhouse) | Not enough data | Not enough data | Not enough data |
LS11 Beeston led at 35.7% over five years, with LS12 Armley at 27.7% and LS13 Bramley at 24.3% close behind. These are the affordable inner-south and inner-west terraces, exactly the stock that first-time buyers and investors turned to after the pandemic priced them out of the suburbs, and the demand pushed prices up hard from a low base. LS11 also sits in the South Bank corridor, which has supported it further.
LS1 stands alone at the bottom, down 41.1% over three years and 12.4% over five. The LS1 stock is almost entirely city-centre flats, and the early-2020s wave of apartment completions left more supply than the owner-occupier and investor markets could absorb at the prices being asked. It is the one Leeds postcode where the recent direction has been clearly down. LS29 Ilkley at 4.9% is the weakest of the suburban performers, a high-priced market town where growth stalled in the rate-shock period and has not recovered.
Monthly Property Sales in Leeds
Monthly sales range from just 2 in LS3 to 52 in WF10 Castleford, and the contrast says everything about where the market is liquid and where it is not. The suburban and ex-industrial postcodes turn over steadily; the city-centre postcodes barely transact. Turnover, the share of stock changing hands each year, runs from 3% in LS1 to 28% in LS3.
| Area | Sales Per Month | Turnover | Asking Price |
|---|---|---|---|
| WF10 (Castleford, Allerton Bywater) | 52 | 20% | £214,107 |
| LS25 (Garforth, Kippax) | 47 | 18% | £306,364 |
| LS27 (Morley, Gildersome) | 42 | 17% | £234,672 |
| LS16 (Bramhope, Adel) | 40 | 21% | £421,082 |
| LS8 (Roundhay, Oakwood) | 38 | 26% | £325,454 |
| LS12 (Armley, Wortley) | 38 | 15% | £195,987 |
| LS28 (Pudsey, Farsley) | 37 | 19% | £270,826 |
| LS29 (Ilkley, Burley in Wharfedale) | 37 | 18% | £449,543 |
| LS26 (Rothwell, Woodlesford) | 34 | 23% | £274,416 |
| LS13 (Bramley, Rodley) | 33 | 25% | £210,096 |
| LS15 (Cross Gates, Manston) | 33 | 11% | £310,164 |
| WF3 (East Ardsley, Tingley) | 33 | 14% | £281,091 |
| LS17 (Roundhay, Moortown) | 32 | 9% | £433,820 |
| LS9 (Harehills, Richmond Hill) | 30 | 10% | £186,603 |
| LS6 (Headingley, Hyde Park) | 28 | 16% | £279,346 |
| LS10 (Hunslet, Belle Isle) | 27 | 11% | £182,665 |
| LS14 (Seacroft, Whinmoor) | 27 | 14% | £267,924 |
| LS11 (Beeston, Holbeck) | 22 | 12% | £168,799 |
| LS19 (Yeadon, Rawdon) | 22 | 22% | £287,169 |
| LS22 (Wetherby, Collingham) | 20 | 13% | £466,243 |
| LS21 (Otley) | 19 | 26% | £367,543 |
| LS7 (Chapel Allerton, Chapeltown) | 18 | 16% | £241,911 |
| LS18 (Horsforth) | 18 | 19% | £336,863 |
| LS20 (Guiseley, Menston) | 15 | 36% | £384,085 |
| LS24 (Tadcaster) | 12 | 11% | £389,479 |
| BD11 (Birkenshaw, Drighlington) | 11 | 12% | £309,497 |
| LS4 (Burley, Kirkstall) | 8 | 21% | £225,844 |
| LS23 (Boston Spa, Clifford) | 7 | 8% | £475,247 |
| LS5 (Kirkstall, Hawksworth) | 6 | 14% | £255,106 |
| LS1 (City Centre) | 5 | 3% | £218,038 |
| LS2 (City Centre) | 5 | 6% | £147,361 |
| LS3 (Woodhouse, Little Woodhouse) | 2 | 28% | £196,922 |
WF10 Castleford leads on volume at 52 sales a month, the busiest postcode in the city, with LS25 Garforth at 47 and LS27 Morley at 42 not far behind. These are deep, family-driven suburban markets where stock moves and an exit is rarely a problem. LS3 records the opposite extreme at 2 sales a month, although its 28% turnover shows that what little stock there is changes hands often, a small market rather than a stagnant one.
The city-centre postcodes show the warning. LS1 and LS2 manage only 5 sales a month each, and LS1's 3% turnover is the lowest in the city. A high yield in LS2 comes paired with a market that barely transacts, so an investor buying there is buying income, not a quick exit. The selling-time data below makes that trade-off explicit.
How Long Properties Take to Sell in Leeds
LS3 clears in about 92 days while a flat in LS1 sits for roughly 1,014 days, the starkest exit-liquidity gap in the city and the single biggest thing a yield table hides. Days on market is the typical time a home is listed before it sells; months of unsold stock shows how much for-sale supply is queued at the current sales rate.
| Area | Avg Days to Sell | Months of Unsold Stock | Market |
|---|---|---|---|
| LS3 (Woodhouse, Little Woodhouse) | 92 | 3.0 | Seller's market |
| LS13 (Bramley, Rodley) | 122 | 4.0 | Seller's market |
| WF10 (Castleford, Allerton Bywater) | 145 | 4.8 | Seller's market |
| LS27 (Morley, Gildersome) | 160 | 5.3 | Seller's market |
| LS4 (Burley, Kirkstall) | 169 | 5.6 | Seller's market |
| LS7 (Chapel Allerton, Chapeltown) | 169 | 5.6 | Seller's market |
| LS6 (Headingley, Hyde Park) | 190 | 6.3 | Balanced market |
| LS12 (Armley, Wortley) | 203 | 6.7 | Balanced market |
| LS29 (Ilkley, Burley in Wharfedale) | 203 | 6.7 | Balanced market |
| LS5 (Kirkstall, Hawksworth) | 217 | 7.1 | Balanced market |
| LS11 (Beeston, Holbeck) | 254 | 8.3 | Balanced market |
| LS10 (Hunslet, Belle Isle) | 277 | 9.1 | Balanced market |
| LS9 (Harehills, Richmond Hill) | 304 | 10.0 | Balanced market |
| LS17 (Roundhay, Moortown) | 338 | 11.1 | Balanced market |
| LS2 (City Centre) | 507 | 16.7 | Buyer's market |
| LS1 (City Centre) | 1014 | 33.3 | Buyer's market |
The two highest-yielding city-centre postcodes are also the two slowest to sell. LS2 carries the top yield at 8.9% but takes around 507 days to find a buyer, with 16.7 months of unsold stock; LS1 is slower again at roughly 1,014 days. That is the cost the yield figure leaves out: strong rental income tied to a market where, when you come to sell, the queue of unsold flats ahead of you is long. The suburban postcodes that yield less, LS13 and WF10 among them, clear in a third of the time.
What Type of Property Can You Buy in Leeds?
The housing mix flips completely across the city: LS1 is 97.5% flats while LS17 Roundhay is 50.5% detached, and that split lines up almost exactly with the yield and growth data. The figures below are drawn from 2021 Census records for each postcode and shape which strategies fit where.
| Area | Detached | Semi-detached | Terraced | Flats |
|---|---|---|---|---|
| LS21 (Otley) | 58.9% | 24.1% | 12.9% | 3.8% |
| LS24 (Tadcaster) | 55.4% | 26.1% | 12.9% | 5.2% |
| LS25 (Garforth, Kippax) | 52.2% | 26.1% | 17.1% | 4.3% |
| LS17 (Roundhay, Moortown) | 50.5% | 28.3% | 13.3% | 7.4% |
| LS22 (Wetherby, Collingham) | 47.0% | 28.9% | 16.8% | 6.2% |
| LS29 (Ilkley, Burley in Wharfedale) | 45.2% | 21.8% | 14.3% | 15.4% |
| LS23 (Boston Spa, Clifford) | 44.3% | 36.0% | 14.0% | 5.5% |
| LS16 (Bramhope, Adel) | 40.7% | 35.8% | 8.5% | 11.5% |
| LS15 (Cross Gates, Manston) | 35.4% | 47.6% | 11.8% | 4.9% |
| LS26 (Rothwell, Woodlesford) | 34.9% | 37.0% | 22.9% | 3.2% |
| WF3 (East Ardsley, Tingley) | 33.2% | 36.3% | 22.6% | 7.6% |
| LS14 (Seacroft, Whinmoor) | 32.9% | 43.1% | 15.1% | 8.8% |
| LS18 (Horsforth) | 32.0% | 43.1% | 14.9% | 10.0% |
| LS20 (Guiseley, Menston) | 31.3% | 20.9% | 12.9% | 6.8% |
| BD11 (Birkenshaw, Drighlington) | 31.3% | 35.2% | 26.3% | 6.9% |
| LS19 (Yeadon, Rawdon) | 27.7% | 35.4% | 23.2% | 13.3% |
| WF10 (Castleford, Allerton Bywater) | 27.2% | 36.3% | 30.9% | 5.5% |
| LS27 (Morley, Gildersome) | 24.9% | 38.6% | 25.9% | 8.8% |
| LS28 (Pudsey, Farsley) | 22.2% | 34.4% | 28.1% | 15.0% |
| LS8 (Roundhay, Oakwood) | 22.0% | 39.9% | 13.7% | 24.5% |
| LS9 (Harehills, Richmond Hill) | 17.4% | 47.9% | 18.1% | 16.4% |
| LS6 (Headingley, Hyde Park) | 12.7% | 39.1% | 20.0% | 28.2% |
| LS10 (Hunslet, Belle Isle) | 12.6% | 36.0% | 29.2% | 22.1% |
| LS12 (Armley, Wortley) | 12.0% | 34.7% | 30.7% | 20.0% |
| LS13 (Bramley, Rodley) | 11.9% | 39.0% | 29.9% | 19.0% |
| LS11 (Beeston, Holbeck) | 9.2% | 23.3% | 28.8% | 38.3% |
| LS7 (Chapel Allerton, Chapeltown) | 5.8% | 36.4% | 27.4% | 30.5% |
| LS5 (Kirkstall, Hawksworth) | 4.8% | 35.8% | 31.2% | 28.3% |
| LS4 (Burley, Kirkstall) | 3.8% | 28.7% | 45.0% | 22.6% |
| LS3 (Woodhouse, Little Woodhouse) | 1.8% | 3.7% | 13.9% | 80.3% |
| LS2 (City Centre) | 1.1% | 2.9% | 8.5% | 87.6% |
| LS1 (City Centre) | 0.5% | 0.5% | 1.4% | 97.5% |
LS1, LS2 and LS3 are flat markets first and foremost, 97.5%, 87.6% and 80.3% flats respectively. That stock suits single city-centre lets and student sharers, and it explains both the high headline yields and the thin resale market: flats are easy to let and slow to sell. LS4 Burley is the terraced exception in the inner west at 45.0% terraced, the classic Leeds back-to-back and through-terrace stock that drives the student and young-professional letting market.
LS17 Roundhay and LS29 Ilkley sit at the other end, half detached or more, with single-figure to mid-teens flat shares. This is family owner-occupier territory, which matches their premium prices and the lowest yields in the city. The smaller homes that usually carry buy-to-let, terraces and flats, are most concentrated in the inner belt from LS11 through to LS3, exactly where the yields are strongest. For a street-level view of the top end, see our Land Registry ranking of Leeds' most expensive streets, which uses the wider Leeds postal town rather than the council boundary.
Flats combine purpose-built and converted units. A small share of mobile and temporary dwellings is not shown, so rows may not total 100%.

Leeds Rental Market Analysis
Across the postcodes with rental data, monthly rents run from £851 in WF10 to £1,919 in LS22 Wetherby, and gross yields from 3.1% in LS16 to 8.9% in LS2. For investors weighing whether buy-to-let is worth it in Leeds, the sections below break down rents, yields and tenant affordability postcode by postcode. If you are working out how to get into property in Yorkshire, Leeds gives more room than most to pick a point on the risk-and-return line. Browse current buy-to-let homes for sale across the region.
Average Rent & Gross Rental Yields in Leeds
LS2 leads on gross yield at 8.9%, where £1,097 a month meets the city's lowest asking price of £147,361. The city-centre and inner-west postcodes hold the top of the table, with LS6 Headingley at 8.2% and LS4 Burley at 8.0% running on student and shared-house demand. The premium northern suburbs sit at the bottom, LS16 Bramhope at 3.1% and LS29 Ilkley at 3.6%, where high prices compress the return.
| Area | Average Monthly Rent | Asking Price | Gross Yield |
|---|---|---|---|
| LS2 (City Centre) | £1,097 | £147,361 | 8.9% |
| LS6 (Headingley, Hyde Park) | £1,902 | £279,346 | 8.2% |
| LS4 (Burley, Kirkstall) | £1,511 | £225,844 | 8.0% |
| LS3 (Woodhouse, Little Woodhouse) | £1,269 | £196,922 | 7.7% |
| LS10 (Hunslet, Belle Isle) | £1,053 | £182,665 | 6.9% |
| LS9 (Harehills, Richmond Hill) | £1,038 | £186,603 | 6.7% |
| LS11 (Beeston, Holbeck) | £920 | £168,799 | 6.5% |
| LS12 (Armley, Wortley) | £989 | £195,987 | 6.1% |
| LS1 (City Centre) | £1,074 | £218,038 | 5.9% |
| LS5 (Kirkstall, Hawksworth) | £1,237 | £255,106 | 5.8% |
| LS13 (Bramley, Rodley) | £975 | £210,096 | 5.6% |
| LS7 (Chapel Allerton, Chapeltown) | £1,078 | £241,911 | 5.3% |
| LS14 (Seacroft, Whinmoor) | £1,129 | £267,924 | 5.1% |
| LS22 (Wetherby, Collingham) | £1,919 | £466,243 | 4.9% |
| WF10 (Castleford, Allerton Bywater) | £851 | £214,107 | 4.8% |
| LS27 (Morley, Gildersome) | £918 | £234,672 | 4.7% |
| LS25 (Garforth, Kippax) | £1,149 | £306,364 | 4.5% |
| WF3 (East Ardsley, Tingley) | £975 | £281,091 | 4.2% |
| LS15 (Cross Gates, Manston) | £1,067 | £310,164 | 4.1% |
| LS28 (Pudsey, Farsley) | £909 | £270,826 | 4.0% |
| LS19 (Yeadon, Rawdon) | £935 | £287,169 | 3.9% |
| LS8 (Roundhay, Oakwood) | £999 | £325,454 | 3.7% |
| LS17 (Roundhay, Moortown) | £1,348 | £433,820 | 3.7% |
| LS18 (Horsforth) | £1,051 | £336,863 | 3.7% |
| LS29 (Ilkley, Burley in Wharfedale) | £1,346 | £449,543 | 3.6% |
| LS16 (Bramhope, Adel) | £1,087 | £421,082 | 3.1% |
| LS26 (Rothwell, Woodlesford) | Not enough data | £274,416 | Not enough data |
| BD11 (Birkenshaw, Drighlington) | Not enough data | £309,497 | Not enough data |
| LS21 (Otley) | Not enough data | £367,543 | Not enough data |
| LS20 (Guiseley, Menston) | Not enough data | £384,085 | Not enough data |
| LS24 (Tadcaster) | Not enough data | £389,479 | Not enough data |
| LS23 (Boston Spa, Clifford) | Not enough data | £475,247 | Not enough data |
LS2 at 8.9% pairs the lowest asking price in Leeds with a £1,097 rent. A 30% deposit there is £44,208, the cheapest entry into the highest-yielding postcode in the city. The catch sits in the selling-time table above: LS2 is a buyer's market on exit, so the income comes with a slow resale.
LS6 Headingley at 8.2% and £1,902 a month reflects the HMO and student economy rather than single lets. The headline rent is whole-house income from shared student lets near the universities, not what one tenant pays, and LS4 at 8.0% works the same way. These have been Leeds buy-to-let staples for decades, with the trade-off of summer voids and hands-on management.
LS16 Bramhope at 3.1%, LS29 Ilkley at 3.6% and LS17 Roundhay at 3.7% sit at the bottom. These carry respectable rents in absolute terms, from £1,087 to £1,348 a month, but asking prices above £420,000 leave the income return compressed. In the premium northern and Wharfe Valley postcodes the high price does more for capital value than for yield.
Gross Rental Yield by Postcode
Is Leeds Rent High?
Monthly rents in Leeds take between 27.8% in WF10 and 62.7% in LS22 of the local median gross monthly salary. The widely cited affordability line is 30% of gross income. WF10 and LS27 sit below it, while the student-heavy and market-town postcodes top the table, the student areas because their headline rent is whole-house income rather than what a single tenant pays.
The median gross weekly salary in Leeds is £706.10, which equates to £3,060 per month or £36,716 per year. This is above the Yorkshire and the Humber median of £669.90 per week and below the Great Britain median of £752.40 per week. Data from the Nomis Labour Market Profile (ASHE 2025).
| Rank | Area | Rent as % of Income |
|---|---|---|
| 1 | LS22 (Wetherby, Collingham) | 62.7% |
| 2 | LS6 (Headingley, Hyde Park) | 62.2% |
| 3 | LS4 (Burley, Kirkstall) | 49.4% |
| 4 | LS17 (Roundhay, Moortown) | 44.0% |
| 5 | LS29 (Ilkley, Burley in Wharfedale) | 44.0% |
| 6 | LS3 (Woodhouse, Little Woodhouse) | 41.5% |
| 7 | LS5 (Kirkstall, Hawksworth) | 40.4% |
| 8 | LS25 (Garforth, Kippax) | 37.5% |
| 9 | LS14 (Seacroft, Whinmoor) | 36.9% |
| 10 | LS2 (City Centre) | 35.9% |
| 11 | LS16 (Bramhope, Adel) | 35.5% |
| 12 | LS7 (Chapel Allerton, Chapeltown) | 35.2% |
| 13 | LS1 (City Centre) | 35.1% |
| 14 | LS15 (Cross Gates, Manston) | 34.9% |
| 15 | LS10 (Hunslet, Belle Isle) | 34.4% |
| 16 | LS18 (Horsforth) | 34.3% |
| 17 | LS9 (Harehills, Richmond Hill) | 33.9% |
| 18 | LS8 (Roundhay, Oakwood) | 32.6% |
| 19 | LS12 (Armley, Wortley) | 32.3% |
| 20 | LS13 (Bramley, Rodley) | 31.9% |
| 21 | WF3 (East Ardsley, Tingley) | 31.9% |
| 22 | LS19 (Yeadon, Rawdon) | 30.6% |
| 23 | LS11 (Beeston, Holbeck) | 30.1% |
| 24 | LS27 (Morley, Gildersome) | 30.0% |
| 25 | LS28 (Pudsey, Farsley) | 29.7% |
| 26 | WF10 (Castleford, Allerton Bywater) | 27.8% |
| - | LS26 (Rothwell, Woodlesford) | Not enough data |
| - | BD11 (Birkenshaw, Drighlington) | Not enough data |
| - | LS21 (Otley) | Not enough data |
| - | LS20 (Guiseley, Menston) | Not enough data |
| - | LS24 (Tadcaster) | Not enough data |
| - | LS23 (Boston Spa, Clifford) | Not enough data |
WF10 Castleford at 27.8% and LS27 Morley at 30.0% are the most affordable for tenants. Modest rents against the local wage mean less financial strain, and that usually shows up as fewer arrears and longer tenancies. For a landlord those postcodes trade a lower yield for a steadier tenant.
LS22 Wetherby tops the table at 62.7%, but that is a genuine market-town reading: a £1,919 average rent against the city median wage, reflecting larger family homes in an affluent commuter town rather than a measurement quirk. LS6 at 62.2% and LS4 at 49.4% sit just behind for a different reason: those are HMO-dominated areas where the £1,902 and £1,511 figures are shared-house rents across several tenants, not one income. A student paying £450 a month for a room in a five-bed Headingley let is nowhere near 62% of a graduate salary, so the measure reads meaningfully for single-let postcodes and overstates the strain in the student belt.
How Big Is Leeds's Private Rented Sector?
The private rented sector runs deepest in the city centre, where it accounts for 71.2% of LS1 households, 68.1% in LS2 and 61.1% in LS3, the largest established tenant pools in the city. The share of homes already rented privately shows how tested the local lettings market is, and in central Leeds it is as deep as anywhere in the north of England.
| Area | Owned Outright | Owned with Mortgage | Private Rented | Social Rented |
|---|---|---|---|---|
| LS1 (City Centre) | 5.1% | 10.1% | 71.2% | 13.1% |
| LS2 (City Centre) | 4.2% | 6.4% | 68.1% | 21.0% |
| LS3 (Woodhouse, Little Woodhouse) | 4.4% | 5.7% | 61.1% | 28.2% |
| LS4 (Burley, Kirkstall) | 17.4% | 19.2% | 47.2% | 15.5% |
| LS11 (Beeston, Holbeck) | 19.0% | 18.1% | 34.7% | 27.4% |
| LS6 (Headingley, Hyde Park) | 22.6% | 24.5% | 31.5% | 20.3% |
| LS5 (Kirkstall, Hawksworth) | 14.8% | 20.1% | 28.5% | 36.1% |
| LS7 (Chapel Allerton, Chapeltown) | 19.6% | 23.7% | 22.7% | 33.0% |
| LS12 (Armley, Wortley) | 21.3% | 34.6% | 21.3% | 22.1% |
| LS23 (Boston Spa, Clifford) | 42.3% | 31.6% | 21.1% | 4.6% |
| LS10 (Hunslet, Belle Isle) | 21.8% | 27.0% | 20.7% | 29.7% |
| LS8 (Roundhay, Oakwood) | 33.5% | 32.3% | 19.7% | 14.0% |
| LS28 (Pudsey, Farsley) | 33.2% | 36.6% | 18.6% | 11.1% |
| LS21 (Otley) | 49.9% | 28.3% | 18.0% | 3.5% |
| LS17 (Roundhay, Moortown) | 47.0% | 31.5% | 16.6% | 4.7% |
| LS27 (Morley, Gildersome) | 28.8% | 45.2% | 16.5% | 8.2% |
| WF10 (Castleford, Allerton Bywater) | 29.2% | 38.1% | 16.5% | 14.7% |
| LS13 (Bramley, Rodley) | 24.7% | 37.4% | 16.1% | 21.0% |
| LS24 (Tadcaster) | 43.1% | 35.8% | 16.0% | 4.5% |
| LS19 (Yeadon, Rawdon) | 38.1% | 38.8% | 15.6% | 6.9% |
| LS9 (Harehills, Richmond Hill) | 28.0% | 22.4% | 15.0% | 33.7% |
| LS22 (Wetherby, Collingham) | 46.4% | 32.1% | 14.8% | 6.0% |
| BD11 (Birkenshaw, Drighlington) | 37.0% | 39.4% | 14.8% | 7.7% |
| LS26 (Rothwell, Woodlesford) | 35.8% | 41.2% | 14.7% | 7.8% |
| WF3 (East Ardsley, Tingley) | 35.5% | 38.5% | 14.3% | 10.9% |
| LS25 (Garforth, Kippax) | 38.8% | 38.5% | 14.1% | 7.3% |
| LS29 (Ilkley, Burley in Wharfedale) | 55.0% | 28.4% | 13.0% | 3.0% |
| LS15 (Cross Gates, Manston) | 46.4% | 33.0% | 12.4% | 8.0% |
| LS18 (Horsforth) | 44.0% | 38.2% | 10.9% | 6.3% |
| LS14 (Seacroft, Whinmoor) | 38.1% | 33.9% | 10.5% | 16.4% |
| LS16 (Bramhope, Adel) | 46.0% | 35.1% | 10.0% | 7.7% |
| LS20 (Guiseley, Menston) | 55.5% | 28.6% | 9.8% | 4.8% |
LS1, LS2 and LS3 are rental markets first: between three-fifths and seven-tenths of their households rent privately, against a city centre where owner-occupation is barely in double figures. That depth is what underpins the high inner-city yields, and the rental listings bear it out, with hundreds of homes advertised to let at any time in LS2 and LS6. The flip side is plenty of competing supply, so these read as tenant's markets where rents are keenly set rather than landlord-dictated.
LS29 Ilkley at 13.0% and LS17 Roundhay at 16.6% have the smallest rented sectors, paired with outright ownership above 47%. These are settled owner-occupier suburbs where the rental market is a thin slice of the whole, which fits their low yields and family-home stock.
Local Housing Allowance Rates in Leeds
Most of Leeds falls within the Leeds Broad Rental Market Area, where Local Housing Allowance runs from £80.00 a week for a shared room to £276.16 a week for a four-bedroom home, though the southern and eastern fringe sits in separate areas with lower rates. Local Housing Allowance is the maximum housing support a tenant on benefits can claim, so it works as a rent floor for that part of the market. The rates below apply across the bulk of the city. To check the rate for a specific address, use the government's official Local Housing Allowance calculator.
| Property Size | Weekly LHA Rate | Monthly Equivalent |
|---|---|---|
| Shared accommodation | £80.00 | £347 |
| 1 bedroom | £155.34 | £673 |
| 2 bedrooms | £178.36 | £773 |
| 3 bedrooms | £195.62 | £848 |
| 4 bedrooms | £276.16 | £1,197 |
The two-bedroom Leeds BRMA rate of £178.36 a week works out at about £773 a month, which sits below the open-market rents recorded across most of the city's postcodes. A benefit-backed tenancy at the LHA rate therefore lands under Leeds's market rents, and the stock that fits inside it concentrates in the lower-priced postcodes such as WF10, LS11 and LS12.
Leeds is not a single LHA area, and the boundary matters at the edges. WF10 Castleford falls in the Wakefield BRMA, where rates are lower across the board: £75.25 a week for shared accommodation, £115.07 for a one-bed, £136.93 for two beds, £166.85 for three and £203.67 for four. The Tadcaster postcode on the eastern edge sits in the York BRMA. A landlord pricing a benefit-funded let on the city's fringe needs the rate for the right area, not the headline Leeds figure.
Buy-to-Let Considerations
Are Leeds House Prices High? Price-to-Earnings Ratios
Buying in Leeds takes between 4.0 and 12.9 times the median annual salary depending on the postcode. This is based on the Nomis Labour Market Profile for Leeds, which puts the median gross annual income for Leeds residents at £36,716.
The national benchmark for price-to-earnings is 7.4x (England's average sold price of £289,946 divided by the Great Britain median annual salary of £39,125). Fourteen of the 32 postcodes sit below that line, so close to half the city is more affordable against local incomes than the England average is against national ones, with the whole inner belt well under it.
| Rank | Area | Price-to-Earnings Ratio |
|---|---|---|
| 1 | LS2 (City Centre) | 4.0x |
| 2 | LS11 (Beeston, Holbeck) | 4.6x |
| 3 | LS10 (Hunslet, Belle Isle) | 5.0x |
| 4 | LS9 (Harehills, Richmond Hill) | 5.1x |
| 5 | LS12 (Armley, Wortley) | 5.3x |
| 6 | LS3 (Woodhouse, Little Woodhouse) | 5.4x |
| 7 | LS13 (Bramley, Rodley) | 5.7x |
| 8 | WF10 (Castleford, Allerton Bywater) | 5.8x |
| 9 | LS1 (City Centre) | 5.9x |
| 10 | LS4 (Burley, Kirkstall) | 6.2x |
| 11 | LS27 (Morley, Gildersome) | 6.4x |
| 12 | LS7 (Chapel Allerton, Chapeltown) | 6.6x |
| 13 | LS5 (Kirkstall, Hawksworth) | 6.9x |
| 14 | LS14 (Seacroft, Whinmoor) | 7.3x |
| 15 | LS28 (Pudsey, Farsley) | 7.4x |
| 16 | LS26 (Rothwell, Woodlesford) | 7.5x |
| 17 | LS6 (Headingley, Hyde Park) | 7.6x |
| 18 | WF3 (East Ardsley, Tingley) | 7.7x |
| 19 | LS19 (Yeadon, Rawdon) | 7.8x |
| 20 | LS25 (Garforth, Kippax) | 8.3x |
| 21 | LS15 (Cross Gates, Manston) | 8.4x |
| 22 | BD11 (Birkenshaw, Drighlington) | 8.4x |
| 23 | LS8 (Roundhay, Oakwood) | 8.9x |
| 24 | LS18 (Horsforth) | 9.2x |
| 25 | LS21 (Otley) | 10.0x |
| 26 | LS20 (Guiseley, Menston) | 10.5x |
| 27 | LS24 (Tadcaster) | 10.6x |
| 28 | LS16 (Bramhope, Adel) | 11.5x |
| 29 | LS17 (Roundhay, Moortown) | 11.8x |
| 30 | LS29 (Ilkley, Burley in Wharfedale) | 12.2x |
| 31 | LS22 (Wetherby, Collingham) | 12.7x |
| 32 | LS23 (Boston Spa, Clifford) | 12.9x |
LS2 at 4.0x is the most affordable entry against local wages, well under the 7.4x benchmark. The whole inner belt from LS2 through LS11, LS10, LS9 and LS12 comes in under 5.5x, which is what keeps a £40,000 to £60,000 budget in range of a postcode still yielding above 6 per cent.
LS23 Boston Spa at 12.9x and LS22 Wetherby at 12.7x sit well above the benchmark, with LS29 Ilkley and LS17 Roundhay close behind. At more than twelve times local earnings these are owner-occupier markets where buyers are often dual-income households or trading down from the south, and the high ratio is exactly why yields in these postcodes sit near or below 3.6%.
Deposit Requirements in Leeds
A 30% deposit on a Leeds buy-to-let runs from £44,208 in LS2 to £142,574 in LS23. That £98,000 gap is the difference between a city-centre flat and a Wharfe Valley family home, more than three times the cheapest deposit. Beyond the deposit, the stamp duty land tax and the wider costs of buy-to-let shape the total capital required.
| Rank | Area | 30% Deposit Required |
|---|---|---|
| 1 | LS2 (City Centre) | £44,208 |
| 2 | LS11 (Beeston, Holbeck) | £50,640 |
| 3 | LS10 (Hunslet, Belle Isle) | £54,799 |
| 4 | LS9 (Harehills, Richmond Hill) | £55,981 |
| 5 | LS12 (Armley, Wortley) | £58,796 |
| 6 | LS3 (Woodhouse, Little Woodhouse) | £59,077 |
| 7 | LS13 (Bramley, Rodley) | £63,029 |
| 8 | WF10 (Castleford, Allerton Bywater) | £64,232 |
| 9 | LS1 (City Centre) | £65,411 |
| 10 | LS4 (Burley, Kirkstall) | £67,753 |
| 11 | LS27 (Morley, Gildersome) | £70,402 |
| 12 | LS7 (Chapel Allerton, Chapeltown) | £72,573 |
| 13 | LS5 (Kirkstall, Hawksworth) | £76,532 |
| 14 | LS14 (Seacroft, Whinmoor) | £80,377 |
| 15 | LS28 (Pudsey, Farsley) | £81,248 |
| 16 | LS26 (Rothwell, Woodlesford) | £82,325 |
| 17 | LS6 (Headingley, Hyde Park) | £83,804 |
| 18 | WF3 (East Ardsley, Tingley) | £84,327 |
| 19 | LS19 (Yeadon, Rawdon) | £86,151 |
| 20 | LS25 (Garforth, Kippax) | £91,909 |
| 21 | BD11 (Birkenshaw, Drighlington) | £92,849 |
| 22 | LS15 (Cross Gates, Manston) | £93,049 |
| 23 | LS8 (Roundhay, Oakwood) | £97,636 |
| 24 | LS18 (Horsforth) | £101,059 |
| 25 | LS21 (Otley) | £110,263 |
| 26 | LS20 (Guiseley, Menston) | £115,226 |
| 27 | LS24 (Tadcaster) | £116,844 |
| 28 | LS16 (Bramhope, Adel) | £126,324 |
| 29 | LS17 (Roundhay, Moortown) | £130,146 |
| 30 | LS29 (Ilkley, Burley in Wharfedale) | £134,863 |
| 31 | LS22 (Wetherby, Collingham) | £139,873 |
| 32 | LS23 (Boston Spa, Clifford) | £142,574 |
LS2 at £44,208 is the cheapest way into Leeds, and it lands on the highest yield in the city at 8.9%. Stepping up to LS11 Beeston costs about £6,000 more and buys the strongest five-year growth in the data at 35.7%, on a still-healthy 6.5% yield, in a postcode sitting in the South Bank regeneration corridor. The two cheapest deposits in Leeds buy two different things: LS2 for income now, LS11 for income plus the growth that has actually shown up.
At the top, the Wharfe Valley towns of LS23 Boston Spa and LS22 Wetherby ask £142,574 and £139,873 at 30% down, more than three times the LS2 deposit, for postcodes too thin on rental listings to read a reliable yield. The extra capital buys a detached family home in a settled market town that has held its value, not rental income. That is the choice the deposit ladder makes plain: the cheap end of Leeds is the high-yield end, and the money you save on the deposit is the money the inner belt pays back in rent.
What the Leeds Data Tells Buy-to-Let Investors
Leeds is really two markets in one city, and the data draws the line cleanly. The inner belt from LS2 through LS11, LS9 and LS12 carries the high yields, the cheapest deposits and the strongest five-year growth: LS2 at 8.9% on a £44,208 deposit, LS11 at 6.5% with 35.7% growth behind it, and a clutch of postcodes under 5.5 times local earnings for buying an investment property in Leeds. This is where most Leeds landlords start.
The student belt is its own game. LS6 Headingley at 8.2% and LS4 Burley at 8.0% post strong headline yields, but those are whole-house figures from the HMO and shared-let market, with summer voids and hands-on management behind them. The income is real, the work is heavier, and the affordability table reads high because the rent is split across several tenants rather than one.
The city-centre flats are the cautionary part. LS2 tops the yield table, but it and LS1 are the slowest postcodes to sell in Leeds, LS1 down 41.1% over three years as the early-2020s apartment supply outran demand. A city-centre flat is easy to let and slow to exit, so it suits an income hold rather than a quick turnaround. To come in below asking on any of these, the cheaper stock tends to move through off-market property in Leeds before it reaches the portals.
At the other end, LS17 Roundhay and LS29 Ilkley sit near 3.6% on deposits above £130,000. With a financial-services wage base, 74.2% employment and the £270 million Connecting Leeds programme plus the South Bank build-out behind it, Leeds reads as a city where the inner postcodes carry the yield and the northern suburbs carry the capital value, with little overlap between them.
How Leeds Compares
Leeds has the highest mean asking price of five northern cities compared here at £291,071, yet its 8.9% top yield is beaten only by Bradford's thin single-postcode 12.0%. That combination is the point: most cities trade price against yield, but Leeds pairs the group's highest price with a near-top return, because its top yield comes from the cheap LS2 flat market rather than the city average. The mean asking price and mean monthly rent are simple averages across all postcodes with data; top gross yield is the single highest postcode yield in each city.
| Location | Mean Asking Price | Mean Monthly Rent | Mean Gross Yield | Top Yield (postcode) |
|---|---|---|---|---|
| Liverpool | £210,314 | £904 | 5.2% | 8.0% (L2) |
| Bradford | £226,164 | £849 | 4.5% | 12.0% (BD1) |
| Sheffield | £240,169 | £935 | 4.7% | 8.5% (S3) |
| Manchester | £268,032 | £1,312 | 5.9% | 8.1% (M14) |
| Leeds | £291,071 | £1,147 | 4.7% | 8.9% (LS2) |
Leeds is the most expensive city in this group on mean asking price, but the gap narrows once the housing mix is read alongside it. The 32-postcode mean is pulled up by the Wharfe Valley market towns, while the inner belt where investors actually buy sits well below it. On top yield, Bradford's thin BD1 market reads highest at 12.0%; among the big-city markets Leeds leads at 8.9%, just ahead of Sheffield at 8.5% and Manchester at 8.1%.
For the lowest mean asking prices, Liverpool at £210,314 and Bradford at £226,164 sit below the rest, with Bradford the cheapest mean rent at £849. Manchester carries the highest mean rent at £1,312, reflecting its larger city-centre rental stock. Leeds's draw is the breadth between its postcodes rather than a single number, and for a data-led view across every UK market, see our best buy-to-let areas guide. Leeds is one of the 160-plus town and city guides we publish on property investment in the UK.
Frequently Asked Questions
Is Leeds a good place to live for buy-to-let tenants?
The pull is jobs and youth. Leeds runs the biggest economy in the north of England, with finance, the NHS, two universities and a growing tech sector spreading the tenant base across sectors rather than one employer. The population grew 8.05% in the decade to 2021, most of it landing in the inner postcodes, and that churn of graduates and young professionals is what keeps the city-centre rental market deep, with seven in ten LS1 households renting privately.
It is also a city that retains its graduates. The combination of a major-city jobs market and rents that stay below southern levels gives tenants a reason to stay put, which for a landlord tends to mean fewer voids in the inner belt.
What are the best areas in Leeds for property investment?
The city splits cleanly into three. The inner belt, LS2, LS11, LS9, LS10 and LS12, is the high-yield, low-deposit end, with yields from 6.1% to 8.9% on asking prices under £200,000. The student belt, LS6 Headingley and LS4 Burley, posts 8.0% to 8.2% but on shared-house HMO economics rather than single lets. The northern suburbs, LS17 and LS29, sit near 3.6% and are capital-growth and family-home markets.
So the right postcode follows the goal. If yield on a small deposit is the priority, the inner belt leads, with LS2 top of the table at 8.9%. If five-year growth matters more, LS11 Beeston has shown the strongest at 35.7%. The student belt rewards investors set up to run HMOs.
How does Leeds compare to Manchester for buy-to-let?
They are close on the headline numbers and different underneath. Manchester's mean asking price is £268,032 against Leeds's £291,071, and the top yields almost match, 8.1% in Manchester against 8.9% in Leeds. Manchester carries the higher mean rent at £1,312 against £1,147, on the back of a larger and more institutional city-centre rental market.
Leeds's edge is the spread between its postcodes. It runs from sub-£150,000 city-centre flats to £450,000 Wharfe Valley homes inside one boundary, so an investor can pick almost any point on the risk-and-return line without leaving the city. Manchester's market is more uniformly city-centre-driven. For a fuller breakdown, see our Manchester buy-to-let guide.
Is there demand for student accommodation in Leeds?
Heavily, and it shapes the whole inner-west market. The University of Leeds and Leeds Beckett bring tens of thousands of students into the city, and the demand concentrates in LS6 Headingley and Hyde Park, LS4 Burley and the LS2 and LS3 city-centre fringe. LS6 posts an 8.2% gross yield off a £1,902 average monthly rent, almost all of it whole-house income from shared lets near the campuses.
The trade-off is the work. Student HMOs come with summer voids, higher turnover and more management than a single let, and the affordability table reads high in LS6 because that rent is split across several rooms. For the purpose-built end of the market, see our guide to student property investment, and for how the sums work on a shared house, our HMO investment guide.
Before buying, check the HMO licence costs and rules; our guide includes Leeds' current council fee benchmark and explains why planning permission is a separate question.
Can I find buy-to-let property under £200,000 in Leeds?
Across six postcodes, yes. LS2 at £147,361, LS11 at £168,799, LS10 at £182,665, LS9 at £186,603, LS12 at £195,987 and LS3 at £196,922 all average under £200,000 on asking prices. At a 30% deposit that is under £60,000 to buy in, and these are the same postcodes that carry the strongest yields.
By property type the entry is lower still. Flats across Leeds average £149,734 on the Land Registry index and terraces £203,487, so the city-centre flat and inner-terrace stock is where the sub-£200,000 buys sit. To come in below asking, the cheaper stock often moves through below market value channels first.
What are average house prices in Leeds?
The average sold price across Leeds is £244,430 on the Land Registry index, about 15.7% below the England average of £289,946 and 17.7% above the Yorkshire and the Humber regional figure of £207,750. By type, detached homes average £449,396, semi-detached £267,175, terraced £203,487 and flats £149,734.
Asking prices stretch much wider, from £147,361 in LS2 up to £449,543 in LS29, with a 32-postcode mean of £291,071. Through a buy-to-let lens, the cheap inner postcodes carry the highest yields and the expensive northern suburbs the lowest.
What type of property is most common in Leeds?
It depends entirely on where you look, and that is the unusual part. The city centre is almost all flats: LS1 is 97.5% flats, LS2 is 87.6% and LS3 is 80.3%. Move out to the suburbs and detached and semi-detached homes take over, with LS17 Roundhay at 50.5% detached and the WF10 and LS27 belt dominated by semis and terraces.
The smaller homes that usually carry buy-to-let, flats and terraces, concentrate in the inner belt from LS11 through to the city centre, which is exactly where the strongest yields sit.
What are the Local Housing Allowance rates in Leeds?
Most of Leeds falls in the Leeds Broad Rental Market Area. As of June 2026 the rates run at £80.00 a week for a shared room, £155.34 for a one-bed, £178.36 for two beds, £195.62 for three and £276.16 for four. That figure is the most a tenant on housing support can claim towards rent, so for that part of the market it effectively sets a floor.
The boundary matters on the fringe, though. WF10 Castleford sits in the lower Wakefield BRMA (£136.93 a week for a two-bed against Leeds's £178.36) and the Tadcaster postcode falls in the York area, so a benefit-funded let near the edge needs the rate for the right area. You can check any address on the government's Local Housing Allowance calculator.
How do I buy an investment property in Leeds?
Start with what the money is for, because in Leeds that points at a different part of the city. For yield on a small deposit, the inner belt leads, with LS2 at 8.9% on a £44,208 deposit and LS11 close behind on 6.5% with the strongest growth record. For a settled family-home hold, the northern suburbs like LS17 cost three times as much up front and the yield drops below 4 per cent. Budget for 30% down, which runs from about £44,000 in LS2 to £143,000 in LS23.
Beyond what is listed openly, plenty of experienced investors buy below asking through off-market property and BMV property. To see what is available now, browse investment properties in Leeds or buy-to-let homes for sale.
Ready to buy property?
Browse investment properties with prices and gross yields shown for each opportunity.
Get property alerts