

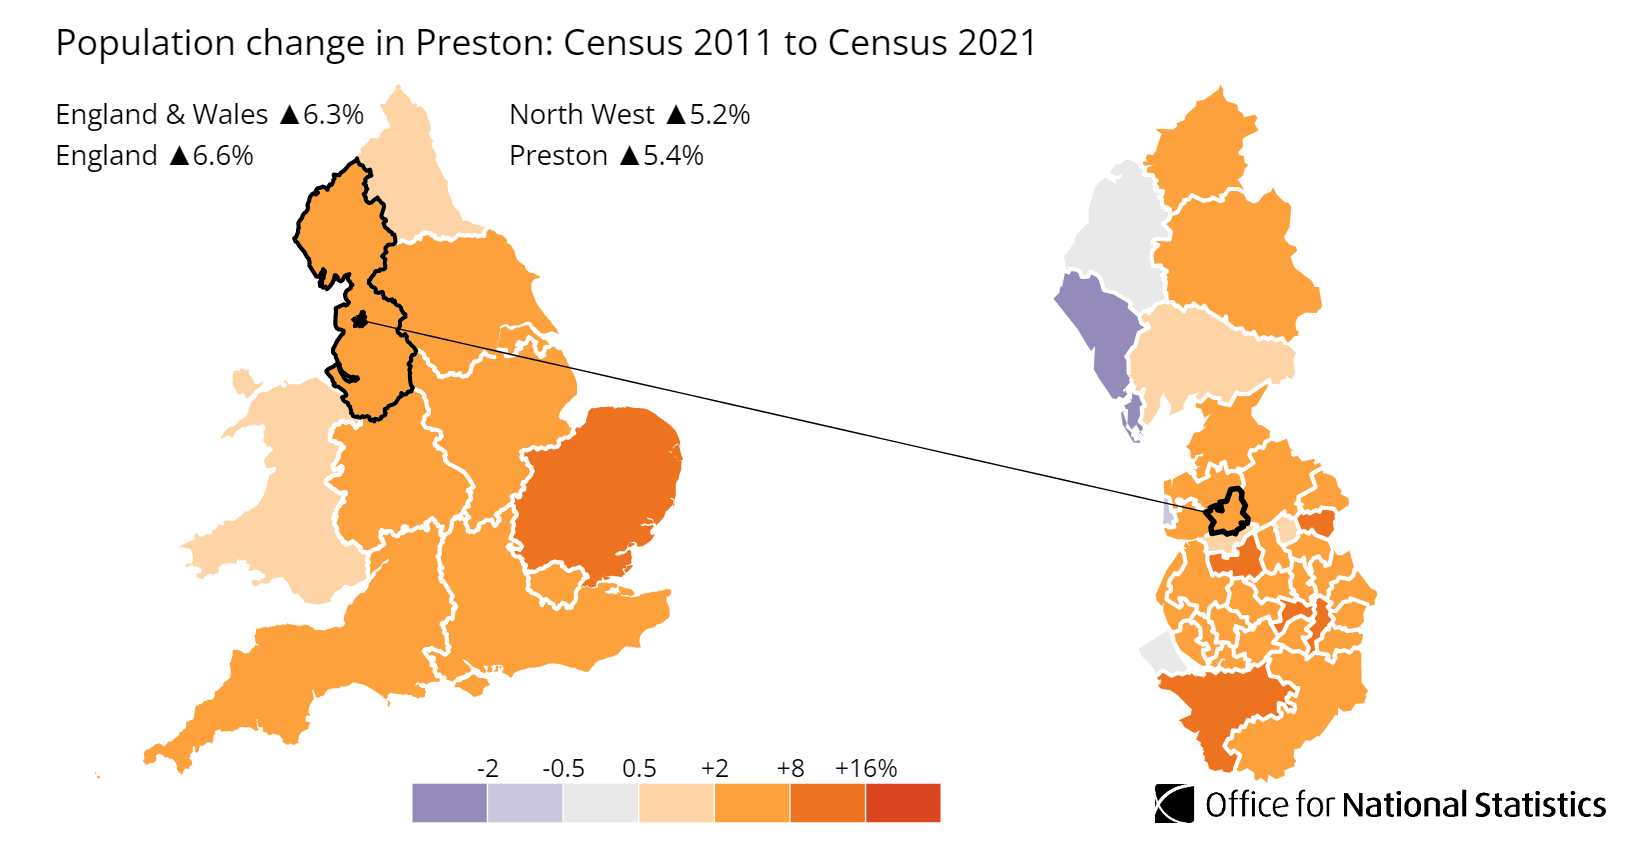
Preston is a city in Lancashire, in North West England. Average sold prices across Preston sit at £188,844 on the HM Land Registry House Price Index, 34.9% below England's £289,946 and 12.0% below the North West regional average of £214,678. That puts Preston among the most affordable cities in the North West, a Lancashire administrative capital priced below Manchester and Chester yet underpinned by public-sector, university and hospital employment that holds tenant demand steady. The local authority's population grew 5.44% between the 2011 and 2021 censuses, from 140,202 to 147,835 residents.
Preston's discount is not simply a wages story. The median gross weekly salary of £715.70 sits only marginally below the North West's £720.10 and £752.40 across Great Britain, so the city is cheaper than its earnings alone would predict. For investors, the spread between PR1 at £172,216 and PR3 at £331,733 creates a two-tier market within one local authority, where the lowest asking price also carries the highest yield rather than the lowest.
This guide covers the Preston local authority district (ONS code E07000123) across postcodes PR1, PR2, PR3, PR4, PR5 and PR11. Preston sits in the North West region on the West Coast Main Line, 30 miles north of Manchester and 30 miles north-east of Liverpool. PR11 is a large-user code covering the Department for Work and Pensions and carries no residential market data, so five postcodes drive the analysis below. The wider best buy-to-let areas guide ranks Preston against locations across the UK.
Article updated: July 2026
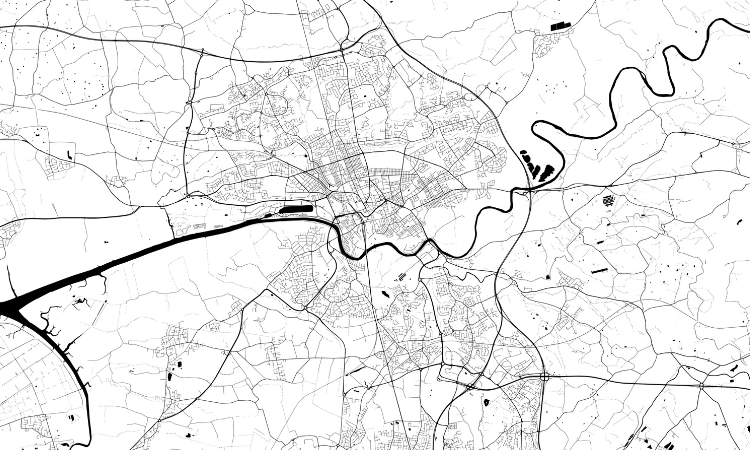
Why Invest in Preston?
Preston's population grew 5.44% between the 2011 and 2021 censuses, from 140,202 to 147,835 residents. That is steady organic growth rather than a boundary change, and it lands close to the England and Wales average of 6.3%. Preston earned full city status in 2002 and is the administrative capital of Lancashire, which puts a layer of government employment at the centre of its economy that smaller Lancashire towns do not have.
The employment base is unusually diversified for a city this size. Lancashire County Council, Preston City Council and a large Department for Work and Pensions hub anchor public-sector work; the University of Central Lancashire (UCLan) is one of the UK's larger universities with a campus at the heart of the city; and the Royal Preston Hospital, run by Lancashire Teaching Hospitals NHS Foundation Trust, is a major acute hospital and employer. BAE Systems runs aerospace and defence sites at nearby Warton and Samlesbury, drawing skilled workers into Preston's postcodes. Government, healthcare, higher education and advanced manufacturing rarely contract at the same time, so the tenant base is less exposed to a single industry than many higher-yielding northern markets.
Median gross annual earnings in Preston are £37,214, which is 0.6% below the North West median of £37,445 and 4.9% below the Great Britain median of £39,125. Wages sit just under the regional benchmark, but property prices sit nearly 12% under it, so the affordability gap is wider than earnings alone explain. That is the spread an income investor is buying into.
Preston Economic Summary
- Population (Preston): 147,835 (2021 Census). Growth of 5.44% from 2011.
- Median annual salary: £37,214 (Preston), £37,445 (North West), £39,125 (Great Britain)
- Employment rate: 75.4% (local), 75.6% (Great Britain)
- Median weekly salary: £715.70 (Preston), £720.10 (North West), £752.40 (Great Britain)
- Key employment sectors: Public administration, health and social work, higher education, aerospace and defence, advanced manufacturing
Source: ONS Census 2021, Nomis Labour Market Profile (ASHE 2025)
Regeneration and Investment in Preston
More than £600 million of regeneration is flowing through Preston's city centre across three overlapping programmes, anchored by the £200 million Harris Quarter. The spending is concentrated in the civic and cultural core, with the first phase already delivering completed buildings rather than masterplans on paper.
- Harris Quarter Regeneration Programme (Under construction, £200 million): A transformation of Preston's civic and cultural heart, kickstarted by £20.9 million of Towns Fund investment. Phase 1 includes the £45 million Animate leisure and entertainment complex, which opened in February 2025, the £19 million restoration of the Harris Museum, which reopened in September 2025, and the conversion of the Red Rose and Elizabethan House buildings into 130 apartments. Updates at Invest Preston City.
- Preston Station Quarter (Masterplanning, part of the £434 million City Deal): A regeneration framework for the area around Preston railway station, divided into four quadrants covering commercial-led mixed use, University Walk, County Hill and Station West. It targets Grade A office space, city-centre homes, new public space and an upgraded station gateway. Updates at Invest Preston City.
- Preston 35 City Investment Plan (Adopted, delivery 2024 to 2035): A ten-year strategy that pulls the Harris Quarter, the Station Quarter, a 60-acre residential quarter, a £24 million sports investment and £14.7 million of Transforming Cities Fund transport upgrades into a single delivery plan. Updates at Invest Preston City.
Source: Office for National Statistics - Population for Preston
Preston Property Market Analysis
Average property prices in Preston have risen 312.6% since January 1995, from £45,764 to £188,844. The sections below trace that journey cycle by cycle, then drill into current postcode-level data for sold prices, price per square foot, asking prices, growth trends and monthly transaction volumes.
When was the last house price crash in Preston?
Preston is its own unitary local authority, so all sold prices from HM Land Registry are recorded at city level. The Land Registry House Price Index tracks average prices from January 1995 to March 2026, covering 31 years of market cycles. Preston's defining feature is its recovery: it took nearly 14 years to climb back to its pre-crash peak, one of the slowest recoveries of any North West city.
The 1995 to 2007 boom: Preston started at £45,764 in January 1995. Growth was slow through the late 1990s, with the average barely above £52,966 by December 2000. The boom then arrived in force: cheap credit and the expansion of buy-to-let lending pushed prices to £128,842 by December 2005 and on to a peak of £154,136 in December 2007. Values more than tripled in the seven years to the peak, with the steepest percentage gains in the cheapest terraced and flat stock.
2008 to 2013, the financial crisis: From the December 2007 peak of £154,136, Preston fell to a trough of £118,002 in March 2013, a decline of 23.4% over more than five years. The worst year-on-year reading was -13.6% in December 2008. That fall was markedly deeper than the England decline of 18.2% (from £183,883 in September 2007 to £150,438 in March 2009) and the North West fall of 18.3% (from £141,847 in December 2007 to £115,931 in January 2013). Preston's lower-value stock and exposure to the slower-recovering parts of Lancashire dragged the correction out longer than the regional average.
The 2009 to 2013 stagnation: Where many cities found a floor in 2009, Preston kept sliding. Prices steadied briefly through 2009 and 2010, reaching £126,028 by December 2010, then drifted lower again to £123,736 by December 2012 before the true trough of £118,002 in March 2013. Preston spent more than five years in negative territory, the heart of its lost decade.
Recovery, 2014 to 2020: Growth returned but at a cautious pace. Prices rebuilt from £127,300 in December 2013 to £132,332 by December 2016, and on to £136,301 by December 2019, still short of the December 2007 peak. Annual growth in this stretch mostly ran between 2% and 5%, supported by the university and public-sector employment while private-sector confidence rebuilt slowly.
2020 to 2022, the pandemic surge: The stamp duty holiday and a shift towards affordable northern housing finally pushed Preston through its old ceiling. From £135,051 in June 2020 the average reached £141,742 by December 2020, then surged to £156,228 by December 2021 (10.2% annual growth) and £168,917 by December 2022 (8.1% annual). The pre-crash peak of £154,136 was not reclaimed until September 2021 at £155,168, nearly 14 years after it was set.
The 2023 rate shock: Higher mortgage rates cooled the market, but Preston did not give back ground. Prices held at £166,037 in June 2023 and rose to £174,403 by December 2023, recording 3.2% annual growth. The correction that hit more leveraged markets largely passed Preston by.
2024 to present: Prices reached £178,851 by December 2024 (2.6% annual growth) and £188,844 by the latest reading in March 2026, the highest figure in the series. The current price is 22.5% above the pre-crash peak of £154,136.
Long-term growth summary:
- 5 years (March 2021 to March 2026): 24.5% growth (£151,624 to £188,844)
- 10 years (March 2016 to March 2026): 41.4% growth (£133,574 to £188,844)
- 15 years (March 2011 to March 2026): 59.3% growth (£118,514 to £188,844)
- 20 years (March 2006 to March 2026): 44.8% growth (£130,433 to £188,844)
- 30 years (January 1995 to March 2026): 312.6% growth (£45,764 to £188,844)
The 20-year figure of 44.8% is lower than the 15-year figure of 59.3%, and that is not a slip. The March 2006 base of £130,433 already carried part of the boom, while the March 2011 base of £118,514 sat closer to the crash floor, so the investor who bought at the 2011 low has more growth to show than one who bought in 2006. Preston's 23.4% crash was deeper than both the regional and national falls, and the recovery the longest of the three. An investor who bought at the exact December 2007 peak would have waited nearly 14 years to break even on the Land Registry average, and would now be sitting on a 22.5% gain.
- All property types
- Detached
- Semi-detached
- Terraced
- Flats
Source: HM Land Registry House Price Index
| Year | All property types | Detached | Semi-detached | Terraced | Flats |
|---|---|---|---|---|---|
| 1995-01 | £45,764 | £84,937 | £47,061 | £33,531 | £31,139 |
| 1995-02 | £45,950 | £84,721 | £47,552 | £33,594 | £31,283 |
| 1995-03 | £46,486 | £85,486 | £48,042 | £34,062 | £31,635 |
| 1995-04 | £47,404 | £86,855 | £49,028 | £34,754 | £32,348 |
| 1995-05 | £46,890 | £85,590 | £48,430 | £34,468 | £32,009 |
| 1995-06 | £46,082 | £84,128 | £47,697 | £33,794 | £31,591 |
| 1995-07 | £45,714 | £83,746 | £47,369 | £33,475 | £31,157 |
| 1995-08 | £45,929 | £84,873 | £47,562 | £33,547 | £31,159 |
| 1995-09 | £45,911 | £84,923 | £47,502 | £33,578 | £30,933 |
| 1995-10 | £45,335 | £83,973 | £47,048 | £33,042 | £30,646 |
| 1995-11 | £45,060 | £83,471 | £46,867 | £32,758 | £30,615 |
| 1995-12 | £45,111 | £83,592 | £47,046 | £32,703 | £30,760 |
| 1996-01 | £44,822 | £83,529 | £46,715 | £32,458 | £30,410 |
| 1996-02 | £44,787 | £83,456 | £46,683 | £32,453 | £30,310 |
| 1996-03 | £45,301 | £84,779 | £47,328 | £32,735 | £30,548 |
| 1996-04 | £45,468 | £84,729 | £47,473 | £32,939 | £30,682 |
| 1996-05 | £46,577 | £86,530 | £48,573 | £33,849 | £31,337 |
| 1996-06 | £45,843 | £84,944 | £47,649 | £33,406 | £31,018 |
| 1996-07 | £46,272 | £85,883 | £48,113 | £33,697 | £31,231 |
| 1996-08 | £45,307 | £84,694 | £47,137 | £32,890 | £30,447 |
| 1996-09 | £45,779 | £86,075 | £47,586 | £33,234 | £30,434 |
| 1996-10 | £45,985 | £86,646 | £47,864 | £33,344 | £30,440 |
| 1996-11 | £46,534 | £87,452 | £48,489 | £33,732 | £30,913 |
| 1996-12 | £46,974 | £87,961 | £49,122 | £34,042 | £31,116 |
| 1997-01 | £46,375 | £86,849 | £48,478 | £33,626 | £30,672 |
| 1997-02 | £46,857 | £88,032 | £48,997 | £33,927 | £30,943 |
| 1997-03 | £46,610 | £87,777 | £48,605 | £33,752 | £30,943 |
| 1997-04 | £46,355 | £86,968 | £48,342 | £33,617 | £30,853 |
| 1997-05 | £45,677 | £85,407 | £47,660 | £33,215 | £30,207 |
| 1997-06 | £45,978 | £85,942 | £48,051 | £33,460 | £30,116 |
| 1997-07 | £47,876 | £89,670 | £50,034 | £34,867 | £31,070 |
| 1997-08 | £48,501 | £91,197 | £50,696 | £35,265 | £31,370 |
| 1997-09 | £48,098 | £90,658 | £50,299 | £34,930 | £31,018 |
| 1997-10 | £47,687 | £90,095 | £49,974 | £34,522 | £30,763 |
| 1997-11 | £47,678 | £90,097 | £50,009 | £34,484 | £30,768 |
| 1997-12 | £48,745 | £92,107 | £51,245 | £35,183 | £31,483 |
| 1998-01 | £48,317 | £91,711 | £50,685 | £34,844 | £31,243 |
| 1998-02 | £48,341 | £91,837 | £50,717 | £34,801 | £31,464 |
| 1998-03 | £47,721 | £90,768 | £50,027 | £34,355 | £31,064 |
| 1998-04 | £48,447 | £91,797 | £50,905 | £34,890 | £31,498 |
| 1998-05 | £48,273 | £91,155 | £50,692 | £34,873 | £31,238 |
| 1998-06 | £48,314 | £91,171 | £50,720 | £34,896 | £31,409 |
| 1998-07 | £48,176 | £91,060 | £50,541 | £34,792 | £31,281 |
| 1998-08 | £49,595 | £94,285 | £51,989 | £35,749 | £32,102 |
| 1998-09 | £49,778 | £94,883 | £52,140 | £35,884 | £32,061 |
| 1998-10 | £49,468 | £94,472 | £51,832 | £35,593 | £31,982 |
| 1998-11 | £48,471 | £92,707 | £50,903 | £34,750 | £31,509 |
| 1998-12 | £48,555 | £92,685 | £51,100 | £34,739 | £31,815 |
| 1999-01 | £47,717 | £91,188 | £50,250 | £34,095 | £31,301 |
| 1999-02 | £47,309 | £90,375 | £49,831 | £33,800 | £31,046 |
| 1999-03 | £47,286 | £90,636 | £49,757 | £33,744 | £31,036 |
| 1999-04 | £48,679 | £92,833 | £51,185 | £34,843 | £31,956 |
| 1999-05 | £49,959 | £95,004 | £52,483 | £35,841 | £32,761 |
| 1999-06 | £50,178 | £95,325 | £52,676 | £36,050 | £32,826 |
| 1999-07 | £51,187 | £97,752 | £53,669 | £36,732 | £33,410 |
| 1999-08 | £50,624 | £97,005 | £52,997 | £36,325 | £32,981 |
| 1999-09 | £51,536 | £99,101 | £53,863 | £36,964 | £33,576 |
| 1999-10 | £50,782 | £97,788 | £53,201 | £36,295 | £33,271 |
| 1999-11 | £51,161 | £98,433 | £53,650 | £36,531 | £33,637 |
| 1999-12 | £51,638 | £98,929 | £54,224 | £36,870 | £34,147 |
| 2000-01 | £51,852 | £99,518 | £54,434 | £37,029 | £34,137 |
| 2000-02 | £51,257 | £98,529 | £53,831 | £36,551 | £33,743 |
| 2000-03 | £50,524 | £97,322 | £53,165 | £35,957 | £33,044 |
| 2000-04 | £50,924 | £97,624 | £53,553 | £36,278 | £33,543 |
| 2000-05 | £52,349 | £100,317 | £55,120 | £37,255 | £34,553 |
| 2000-06 | £53,351 | £102,182 | £56,230 | £37,922 | £35,397 |
| 2000-07 | £53,044 | £102,353 | £56,036 | £37,582 | £34,985 |
| 2000-08 | £52,567 | £102,118 | £55,670 | £37,080 | £34,757 |
| 2000-09 | £52,663 | £103,193 | £55,713 | £37,063 | £34,803 |
| 2000-10 | £52,690 | £103,410 | £55,900 | £36,969 | £34,958 |
| 2000-11 | £52,965 | £103,994 | £56,174 | £37,155 | £35,195 |
| 2000-12 | £52,966 | £103,533 | £56,337 | £37,095 | £35,493 |
| 2001-01 | £54,704 | £106,727 | £58,066 | £38,377 | £36,742 |
| 2001-02 | £54,870 | £106,793 | £58,240 | £38,541 | £36,787 |
| 2001-03 | £54,907 | £106,919 | £58,277 | £38,602 | £36,582 |
| 2001-04 | £54,270 | £105,513 | £57,529 | £38,211 | £36,183 |
| 2001-05 | £55,519 | £107,513 | £58,849 | £39,153 | £37,047 |
| 2001-06 | £56,593 | £109,284 | £59,907 | £39,948 | £38,011 |
| 2001-07 | £57,218 | £110,659 | £60,650 | £40,343 | £38,334 |
| 2001-08 | £58,283 | £113,315 | £61,676 | £41,037 | £39,115 |
| 2001-09 | £59,344 | £116,049 | £62,680 | £41,759 | £39,726 |
| 2001-10 | £59,558 | £116,286 | £62,913 | £41,882 | £40,116 |
| 2001-11 | £59,762 | £116,479 | £63,279 | £41,945 | £40,434 |
| 2001-12 | £59,394 | £115,201 | £63,122 | £41,564 | £40,644 |
| 2002-01 | £59,368 | £115,313 | £63,138 | £41,486 | £40,691 |
| 2002-02 | £58,610 | £113,806 | £62,218 | £40,988 | £40,316 |
| 2002-03 | £59,276 | £114,957 | £62,891 | £41,528 | £40,600 |
| 2002-04 | £61,240 | £118,117 | £64,899 | £42,981 | £42,247 |
| 2002-05 | £63,816 | £122,492 | £67,761 | £44,807 | £44,075 |
| 2002-06 | £64,046 | £122,842 | £67,865 | £45,018 | £44,405 |
| 2002-07 | £66,504 | £127,810 | £70,441 | £46,776 | £45,835 |
| 2002-08 | £67,177 | £129,294 | £71,108 | £47,257 | £46,225 |
| 2002-09 | £68,838 | £132,721 | £73,080 | £48,341 | £47,081 |
| 2002-10 | £68,674 | £132,271 | £73,121 | £48,114 | £47,095 |
| 2002-11 | £68,390 | £131,786 | £72,824 | £47,888 | £46,971 |
| 2002-12 | £71,166 | £136,545 | £75,831 | £49,826 | £49,242 |
| 2003-01 | £72,501 | £138,845 | £77,048 | £50,891 | £50,230 |
| 2003-02 | £75,884 | £144,452 | £80,769 | £53,322 | £52,674 |
| 2003-03 | £75,517 | £143,728 | £80,271 | £53,149 | £52,282 |
| 2003-04 | £74,600 | £141,381 | £79,499 | £52,467 | £51,801 |
| 2003-05 | £76,604 | £145,196 | £81,675 | £53,875 | £53,086 |
| 2003-06 | £78,401 | £147,856 | £83,607 | £55,189 | £54,650 |
| 2003-07 | £83,134 | £156,337 | £88,620 | £58,660 | £57,696 |
| 2003-08 | £86,031 | £161,228 | £91,562 | £60,881 | £59,645 |
| 2003-09 | £86,447 | £161,989 | £91,946 | £61,304 | £59,461 |
| 2003-10 | £88,027 | £164,570 | £93,520 | £62,536 | £60,571 |
| 2003-11 | £89,016 | £166,004 | £94,577 | £63,313 | £61,211 |
| 2003-12 | £93,646 | £172,962 | £99,377 | £66,879 | £64,729 |
| 2004-01 | £94,032 | £173,327 | £99,543 | £67,328 | £65,040 |
| 2004-02 | £93,548 | £171,452 | £98,704 | £67,202 | £64,952 |
| 2004-03 | £92,909 | £170,253 | £97,725 | £66,833 | £64,399 |
| 2004-04 | £97,310 | £176,164 | £102,204 | £70,354 | £67,315 |
| 2004-05 | £103,043 | £184,475 | £107,913 | £74,903 | £71,173 |
| 2004-06 | £108,661 | £192,925 | £113,667 | £79,186 | £75,220 |
| 2004-07 | £110,055 | £194,889 | £115,113 | £80,329 | £75,985 |
| 2004-08 | £111,075 | £196,872 | £116,196 | £81,105 | £76,479 |
| 2004-09 | £113,184 | £201,069 | £118,337 | £82,736 | £77,510 |
| 2004-10 | £115,863 | £205,717 | £120,913 | £84,666 | £79,800 |
| 2004-11 | £116,828 | £207,162 | £121,707 | £85,424 | £80,693 |
| 2004-12 | £117,428 | £206,836 | £122,015 | £86,037 | £81,544 |
| 2005-01 | £115,370 | £203,004 | £119,601 | £84,651 | £80,174 |
| 2005-02 | £120,386 | £211,380 | £124,919 | £88,286 | £83,764 |
| 2005-03 | £121,434 | £213,458 | £126,120 | £89,060 | £84,241 |
| 2005-04 | £126,163 | £220,528 | £131,114 | £92,731 | £87,334 |
| 2005-05 | £123,454 | £215,392 | £127,987 | £91,032 | £85,253 |
| 2005-06 | £125,129 | £216,623 | £129,468 | £92,665 | £86,269 |
| 2005-07 | £123,511 | £214,044 | £127,803 | £91,598 | £84,814 |
| 2005-08 | £125,467 | £217,319 | £129,659 | £93,283 | £85,860 |
| 2005-09 | £126,716 | £220,289 | £130,868 | £94,296 | £86,407 |
| 2005-10 | £127,819 | £221,800 | £131,611 | £95,230 | £87,415 |
| 2005-11 | £129,046 | £223,439 | £132,860 | £96,191 | £88,302 |
| 2005-12 | £128,842 | £221,667 | £132,256 | £96,117 | £88,772 |
| 2006-01 | £130,228 | £224,032 | £133,543 | £97,316 | £89,521 |
| 2006-02 | £130,266 | £223,390 | £133,309 | £97,506 | £89,799 |
| 2006-03 | £130,433 | £224,569 | £133,726 | £97,689 | £89,299 |
| 2006-04 | £132,154 | £226,321 | £135,472 | £99,165 | £90,437 |
| 2006-05 | £132,272 | £226,506 | £135,727 | £99,259 | £90,288 |
| 2006-06 | £133,656 | £227,716 | £137,041 | £100,486 | £91,306 |
| 2006-07 | £136,530 | £232,882 | £139,796 | £102,806 | £92,965 |
| 2006-08 | £137,847 | £235,324 | £141,020 | £103,982 | £93,394 |
| 2006-09 | £140,097 | £240,208 | £143,312 | £105,615 | £94,691 |
| 2006-10 | £139,603 | £239,689 | £142,900 | £105,127 | £94,428 |
| 2006-11 | £139,611 | £239,497 | £142,933 | £105,180 | £94,334 |
| 2006-12 | £139,738 | £238,288 | £142,853 | £105,536 | £94,556 |
| 2007-01 | £138,958 | £236,889 | £141,938 | £105,085 | £93,810 |
| 2007-02 | £142,164 | £242,138 | £145,055 | £107,395 | £96,464 |
| 2007-03 | £143,237 | £244,489 | £146,138 | £108,235 | £96,830 |
| 2007-04 | £145,374 | £247,217 | £148,231 | £110,026 | £98,233 |
| 2007-05 | £145,755 | £246,865 | £148,446 | £110,614 | £98,287 |
| 2007-06 | £147,875 | £250,081 | £150,384 | £112,347 | £99,781 |
| 2007-07 | £149,384 | £253,473 | £151,807 | £113,464 | £100,744 |
| 2007-08 | £151,143 | £257,788 | £153,661 | £114,903 | £101,266 |
| 2007-09 | £149,192 | £255,750 | £151,811 | £113,363 | £99,585 |
| 2007-10 | £150,023 | £257,635 | £152,619 | £113,915 | £100,226 |
| 2007-11 | £150,151 | £258,453 | £152,908 | £113,831 | £100,378 |
| 2007-12 | £154,136 | £264,540 | £156,787 | £116,838 | £103,470 |
| 2008-01 | £150,917 | £259,210 | £153,361 | £114,391 | £101,426 |
| 2008-02 | £148,297 | £254,424 | £150,459 | £112,419 | £99,942 |
| 2008-03 | £140,867 | £242,491 | £143,224 | £106,752 | £94,415 |
| 2008-04 | £142,625 | £245,839 | £145,062 | £108,227 | £95,121 |
| 2008-05 | £143,058 | £246,105 | £145,651 | £108,565 | £95,341 |
| 2008-06 | £142,946 | £245,578 | £145,478 | £108,472 | £95,430 |
| 2008-07 | £140,664 | £241,634 | £143,624 | £106,468 | £94,036 |
| 2008-08 | £138,767 | £239,336 | £141,740 | £104,986 | £92,580 |
| 2008-09 | £138,232 | £240,748 | £141,120 | £104,370 | £92,239 |
| 2008-10 | £135,678 | £237,099 | £138,405 | £102,394 | £90,571 |
| 2008-11 | £133,399 | £233,505 | £136,313 | £100,564 | £88,958 |
| 2008-12 | £133,224 | £231,795 | £136,305 | £100,622 | £88,540 |
| 2009-01 | £131,904 | £230,430 | £134,930 | £99,566 | £87,609 |
| 2009-02 | £130,473 | £228,561 | £133,424 | £98,347 | £86,965 |
| 2009-03 | £128,627 | £226,203 | £131,615 | £96,663 | £86,356 |
| 2009-04 | £126,830 | £221,597 | £130,051 | £95,356 | £85,353 |
| 2009-05 | £125,180 | £218,046 | £128,455 | £94,249 | £84,093 |
| 2009-06 | £125,638 | £218,579 | £129,027 | £94,753 | £83,930 |
| 2009-07 | £127,019 | £221,658 | £130,502 | £95,872 | £84,141 |
| 2009-08 | £128,692 | £225,203 | £132,307 | £97,163 | £84,646 |
| 2009-09 | £127,885 | £224,336 | £131,649 | £96,501 | £83,610 |
| 2009-10 | £129,309 | £227,273 | £133,321 | £97,518 | £84,048 |
| 2009-11 | £130,433 | £229,596 | £134,372 | £98,537 | £84,340 |
| 2009-12 | £133,361 | £233,259 | £137,347 | £101,220 | £85,958 |
| 2010-01 | £132,789 | £233,339 | £137,104 | £100,589 | £84,860 |
| 2010-02 | £129,354 | £227,212 | £134,203 | £97,677 | £82,247 |
| 2010-03 | £126,723 | £224,693 | £131,912 | £94,935 | £80,462 |
| 2010-04 | £127,991 | £225,786 | £133,293 | £95,915 | £81,648 |
| 2010-05 | £130,622 | £230,433 | £135,982 | £97,843 | £83,533 |
| 2010-06 | £135,154 | £237,742 | £140,726 | £101,531 | £85,944 |
| 2010-07 | £134,849 | £238,146 | £140,366 | £101,305 | £85,359 |
| 2010-08 | £134,043 | £237,742 | £139,776 | £100,541 | £84,319 |
| 2010-09 | £129,659 | £231,426 | £135,241 | £97,033 | £81,353 |
| 2010-10 | £126,966 | £226,966 | £132,540 | £94,855 | £79,730 |
| 2010-11 | £126,712 | £226,907 | £132,142 | £94,597 | £79,789 |
| 2010-12 | £126,028 | £225,360 | £131,615 | £93,962 | £79,515 |
| 2011-01 | £122,019 | £218,924 | £127,462 | £90,797 | £77,035 |
| 2011-02 | £119,393 | £214,672 | £124,585 | £88,827 | £75,409 |
| 2011-03 | £118,514 | £214,408 | £123,531 | £88,032 | £74,786 |
| 2011-04 | £125,502 | £226,501 | £130,695 | £93,397 | £79,145 |
| 2011-05 | £125,441 | £225,749 | £130,782 | £93,314 | £79,367 |
| 2011-06 | £126,595 | £226,253 | £132,222 | £94,285 | £80,251 |
| 2011-07 | £124,270 | £221,779 | £129,846 | £92,497 | £79,086 |
| 2011-08 | £126,864 | £226,895 | £132,756 | £94,424 | £80,061 |
| 2011-09 | £128,467 | £230,533 | £134,319 | £95,672 | £80,594 |
| 2011-10 | £126,309 | £227,497 | £132,336 | £93,914 | £78,735 |
| 2011-11 | £126,108 | £227,205 | £132,186 | £93,591 | £79,076 |
| 2011-12 | £124,175 | £223,106 | £130,349 | £92,096 | £78,119 |
| 2012-01 | £125,602 | £224,876 | £131,897 | £93,249 | £79,087 |
| 2012-02 | £124,348 | £222,014 | £130,445 | £92,624 | £77,960 |
| 2012-03 | £124,978 | £222,085 | £130,981 | £93,442 | £78,485 |
| 2012-04 | £125,296 | £222,687 | £131,292 | £93,610 | £78,917 |
| 2012-05 | £125,789 | £223,306 | £131,843 | £93,972 | £79,368 |
| 2012-06 | £126,393 | £224,519 | £132,485 | £94,463 | £79,504 |
| 2012-07 | £128,466 | £227,928 | £134,542 | £96,219 | £80,613 |
| 2012-08 | £130,667 | £231,658 | £136,843 | £98,063 | £81,548 |
| 2012-09 | £129,875 | £231,318 | £135,955 | £97,294 | £80,897 |
| 2012-10 | £126,627 | £225,352 | £132,714 | £94,823 | £78,804 |
| 2012-11 | £123,401 | £219,896 | £129,336 | £92,311 | £76,864 |
| 2012-12 | £123,736 | £220,400 | £129,817 | £92,530 | £76,981 |
| 2013-01 | £122,223 | £218,133 | £128,470 | £91,234 | £75,742 |
| 2013-02 | £121,541 | £217,163 | £127,792 | £90,669 | £75,267 |
| 2013-03 | £118,002 | £211,535 | £124,114 | £87,814 | £73,163 |
| 2013-04 | £120,442 | £215,732 | £126,465 | £89,780 | £74,800 |
| 2013-05 | £121,769 | £217,802 | £127,923 | £90,730 | £75,844 |
| 2013-06 | £124,457 | £221,605 | £130,759 | £93,004 | £77,416 |
| 2013-07 | £125,757 | £223,665 | £132,019 | £94,107 | £78,237 |
| 2013-08 | £126,868 | £225,629 | £133,188 | £95,020 | £78,682 |
| 2013-09 | £128,007 | £228,727 | £134,405 | £95,630 | £79,277 |
| 2013-10 | £128,289 | £230,396 | £134,905 | £95,481 | £79,254 |
| 2013-11 | £126,782 | £227,960 | £133,509 | £94,178 | £78,273 |
| 2013-12 | £127,300 | £227,759 | £134,229 | £94,659 | £78,783 |
| 2014-01 | £126,539 | £225,605 | £133,222 | £94,345 | £78,565 |
| 2014-02 | £126,841 | £226,128 | £133,336 | £94,745 | £78,684 |
| 2014-03 | £123,575 | £220,322 | £129,867 | £92,312 | £76,609 |
| 2014-04 | £121,381 | £215,911 | £127,539 | £90,848 | £75,098 |
| 2014-05 | £123,696 | £219,254 | £130,007 | £92,652 | £76,697 |
| 2014-06 | £126,205 | £223,400 | £132,586 | £94,712 | £78,049 |
| 2014-07 | £129,269 | £228,708 | £135,791 | £97,087 | £79,835 |
| 2014-08 | £128,514 | £227,835 | £134,993 | £96,563 | £79,017 |
| 2014-09 | £127,576 | £226,576 | £133,892 | £95,825 | £78,502 |
| 2014-10 | £127,651 | £227,059 | £134,073 | £95,723 | £78,603 |
| 2014-11 | £127,204 | £226,524 | £133,714 | £95,211 | £78,461 |
| 2014-12 | £129,306 | £230,611 | £135,973 | £96,646 | £79,850 |
| 2015-01 | £128,140 | £228,604 | £134,816 | £95,703 | £79,159 |
| 2015-02 | £129,771 | £231,593 | £136,317 | £96,935 | £80,478 |
| 2015-03 | £127,242 | £227,663 | £133,887 | £94,795 | £78,889 |
| 2015-04 | £128,933 | £230,942 | £135,641 | £96,057 | £79,835 |
| 2015-05 | £128,949 | £230,733 | £135,900 | £96,005 | £79,711 |
| 2015-06 | £129,088 | £230,176 | £135,975 | £96,433 | £79,444 |
| 2015-07 | £129,940 | £231,361 | £136,975 | £97,062 | £79,987 |
| 2015-08 | £130,595 | £232,678 | £137,641 | £97,634 | £80,104 |
| 2015-09 | £134,996 | £241,721 | £142,256 | £100,686 | £82,850 |
| 2015-10 | £133,251 | £239,248 | £140,495 | £99,285 | £81,546 |
| 2015-11 | £131,072 | £235,741 | £138,354 | £97,499 | £80,157 |
| 2015-12 | £129,537 | £232,905 | £136,802 | £96,385 | £79,050 |
| 2016-01 | £131,626 | £236,345 | £139,095 | £97,932 | £80,365 |
| 2016-02 | £133,640 | £239,826 | £141,093 | £99,528 | £81,633 |
| 2016-03 | £133,574 | £239,581 | £140,915 | £99,426 | £82,031 |
| 2016-04 | £132,885 | £238,113 | £140,135 | £99,057 | £81,418 |
| 2016-05 | £133,024 | £237,565 | £140,162 | £99,320 | £81,729 |
| 2016-06 | £133,729 | £238,509 | £140,945 | £99,965 | £81,917 |
| 2016-07 | £134,021 | £238,971 | £141,088 | £100,251 | £82,247 |
| 2016-08 | £134,665 | £240,849 | £141,857 | £100,545 | £82,593 |
| 2016-09 | £133,562 | £239,142 | £140,854 | £99,600 | £81,819 |
| 2016-10 | £132,460 | £238,203 | £139,943 | £98,344 | £81,351 |
| 2016-11 | £131,569 | £237,714 | £139,173 | £97,364 | £80,774 |
| 2016-12 | £132,332 | £239,498 | £139,835 | £97,840 | £81,548 |
| 2017-01 | £131,906 | £238,930 | £139,315 | £97,546 | £81,238 |
| 2017-02 | £133,641 | £241,292 | £140,850 | £98,991 | £82,833 |
| 2017-03 | £131,520 | £237,515 | £138,719 | £97,274 | £81,708 |
| 2017-04 | £132,400 | £238,746 | £139,492 | £97,971 | £82,610 |
| 2017-05 | £130,275 | £234,299 | £137,488 | £96,352 | £81,352 |
| 2017-06 | £131,926 | £236,381 | £139,207 | £97,706 | £82,565 |
| 2017-07 | £132,365 | £236,413 | £139,703 | £98,136 | £82,930 |
| 2017-08 | £134,236 | £239,950 | £141,602 | £99,638 | £83,803 |
| 2017-09 | £136,691 | £245,048 | £144,138 | £101,435 | £85,087 |
| 2017-10 | £138,685 | £249,394 | £146,466 | £102,724 | £86,009 |
| 2017-11 | £137,637 | £247,854 | £145,555 | £101,794 | £85,241 |
| 2017-12 | £138,331 | £248,526 | £146,467 | £102,355 | £85,553 |
| 2018-01 | £137,677 | £247,505 | £145,834 | £101,785 | £85,195 |
| 2018-02 | £137,266 | £247,736 | £145,152 | £101,464 | £84,763 |
| 2018-03 | £134,660 | £243,373 | £142,356 | £99,579 | £83,011 |
| 2018-04 | £133,462 | £240,832 | £141,053 | £98,992 | £81,772 |
| 2018-05 | £134,046 | £240,746 | £141,960 | £99,665 | £81,849 |
| 2018-06 | £135,303 | £242,742 | £143,553 | £100,536 | £82,541 |
| 2018-07 | £135,059 | £242,588 | £143,300 | £100,263 | £82,412 |
| 2018-08 | £136,407 | £245,446 | £144,723 | £101,157 | £83,184 |
| 2018-09 | £134,834 | £242,957 | £142,952 | £100,038 | £81,981 |
| 2018-10 | £138,240 | £249,303 | £146,545 | £102,517 | £84,053 |
| 2018-11 | £135,204 | £243,973 | £143,472 | £100,195 | £82,020 |
| 2018-12 | £136,840 | £246,768 | £145,262 | £101,367 | £83,165 |
| 2019-01 | £133,061 | £240,602 | £141,452 | £98,331 | £80,648 |
| 2019-02 | £134,892 | £244,715 | £143,180 | £99,620 | £81,779 |
| 2019-03 | £134,320 | £244,459 | £142,742 | £99,028 | £80,938 |
| 2019-04 | £135,821 | £246,390 | £144,296 | £100,419 | £81,773 |
| 2019-05 | £134,532 | £243,186 | £143,147 | £99,622 | £80,777 |
| 2019-06 | £132,993 | £239,495 | £141,498 | £98,694 | £80,089 |
| 2019-07 | £136,638 | £246,276 | £145,140 | £101,500 | £82,315 |
| 2019-08 | £139,867 | £251,971 | £148,462 | £104,056 | £84,119 |
| 2019-09 | £141,367 | £255,072 | £149,776 | £105,291 | £84,919 |
| 2019-10 | £136,708 | £246,290 | £145,304 | £101,640 | £81,940 |
| 2019-11 | £135,883 | £244,705 | £144,744 | £100,813 | £81,466 |
| 2019-12 | £136,301 | £244,889 | £145,430 | £101,159 | £81,564 |
| 2020-01 | £137,512 | £247,887 | £146,650 | £101,978 | £81,909 |
| 2020-02 | £136,515 | £246,358 | £145,463 | £101,472 | £80,782 |
| 2020-03 | £135,355 | £245,282 | £144,221 | £100,445 | £79,681 |
| 2020-04 | £132,306 | £240,268 | £140,765 | £98,351 | £77,423 |
| 2020-05 | £132,113 | £240,738 | £140,636 | £97,785 | £77,507 |
| 2020-06 | £135,051 | £245,211 | £144,045 | £100,193 | £78,922 |
| 2020-07 | £138,074 | £249,634 | £147,442 | £102,544 | £81,011 |
| 2020-08 | £141,287 | £255,561 | £151,095 | £105,031 | £82,172 |
| 2020-09 | £139,344 | £253,245 | £148,905 | £103,404 | £80,681 |
| 2020-10 | £140,003 | £254,821 | £149,694 | £103,938 | £80,500 |
| 2020-11 | £139,167 | £252,659 | £148,627 | £103,658 | £80,029 |
| 2020-12 | £141,742 | £256,758 | £151,262 | £105,885 | £81,452 |
| 2021-01 | £145,315 | £260,907 | £155,128 | £108,973 | £84,362 |
| 2021-02 | £148,931 | £265,018 | £158,720 | £112,288 | £87,504 |
| 2021-03 | £151,624 | £267,607 | £161,411 | £114,771 | £90,212 |
| 2021-04 | £150,317 | £265,463 | £159,487 | £114,062 | £89,571 |
| 2021-05 | £148,243 | £262,344 | £157,230 | £112,431 | £88,081 |
| 2021-06 | £150,305 | £264,637 | £159,168 | £114,633 | £89,315 |
| 2021-07 | £151,485 | £267,005 | £160,665 | £115,344 | £89,762 |
| 2021-08 | £153,871 | £271,346 | £163,486 | £117,102 | £90,596 |
| 2021-09 | £155,168 | £274,269 | £165,050 | £117,881 | £90,914 |
| 2021-10 | £155,968 | £276,918 | £166,063 | £118,173 | £90,771 |
| 2021-11 | £157,691 | £280,743 | £167,988 | £119,236 | £91,559 |
| 2021-12 | £156,228 | £279,393 | £166,627 | £117,777 | £90,071 |
| 2022-01 | £157,838 | £280,994 | £168,491 | £119,374 | £90,792 |
| 2022-02 | £157,477 | £279,532 | £167,937 | £119,388 | £90,926 |
| 2022-03 | £159,646 | £283,967 | £170,477 | £120,728 | £92,053 |
| 2022-04 | £160,250 | £284,845 | £170,921 | £121,357 | £92,494 |
| 2022-05 | £160,227 | £284,513 | £171,087 | £121,439 | £92,007 |
| 2022-06 | £161,852 | £286,456 | £172,773 | £122,996 | £92,965 |
| 2022-07 | £164,592 | £290,623 | £175,901 | £125,282 | £94,105 |
| 2022-08 | £168,929 | £298,184 | £180,512 | £128,773 | £96,117 |
| 2022-09 | £170,052 | £300,173 | £181,719 | £129,796 | £96,169 |
| 2022-10 | £171,462 | £303,276 | £183,126 | £130,761 | £96,918 |
| 2022-11 | £170,278 | £301,698 | £181,752 | £129,766 | £96,267 |
| 2022-12 | £168,917 | £299,063 | £180,276 | £128,709 | £95,855 |
| 2023-01 | £168,391 | £298,708 | £179,882 | £128,058 | £95,395 |
| 2023-02 | £167,952 | £298,889 | £179,340 | £127,407 | £95,282 |
| 2023-03 | £167,644 | £300,466 | £179,175 | £126,446 | £94,894 |
| 2023-04 | £163,983 | £294,852 | £175,305 | £123,349 | £92,917 |
| 2023-05 | £162,491 | £291,807 | £173,947 | £122,101 | £92,265 |
| 2023-06 | £166,037 | £296,565 | £177,670 | £125,339 | £94,117 |
| 2023-07 | £168,644 | £300,321 | £180,573 | £127,556 | £95,434 |
| 2023-08 | £172,432 | £306,621 | £184,573 | £130,833 | £96,965 |
| 2023-09 | £171,304 | £304,711 | £183,313 | £130,078 | £96,099 |
| 2023-10 | £174,448 | £309,827 | £186,376 | £132,655 | £98,210 |
| 2023-11 | £175,046 | £311,824 | £187,181 | £132,643 | £98,774 |
| 2023-12 | £174,403 | £310,538 | £186,567 | £132,019 | £98,725 |
| 2024-01 | £173,448 | £309,527 | £185,594 | £131,188 | £97,890 |
| 2024-02 | £172,611 | £306,930 | £184,540 | £130,944 | £97,440 |
| 2024-03 | £172,464 | £307,267 | £184,247 | £130,611 | £97,624 |
| 2024-04 | £172,126 | £305,347 | £183,809 | £130,570 | £97,855 |
| 2024-05 | £169,421 | £299,857 | £180,899 | £128,551 | £96,698 |
| 2024-06 | £171,877 | £302,482 | £183,406 | £130,990 | £98,002 |
| 2024-07 | £173,606 | £305,258 | £185,218 | £132,599 | £98,526 |
| 2024-08 | £178,497 | £313,813 | £190,289 | £136,654 | £100,805 |
| 2024-09 | £180,203 | £318,074 | £192,242 | £137,820 | £101,124 |
| 2024-10 | £180,678 | £319,720 | £192,586 | £137,992 | £101,558 |
| 2024-11 | £181,667 | £321,832 | £193,956 | £138,572 | £101,849 |
| 2024-12 | £178,851 | £317,473 | £190,908 | £136,372 | £100,067 |
| 2025-01 | £179,566 | £319,469 | £191,998 | £136,851 | £99,724 |
| 2025-02 | £179,228 | £319,305 | £191,455 | £136,700 | £99,478 |
| 2025-03 | £180,166 | £318,375 | £192,245 | £138,144 | £101,029 |
| 2025-04 | £172,016 | £305,070 | £183,683 | £131,458 | £96,260 |
| 2025-05 | £168,342 | £299,688 | £179,936 | £128,292 | £93,766 |
| 2025-06 | £167,215 | £299,603 | £179,398 | £126,942 | £91,659 |
| 2025-07 | £175,646 | £312,511 | £188,504 | £134,306 | £96,124 |
| 2025-08 | £182,944 | £324,835 | £196,458 | £140,282 | £99,750 |
| 2025-09 | £186,581 | £332,025 | £200,336 | £143,069 | £101,214 |
| 2025-10 | £188,540 | £336,675 | £202,320 | £144,194 | £102,220 |
| 2025-11 | £188,428 | £337,046 | £202,023 | £144,029 | £102,090 |
| 2025-12 | £187,397 | £334,115 | £200,854 | £143,628 | £101,747 |
| 2026-01 | £186,768 | £331,466 | £200,601 | £143,806 | £100,865 |
| 2026-02 | £188,449 | £334,333 | £202,574 | £145,390 | £101,227 |
| 2026-03 | £188,844 | £336,222 | £203,257 | £145,518 | £100,436 |
- All property types
- Detached
- Semi-detached
- Terraced
- Flats
Source: HM Land Registry House Price Index
| Year | All property types | Detached | Semi-detached | Terraced | Flats |
|---|---|---|---|---|---|
| 1996-01 | -2.1% | -1.7% | -0.7% | -3.2% | -2.3% |
| 1996-02 | -2.5% | -1.5% | -1.8% | -3.4% | -3.1% |
| 1996-03 | -2.6% | -0.8% | -1.5% | -3.9% | -3.4% |
| 1996-04 | -4.1% | -2.4% | -3.2% | -5.2% | -5.2% |
| 1996-05 | -0.7% | +1.1% | +0.3% | -1.8% | -2.1% |
| 1996-06 | -0.5% | +1.0% | -0.1% | -1.1% | -1.8% |
| 1996-07 | +1.2% | +2.6% | +1.6% | +0.7% | +0.2% |
| 1996-08 | -1.4% | -0.2% | -0.9% | -2.0% | -2.3% |
| 1996-09 | -0.3% | +1.4% | +0.2% | -1.0% | -1.6% |
| 1996-10 | +1.4% | +3.2% | +1.7% | +0.9% | -0.7% |
| 1996-11 | +3.3% | +4.8% | +3.5% | +3.0% | +1.0% |
| 1996-12 | +4.1% | +5.2% | +4.4% | +4.1% | +1.2% |
| 1997-01 | +3.5% | +4.0% | +3.8% | +3.6% | +0.9% |
| 1997-02 | +4.6% | +5.5% | +5.0% | +4.5% | +2.1% |
| 1997-03 | +2.9% | +3.5% | +2.7% | +3.1% | +1.3% |
| 1997-04 | +2.0% | +2.6% | +1.8% | +2.1% | +0.6% |
| 1997-05 | -1.9% | -1.3% | -1.9% | -1.9% | -3.6% |
| 1997-06 | +0.3% | +1.2% | +0.8% | +0.2% | -2.9% |
| 1997-07 | +3.5% | +4.4% | +4.0% | +3.5% | -0.5% |
| 1997-08 | +7.1% | +7.7% | +7.5% | +7.2% | +3.0% |
| 1997-09 | +5.1% | +5.3% | +5.7% | +5.1% | +1.9% |
| 1997-10 | +3.7% | +4.0% | +4.4% | +3.5% | +1.1% |
| 1997-11 | +2.5% | +3.0% | +3.1% | +2.2% | -0.5% |
| 1997-12 | +3.8% | +4.7% | +4.3% | +3.3% | +1.2% |
| 1998-01 | +4.2% | +5.6% | +4.6% | +3.6% | +1.9% |
| 1998-02 | +3.2% | +4.3% | +3.5% | +2.6% | +1.7% |
| 1998-03 | +2.4% | +3.4% | +2.9% | +1.8% | +0.4% |
| 1998-04 | +4.5% | +5.6% | +5.3% | +3.8% | +2.1% |
| 1998-05 | +5.7% | +6.7% | +6.4% | +5.0% | +3.4% |
| 1998-06 | +5.1% | +6.1% | +5.6% | +4.3% | +4.3% |
| 1998-07 | +0.6% | +1.6% | +1.0% | -0.2% | +0.7% |
| 1998-08 | +2.3% | +3.4% | +2.6% | +1.4% | +2.3% |
| 1998-09 | +3.5% | +4.7% | +3.7% | +2.7% | +3.4% |
| 1998-10 | +3.7% | +4.9% | +3.7% | +3.1% | +4.0% |
| 1998-11 | +1.7% | +2.9% | +1.8% | +0.8% | +2.4% |
| 1998-12 | -0.4% | +0.6% | -0.3% | -1.3% | +1.1% |
| 1999-01 | -1.2% | -0.6% | -0.9% | -2.1% | +0.2% |
| 1999-02 | -2.1% | -1.6% | -1.7% | -2.9% | -1.3% |
| 1999-03 | -0.9% | -0.1% | -0.5% | -1.8% | -0.1% |
| 1999-04 | +0.5% | +1.1% | +0.6% | -0.1% | +1.5% |
| 1999-05 | +3.5% | +4.2% | +3.5% | +2.8% | +4.9% |
| 1999-06 | +3.9% | +4.6% | +3.9% | +3.3% | +4.5% |
| 1999-07 | +6.2% | +7.3% | +6.2% | +5.6% | +6.8% |
| 1999-08 | +2.1% | +2.9% | +1.9% | +1.6% | +2.7% |
| 1999-09 | +3.5% | +4.4% | +3.3% | +3.0% | +4.7% |
| 1999-10 | +2.7% | +3.5% | +2.6% | +2.0% | +4.0% |
| 1999-11 | +5.5% | +6.2% | +5.4% | +5.1% | +6.8% |
| 1999-12 | +6.3% | +6.7% | +6.1% | +6.1% | +7.3% |
| 2000-01 | +8.7% | +9.1% | +8.3% | +8.6% | +9.1% |
| 2000-02 | +8.3% | +9.0% | +8.0% | +8.1% | +8.7% |
| 2000-03 | +6.8% | +7.4% | +6.8% | +6.6% | +6.5% |
| 2000-04 | +4.6% | +5.2% | +4.6% | +4.1% | +5.0% |
| 2000-05 | +4.8% | +5.6% | +5.0% | +3.9% | +5.5% |
| 2000-06 | +6.3% | +7.2% | +6.7% | +5.2% | +7.8% |
| 2000-07 | +3.6% | +4.7% | +4.4% | +2.3% | +4.7% |
| 2000-08 | +3.8% | +5.3% | +5.0% | +2.1% | +5.4% |
| 2000-09 | +2.2% | +4.1% | +3.4% | +0.3% | +3.7% |
| 2000-10 | +3.8% | +5.7% | +5.1% | +1.9% | +5.1% |
| 2000-11 | +3.5% | +5.6% | +4.7% | +1.7% | +4.6% |
| 2000-12 | +2.6% | +4.7% | +3.9% | +0.6% | +3.9% |
| 2001-01 | +5.5% | +7.2% | +6.7% | +3.6% | +7.6% |
| 2001-02 | +7.0% | +8.4% | +8.2% | +5.4% | +9.0% |
| 2001-03 | +8.7% | +9.9% | +9.6% | +7.4% | +10.7% |
| 2001-04 | +6.6% | +8.1% | +7.4% | +5.3% | +7.9% |
| 2001-05 | +6.1% | +7.2% | +6.8% | +5.1% | +7.2% |
| 2001-06 | +6.1% | +7.0% | +6.5% | +5.3% | +7.4% |
| 2001-07 | +7.9% | +8.1% | +8.2% | +7.3% | +9.6% |
| 2001-08 | +10.9% | +11.0% | +10.8% | +10.7% | +12.5% |
| 2001-09 | +12.7% | +12.5% | +12.5% | +12.7% | +14.1% |
| 2001-10 | +13.0% | +12.5% | +12.5% | +13.3% | +14.8% |
| 2001-11 | +12.8% | +12.0% | +12.6% | +12.9% | +14.9% |
| 2001-12 | +12.1% | +11.3% | +12.0% | +12.0% | +14.5% |
| 2002-01 | +8.5% | +8.0% | +8.7% | +8.1% | +10.7% |
| 2002-02 | +6.8% | +6.6% | +6.8% | +6.3% | +9.6% |
| 2002-03 | +8.0% | +7.5% | +7.9% | +7.6% | +11.0% |
| 2002-04 | +12.8% | +11.9% | +12.8% | +12.5% | +16.8% |
| 2002-05 | +14.9% | +13.9% | +15.1% | +14.4% | +19.0% |
| 2002-06 | +13.2% | +12.4% | +13.3% | +12.7% | +16.8% |
| 2002-07 | +16.2% | +15.5% | +16.1% | +15.9% | +19.6% |
| 2002-08 | +15.3% | +14.1% | +15.3% | +15.2% | +18.2% |
| 2002-09 | +16.0% | +14.4% | +16.6% | +15.8% | +18.5% |
| 2002-10 | +15.3% | +13.7% | +16.2% | +14.9% | +17.4% |
| 2002-11 | +14.4% | +13.1% | +15.1% | +14.2% | +16.2% |
| 2002-12 | +19.8% | +18.5% | +20.1% | +19.9% | +21.2% |
| 2003-01 | +22.1% | +20.4% | +22.0% | +22.7% | +23.4% |
| 2003-02 | +29.5% | +26.9% | +29.8% | +30.1% | +30.7% |
| 2003-03 | +27.4% | +25.0% | +27.6% | +28.0% | +28.8% |
| 2003-04 | +21.8% | +19.7% | +22.5% | +22.1% | +22.6% |
| 2003-05 | +20.0% | +18.5% | +20.5% | +20.2% | +20.4% |
| 2003-06 | +22.4% | +20.4% | +23.2% | +22.6% | +23.1% |
| 2003-07 | +25.0% | +22.3% | +25.8% | +25.4% | +25.9% |
| 2003-08 | +28.1% | +24.7% | +28.8% | +28.8% | +29.0% |
| 2003-09 | +25.6% | +22.1% | +25.8% | +26.8% | +26.3% |
| 2003-10 | +28.2% | +24.4% | +27.9% | +30.0% | +28.6% |
| 2003-11 | +30.2% | +26.0% | +29.9% | +32.2% | +30.3% |
| 2003-12 | +31.6% | +26.7% | +31.1% | +34.2% | +31.4% |
| 2004-01 | +29.7% | +24.8% | +29.2% | +32.3% | +29.5% |
| 2004-02 | +23.3% | +18.7% | +22.2% | +26.0% | +23.3% |
| 2004-03 | +23.0% | +18.5% | +21.7% | +25.7% | +23.2% |
| 2004-04 | +30.4% | +24.6% | +28.6% | +34.1% | +29.9% |
| 2004-05 | +34.5% | +27.1% | +32.1% | +39.0% | +34.1% |
| 2004-06 | +38.6% | +30.5% | +36.0% | +43.5% | +37.6% |
| 2004-07 | +32.4% | +24.7% | +29.9% | +36.9% | +31.7% |
| 2004-08 | +29.1% | +22.1% | +26.9% | +33.2% | +28.2% |
| 2004-09 | +30.9% | +24.1% | +28.7% | +35.0% | +30.4% |
| 2004-10 | +31.6% | +25.0% | +29.3% | +35.4% | +31.7% |
| 2004-11 | +31.2% | +24.8% | +28.7% | +34.9% | +31.8% |
| 2004-12 | +25.4% | +19.6% | +22.8% | +28.6% | +26.0% |
| 2005-01 | +22.7% | +17.1% | +20.1% | +25.7% | +23.3% |
| 2005-02 | +28.7% | +23.3% | +26.6% | +31.4% | +29.0% |
| 2005-03 | +30.7% | +25.4% | +29.1% | +33.3% | +30.8% |
| 2005-04 | +29.7% | +25.2% | +28.3% | +31.8% | +29.7% |
| 2005-05 | +19.8% | +16.8% | +18.6% | +21.5% | +19.8% |
| 2005-06 | +15.2% | +12.3% | +13.9% | +17.0% | +14.7% |
| 2005-07 | +12.2% | +9.8% | +11.0% | +14.0% | +11.6% |
| 2005-08 | +13.0% | +10.4% | +11.6% | +15.0% | +12.3% |
| 2005-09 | +12.0% | +9.6% | +10.6% | +14.0% | +11.5% |
| 2005-10 | +10.3% | +7.8% | +8.8% | +12.5% | +9.5% |
| 2005-11 | +10.5% | +7.9% | +9.2% | +12.6% | +9.4% |
| 2005-12 | +9.7% | +7.2% | +8.4% | +11.7% | +8.9% |
| 2006-01 | +12.9% | +10.4% | +11.7% | +15.0% | +11.7% |
| 2006-02 | +8.2% | +5.7% | +6.7% | +10.4% | +7.2% |
| 2006-03 | +7.4% | +5.2% | +6.0% | +9.7% | +6.0% |
| 2006-04 | +4.7% | +2.6% | +3.3% | +6.9% | +3.6% |
| 2006-05 | +7.1% | +5.2% | +6.0% | +9.0% | +5.9% |
| 2006-06 | +6.8% | +5.1% | +5.8% | +8.4% | +5.8% |
| 2006-07 | +10.5% | +8.8% | +9.4% | +12.2% | +9.6% |
| 2006-08 | +9.9% | +8.3% | +8.8% | +11.5% | +8.8% |
| 2006-09 | +10.6% | +9.0% | +9.5% | +12.0% | +9.6% |
| 2006-10 | +9.2% | +8.1% | +8.6% | +10.4% | +8.0% |
| 2006-11 | +8.2% | +7.2% | +7.6% | +9.3% | +6.8% |
| 2006-12 | +8.5% | +7.5% | +8.0% | +9.8% | +6.5% |
| 2007-01 | +6.7% | +5.7% | +6.3% | +8.0% | +4.8% |
| 2007-02 | +9.1% | +8.4% | +8.8% | +10.1% | +7.4% |
| 2007-03 | +9.8% | +8.9% | +9.3% | +10.8% | +8.4% |
| 2007-04 | +10.0% | +9.2% | +9.4% | +11.0% | +8.6% |
| 2007-05 | +10.2% | +9.0% | +9.4% | +11.4% | +8.9% |
| 2007-06 | +10.6% | +9.8% | +9.7% | +11.8% | +9.3% |
| 2007-07 | +9.4% | +8.8% | +8.6% | +10.4% | +8.4% |
| 2007-08 | +9.6% | +9.5% | +9.0% | +10.5% | +8.4% |
| 2007-09 | +6.5% | +6.5% | +5.9% | +7.3% | +5.2% |
| 2007-10 | +7.5% | +7.5% | +6.8% | +8.4% | +6.1% |
| 2007-11 | +7.5% | +7.9% | +7.0% | +8.2% | +6.4% |
| 2007-12 | +10.3% | +11.0% | +9.8% | +10.7% | +9.4% |
| 2008-01 | +8.6% | +9.4% | +8.0% | +8.9% | +8.1% |
| 2008-02 | +4.3% | +5.1% | +3.7% | +4.7% | +3.6% |
| 2008-03 | -1.7% | -0.8% | -2.0% | -1.4% | -2.5% |
| 2008-04 | -1.9% | -0.6% | -2.1% | -1.6% | -3.2% |
| 2008-05 | -1.9% | -0.3% | -1.9% | -1.9% | -3.0% |
| 2008-06 | -3.3% | -1.8% | -3.3% | -3.4% | -4.4% |
| 2008-07 | -5.8% | -4.7% | -5.4% | -6.2% | -6.7% |
| 2008-08 | -8.2% | -7.2% | -7.8% | -8.6% | -8.6% |
| 2008-09 | -7.3% | -5.9% | -7.0% | -7.9% | -7.4% |
| 2008-10 | -9.6% | -8.0% | -9.3% | -10.1% | -9.6% |
| 2008-11 | -11.2% | -9.7% | -10.9% | -11.7% | -11.4% |
| 2008-12 | -13.6% | -12.4% | -13.1% | -13.9% | -14.4% |
| 2009-01 | -12.6% | -11.1% | -12.0% | -13.0% | -13.6% |
| 2009-02 | -12.0% | -10.2% | -11.3% | -12.5% | -13.0% |
| 2009-03 | -8.7% | -6.7% | -8.1% | -9.5% | -8.5% |
| 2009-04 | -11.1% | -9.9% | -10.3% | -11.9% | -10.3% |
| 2009-05 | -12.5% | -11.4% | -11.8% | -13.2% | -11.8% |
| 2009-06 | -12.1% | -11.0% | -11.3% | -12.6% | -12.1% |
| 2009-07 | -9.7% | -8.3% | -9.1% | -10.0% | -10.5% |
| 2009-08 | -7.3% | -5.9% | -6.7% | -7.5% | -8.6% |
| 2009-09 | -7.5% | -6.8% | -6.7% | -7.5% | -9.4% |
| 2009-10 | -4.7% | -4.1% | -3.7% | -4.8% | -7.2% |
| 2009-11 | -2.2% | -1.7% | -1.4% | -2.0% | -5.2% |
| 2009-12 | +0.1% | +0.6% | +0.8% | +0.6% | -2.9% |
| 2010-01 | +0.7% | +1.3% | +1.6% | +1.0% | -3.1% |
| 2010-02 | -0.9% | -0.6% | +0.6% | -0.7% | -5.4% |
| 2010-03 | -1.5% | -0.7% | +0.2% | -1.8% | -6.8% |
| 2010-04 | +0.9% | +1.9% | +2.5% | +0.6% | -4.3% |
| 2010-05 | +4.3% | +5.7% | +5.9% | +3.8% | -0.7% |
| 2010-06 | +7.6% | +8.8% | +9.1% | +7.2% | +2.4% |
| 2010-07 | +6.2% | +7.4% | +7.6% | +5.7% | +1.4% |
| 2010-08 | +4.2% | +5.6% | +5.6% | +3.5% | -0.4% |
| 2010-09 | +1.4% | +3.2% | +2.7% | +0.6% | -2.7% |
| 2010-10 | -1.8% | -0.1% | -0.6% | -2.7% | -5.1% |
| 2010-11 | -2.9% | -1.2% | -1.7% | -4.0% | -5.4% |
| 2010-12 | -5.5% | -3.4% | -4.2% | -7.2% | -7.5% |
| 2011-01 | -8.1% | -6.2% | -7.0% | -9.7% | -9.2% |
| 2011-02 | -7.7% | -5.5% | -7.2% | -9.1% | -8.3% |
| 2011-03 | -6.5% | -4.6% | -6.4% | -7.3% | -7.1% |
| 2011-04 | -1.9% | +0.3% | -1.9% | -2.6% | -3.1% |
| 2011-05 | -4.0% | -2.0% | -3.8% | -4.6% | -5.0% |
| 2011-06 | -6.3% | -4.8% | -6.0% | -7.1% | -6.6% |
| 2011-07 | -7.8% | -6.9% | -7.5% | -8.7% | -7.3% |
| 2011-08 | -5.4% | -4.6% | -5.0% | -6.1% | -5.1% |
| 2011-09 | -0.9% | -0.4% | -0.7% | -1.4% | -0.9% |
| 2011-10 | -0.5% | +0.2% | -0.2% | -1.0% | -1.2% |
| 2011-11 | -0.5% | +0.1% | 0.0% | -1.1% | -0.9% |
| 2011-12 | -1.5% | -1.0% | -1.0% | -2.0% | -1.8% |
| 2012-01 | +2.9% | +2.7% | +3.5% | +2.7% | +2.7% |
| 2012-02 | +4.2% | +3.4% | +4.7% | +4.3% | +3.4% |
| 2012-03 | +5.5% | +3.6% | +6.0% | +6.1% | +4.9% |
| 2012-04 | -0.2% | -1.7% | +0.5% | +0.2% | -0.3% |
| 2012-05 | +0.3% | -1.1% | +0.8% | +0.7% | 0.0% |
| 2012-06 | -0.2% | -0.8% | +0.2% | +0.2% | -0.9% |
| 2012-07 | +3.4% | +2.8% | +3.6% | +4.0% | +1.9% |
| 2012-08 | +3.0% | +2.1% | +3.1% | +3.9% | +1.9% |
| 2012-09 | +1.1% | +0.3% | +1.2% | +1.7% | +0.4% |
| 2012-10 | +0.3% | -0.9% | +0.3% | +1.0% | +0.1% |
| 2012-11 | -2.1% | -3.2% | -2.2% | -1.4% | -2.8% |
| 2012-12 | -0.4% | -1.2% | -0.4% | +0.5% | -1.5% |
| 2013-01 | -2.7% | -3.0% | -2.6% | -2.2% | -4.2% |
| 2013-02 | -2.3% | -2.2% | -2.0% | -2.1% | -3.5% |
| 2013-03 | -5.6% | -4.8% | -5.2% | -6.0% | -6.8% |
| 2013-04 | -3.9% | -3.1% | -3.7% | -4.1% | -5.2% |
| 2013-05 | -3.2% | -2.5% | -3.0% | -3.4% | -4.4% |
| 2013-06 | -1.5% | -1.3% | -1.3% | -1.5% | -2.6% |
| 2013-07 | -2.1% | -1.9% | -1.9% | -2.2% | -2.9% |
| 2013-08 | -2.9% | -2.6% | -2.7% | -3.1% | -3.5% |
| 2013-09 | -1.4% | -1.1% | -1.1% | -1.7% | -2.0% |
| 2013-10 | +1.3% | +2.2% | +1.7% | +0.7% | +0.6% |
| 2013-11 | +2.7% | +3.7% | +3.2% | +2.0% | +1.8% |
| 2013-12 | +2.9% | +3.3% | +3.4% | +2.3% | +2.3% |
| 2014-01 | +3.5% | +3.4% | +3.7% | +3.4% | +3.7% |
| 2014-02 | +4.4% | +4.1% | +4.3% | +4.5% | +4.5% |
| 2014-03 | +4.7% | +4.2% | +4.6% | +5.1% | +4.7% |
| 2014-04 | +0.8% | +0.1% | +0.8% | +1.2% | +0.4% |
| 2014-05 | +1.6% | +0.7% | +1.6% | +2.1% | +1.1% |
| 2014-06 | +1.4% | +0.8% | +1.4% | +1.8% | +0.8% |
| 2014-07 | +2.8% | +2.3% | +2.9% | +3.2% | +2.0% |
| 2014-08 | +1.3% | +1.0% | +1.4% | +1.6% | +0.4% |
| 2014-09 | -0.3% | -0.9% | -0.4% | +0.2% | -1.0% |
| 2014-10 | -0.5% | -1.4% | -0.6% | +0.3% | -0.8% |
| 2014-11 | +0.3% | -0.6% | +0.2% | +1.1% | +0.2% |
| 2014-12 | +1.6% | +1.3% | +1.3% | +2.1% | +1.4% |
| 2015-01 | +1.3% | +1.3% | +1.2% | +1.4% | +0.8% |
| 2015-02 | +2.3% | +2.4% | +2.2% | +2.3% | +2.3% |
| 2015-03 | +3.0% | +3.3% | +3.1% | +2.7% | +3.0% |
| 2015-04 | +6.2% | +7.0% | +6.4% | +5.7% | +6.3% |
| 2015-05 | +4.2% | +5.2% | +4.5% | +3.6% | +3.9% |
| 2015-06 | +2.3% | +3.0% | +2.6% | +1.8% | +1.8% |
| 2015-07 | +0.5% | +1.2% | +0.9% | 0.0% | +0.2% |
| 2015-08 | +1.6% | +2.1% | +2.0% | +1.1% | +1.4% |
| 2015-09 | +5.8% | +6.7% | +6.2% | +5.1% | +5.5% |
| 2015-10 | +4.4% | +5.4% | +4.8% | +3.7% | +3.7% |
| 2015-11 | +3.0% | +4.1% | +3.5% | +2.4% | +2.2% |
| 2015-12 | +0.2% | +1.0% | +0.6% | -0.3% | -1.0% |
| 2016-01 | +2.7% | +3.4% | +3.2% | +2.3% | +1.5% |
| 2016-02 | +3.0% | +3.6% | +3.5% | +2.7% | +1.4% |
| 2016-03 | +5.0% | +5.2% | +5.2% | +4.9% | +4.0% |
| 2016-04 | +3.1% | +3.1% | +3.3% | +3.1% | +2.0% |
| 2016-05 | +3.2% | +3.0% | +3.1% | +3.5% | +2.5% |
| 2016-06 | +3.6% | +3.6% | +3.7% | +3.7% | +3.1% |
| 2016-07 | +3.1% | +3.3% | +3.0% | +3.3% | +2.8% |
| 2016-08 | +3.1% | +3.5% | +3.1% | +3.0% | +3.1% |
| 2016-09 | -1.1% | -1.1% | -1.0% | -1.1% | -1.2% |
| 2016-10 | -0.6% | -0.4% | -0.4% | -0.9% | -0.2% |
| 2016-11 | +0.4% | +0.8% | +0.6% | -0.1% | +0.8% |
| 2016-12 | +2.2% | +2.8% | +2.2% | +1.5% | +3.2% |
| 2017-01 | +0.2% | +1.1% | +0.2% | -0.4% | +1.1% |
| 2017-02 | 0.0% | +0.6% | -0.2% | -0.5% | +1.5% |
| 2017-03 | -1.5% | -0.9% | -1.6% | -2.2% | -0.4% |
| 2017-04 | -0.4% | +0.3% | -0.5% | -1.1% | +1.5% |
| 2017-05 | -2.1% | -1.4% | -1.9% | -3.0% | -0.5% |
| 2017-06 | -1.3% | -0.9% | -1.2% | -2.3% | +0.8% |
| 2017-07 | -1.2% | -1.1% | -1.0% | -2.1% | +0.8% |
| 2017-08 | -0.3% | -0.4% | -0.2% | -0.9% | +1.5% |
| 2017-09 | +2.3% | +2.5% | +2.3% | +1.8% | +4.0% |
| 2017-10 | +4.7% | +4.7% | +4.7% | +4.5% | +5.7% |
| 2017-11 | +4.6% | +4.3% | +4.6% | +4.5% | +5.5% |
| 2017-12 | +4.5% | +3.8% | +4.7% | +4.6% | +4.9% |
| 2018-01 | +4.4% | +3.6% | +4.7% | +4.3% | +4.9% |
| 2018-02 | +2.7% | +2.7% | +3.1% | +2.5% | +2.3% |
| 2018-03 | +2.4% | +2.5% | +2.6% | +2.4% | +1.6% |
| 2018-04 | +0.8% | +0.9% | +1.1% | +1.0% | -1.0% |
| 2018-05 | +2.9% | +2.8% | +3.3% | +3.4% | +0.6% |
| 2018-06 | +2.6% | +2.7% | +3.1% | +2.9% | 0.0% |
| 2018-07 | +2.0% | +2.6% | +2.6% | +2.2% | -0.6% |
| 2018-08 | +1.6% | +2.3% | +2.2% | +1.5% | -0.7% |
| 2018-09 | -1.4% | -0.9% | -0.8% | -1.4% | -3.7% |
| 2018-10 | -0.3% | 0.0% | +0.1% | -0.2% | -2.3% |
| 2018-11 | -1.8% | -1.6% | -1.4% | -1.6% | -3.8% |
| 2018-12 | -1.1% | -0.7% | -0.8% | -1.0% | -2.8% |
| 2019-01 | -3.4% | -2.8% | -3.0% | -3.4% | -5.3% |
| 2019-02 | -1.7% | -1.2% | -1.4% | -1.8% | -3.5% |
| 2019-03 | -0.3% | +0.4% | +0.3% | -0.6% | -2.5% |
| 2019-04 | +1.8% | +2.3% | +2.3% | +1.4% | 0.0% |
| 2019-05 | +0.4% | +1.0% | +0.8% | 0.0% | -1.3% |
| 2019-06 | -1.7% | -1.3% | -1.4% | -1.8% | -3.0% |
| 2019-07 | +1.2% | +1.5% | +1.3% | +1.2% | -0.1% |
| 2019-08 | +2.5% | +2.7% | +2.6% | +2.9% | +1.1% |
| 2019-09 | +4.8% | +5.0% | +4.8% | +5.3% | +3.6% |
| 2019-10 | -1.1% | -1.2% | -0.8% | -0.9% | -2.5% |
| 2019-11 | +0.5% | +0.3% | +0.9% | +0.6% | -0.7% |
| 2019-12 | -0.4% | -0.8% | +0.1% | -0.2% | -1.9% |
| 2020-01 | +3.3% | +3.0% | +3.7% | +3.7% | +1.6% |
| 2020-02 | +1.2% | +0.7% | +1.6% | +1.9% | -1.2% |
| 2020-03 | +0.8% | +0.3% | +1.0% | +1.4% | -1.6% |
| 2020-04 | -2.6% | -2.5% | -2.4% | -2.1% | -5.3% |
| 2020-05 | -1.8% | -1.0% | -1.8% | -1.8% | -4.0% |
| 2020-06 | +1.5% | +2.4% | +1.8% | +1.5% | -1.5% |
| 2020-07 | +1.1% | +1.4% | +1.6% | +1.0% | -1.6% |
| 2020-08 | +1.0% | +1.4% | +1.8% | +0.9% | -2.3% |
| 2020-09 | -1.4% | -0.7% | -0.6% | -1.8% | -5.0% |
| 2020-10 | +2.4% | +3.5% | +3.0% | +2.3% | -1.8% |
| 2020-11 | +2.4% | +3.3% | +2.7% | +2.8% | -1.8% |
| 2020-12 | +4.0% | +4.8% | +4.0% | +4.7% | -0.1% |
| 2021-01 | +5.7% | +5.3% | +5.8% | +6.9% | +3.0% |
| 2021-02 | +9.1% | +7.6% | +9.1% | +10.7% | +8.3% |
| 2021-03 | +12.0% | +9.1% | +11.9% | +14.3% | +13.2% |
| 2021-04 | +13.6% | +10.5% | +13.3% | +16.0% | +15.7% |
| 2021-05 | +12.2% | +9.0% | +11.8% | +15.0% | +13.6% |
| 2021-06 | +11.3% | +7.9% | +10.5% | +14.4% | +13.2% |
| 2021-07 | +9.7% | +7.0% | +9.0% | +12.5% | +10.8% |
| 2021-08 | +8.9% | +6.2% | +8.2% | +11.5% | +10.3% |
| 2021-09 | +11.4% | +8.3% | +10.8% | +14.0% | +12.7% |
| 2021-10 | +11.4% | +8.7% | +10.9% | +13.7% | +12.8% |
| 2021-11 | +13.3% | +11.1% | +13.0% | +15.0% | +14.4% |
| 2021-12 | +10.2% | +8.8% | +10.2% | +11.2% | +10.6% |
| 2022-01 | +8.6% | +7.7% | +8.6% | +9.5% | +7.6% |
| 2022-02 | +5.7% | +5.5% | +5.8% | +6.3% | +3.9% |
| 2022-03 | +5.3% | +6.1% | +5.6% | +5.2% | +2.0% |
| 2022-04 | +6.6% | +7.3% | +7.2% | +6.4% | +3.3% |
| 2022-05 | +8.1% | +8.5% | +8.8% | +8.0% | +4.5% |
| 2022-06 | +7.7% | +8.2% | +8.5% | +7.3% | +4.1% |
| 2022-07 | +8.7% | +8.8% | +9.5% | +8.6% | +4.8% |
| 2022-08 | +9.8% | +9.9% | +10.4% | +10.0% | +6.1% |
| 2022-09 | +9.6% | +9.4% | +10.1% | +10.1% | +5.8% |
| 2022-10 | +9.9% | +9.5% | +10.3% | +10.7% | +6.8% |
| 2022-11 | +8.0% | +7.5% | +8.2% | +8.8% | +5.1% |
| 2022-12 | +8.1% | +7.0% | +8.2% | +9.3% | +6.4% |
| 2023-01 | +6.7% | +6.3% | +6.8% | +7.3% | +5.1% |
| 2023-02 | +6.7% | +6.9% | +6.8% | +6.7% | +4.8% |
| 2023-03 | +5.0% | +5.8% | +5.1% | +4.7% | +3.1% |
| 2023-04 | +2.3% | +3.5% | +2.6% | +1.6% | +0.5% |
| 2023-05 | +1.4% | +2.6% | +1.7% | +0.5% | +0.3% |
| 2023-06 | +2.6% | +3.5% | +2.8% | +1.9% | +1.2% |
| 2023-07 | +2.5% | +3.3% | +2.7% | +1.8% | +1.4% |
| 2023-08 | +2.1% | +2.8% | +2.2% | +1.6% | +0.9% |
| 2023-09 | +0.7% | +1.5% | +0.9% | +0.2% | -0.1% |
| 2023-10 | +1.7% | +2.2% | +1.8% | +1.4% | +1.3% |
| 2023-11 | +2.8% | +3.4% | +3.0% | +2.2% | +2.6% |
| 2023-12 | +3.2% | +3.8% | +3.5% | +2.6% | +3.0% |
| 2024-01 | +3.0% | +3.6% | +3.2% | +2.4% | +2.6% |
| 2024-02 | +2.8% | +2.7% | +2.9% | +2.8% | +2.3% |
| 2024-03 | +2.9% | +2.3% | +2.8% | +3.3% | +2.9% |
| 2024-04 | +5.0% | +3.6% | +4.9% | +5.9% | +5.3% |
| 2024-05 | +4.3% | +2.8% | +4.0% | +5.3% | +4.8% |
| 2024-06 | +3.5% | +2.0% | +3.2% | +4.5% | +4.1% |
| 2024-07 | +2.9% | +1.6% | +2.6% | +4.0% | +3.2% |
| 2024-08 | +3.5% | +2.3% | +3.1% | +4.4% | +4.0% |
| 2024-09 | +5.2% | +4.4% | +4.9% | +6.0% | +5.2% |
| 2024-10 | +3.6% | +3.2% | +3.3% | +4.0% | +3.4% |
| 2024-11 | +3.8% | +3.2% | +3.6% | +4.5% | +3.1% |
| 2024-12 | +2.6% | +2.2% | +2.3% | +3.3% | +1.4% |
| 2025-01 | +3.5% | +3.2% | +3.5% | +4.3% | +1.9% |
| 2025-02 | +3.8% | +4.0% | +3.7% | +4.4% | +2.1% |
| 2025-03 | +4.5% | +3.6% | +4.3% | +5.8% | +3.5% |
| 2025-04 | -0.1% | -0.1% | -0.1% | +0.7% | -1.6% |
| 2025-05 | -0.6% | -0.1% | -0.5% | -0.2% | -3.0% |
| 2025-06 | -2.7% | -1.0% | -2.2% | -3.1% | -6.5% |
| 2025-07 | +1.2% | +2.4% | +1.8% | +1.3% | -2.4% |
| 2025-08 | +2.5% | +3.5% | +3.2% | +2.7% | -1.0% |
| 2025-09 | +3.5% | +4.4% | +4.2% | +3.8% | +0.1% |
| 2025-10 | +4.4% | +5.3% | +5.1% | +4.5% | +0.7% |
| 2025-11 | +3.7% | +4.7% | +4.2% | +3.9% | +0.2% |
| 2025-12 | +4.8% | +5.2% | +5.2% | +5.3% | +1.7% |
| 2026-01 | +4.0% | +3.8% | +4.5% | +5.1% | +1.1% |
| 2026-02 | +5.1% | +4.7% | +5.8% | +6.4% | +1.8% |
| 2026-03 | +4.8% | +5.6% | +5.7% | +5.3% | -0.6% |
Sold House Prices in Preston
The average sold price across all property types in Preston is £188,844, which is 34.9% below the England average of £289,946 as of March 2026. That discount runs through every property type but widens sharply at the cheaper end. Flats sit 53.2% below England, while detached houses are 28.5% below. The gap reflects Preston's stock: terraces and flats around the centre and university trade on local demand alone, with none of the new-build apartment premium that lifts flat values in Manchester or Liverpool.
| Property Type | Preston Average | England Average | Difference |
|---|---|---|---|
| Detached houses | £336,222 | £470,492 | -28.5% |
| Semi-detached houses | £203,257 | £288,185 | -29.5% |
| Terraced houses | £145,518 | £243,788 | -40.3% |
| Flats and maisonettes | £100,436 | £214,563 | -53.2% |
| All property types | £188,844 | £289,946 | -34.9% |
Detached houses at £336,222 carry the narrowest discount at 28.5% below England's £470,492. Preston's detached stock concentrates in the outer postcodes of PR3 (Garstang, Longridge) and PR4 (Kirkham, Freckleton), where village and semi-rural settings keep prices below the southern English premiums that pull the national average up. Annual growth of 5.6% across detached homes shows steady owner-occupier demand from across Lancashire.
Semi-detached houses at £203,257 sit 29.5% below England's £288,185. This is the family-housing core of Preston, concentrated in PR2 (Fulwood, Ribbleton) and PR5 (Bamber Bridge, Walton-le-Dale), where school catchments in Fulwood in particular drive owner-occupier competition. Annual growth of 5.7% is the strongest of any property type in the city.
Terraced houses at £145,518 offer a 40.3% discount to England's £243,788. The Victorian and Edwardian terraces of PR1 (City Centre, Deepdale) are the backbone of Preston's rental stock, providing some of the lowest entry points in the city close to the university and centre. Annual growth of 5.3% keeps terraced values moving in line with the wider market.
Flats and maisonettes at £100,436 show the deepest discount at 53.2% below England's £214,563. Preston is not a flat-heavy city, and the stock that exists is purpose-built blocks and converted terraces near UCLan rather than institutional new-build. Annual change of -0.6% confirms a flat, demand-led market where even a modest rent produces a high yield against the low purchase price.
Price Per Square Foot in Preston
At £180 per square foot in PR1 against £249 in PR3, just £69 separates Preston's cheapest space from its dearest across the five postcodes with data. Cost per square foot strips out the effect of property size and shows what the location itself commands. PR3 (Garstang, Longridge) tops the table on its village and rural stock, while PR1 anchors the bottom on older city-centre and Deepdale housing.
| Rank | Area | Price Per Sq Ft |
|---|---|---|
| 1 | PR1 (City Centre, Deepdale) | £180 |
| 2 | PR2 (Fulwood, Ribbleton) | £208 |
| 3 | PR5 (Bamber Bridge, Walton-le-Dale) | £227 |
| 4 | PR4 (Kirkham, Freckleton) | £244 |
| 5 | PR3 (Garstang, Longridge) | £249 |
| - | PR11 (Preston Large User/DWP) | Not enough data |
PR1 at £180 per square foot is the cheapest bricks-and-mortar value in Preston. This is the city centre and Deepdale, closest to UCLan and the main employment hubs, where older terraced and ex-council stock keeps the per-foot cost down. PR1 also delivers the highest yield in the city at 6.3%, so the cheapest space and the strongest rental return sit in the same postcode, the combination that pulls buy-to-let buyers towards the centre.
PR3 at £249 per square foot sits at the top, and it carries the highest asking prices too. Paying more per foot here buys village location: Garstang, Longridge and the rural fringe towards the Forest of Bowland. The 38% gap between PR1 and PR3 is modest by city standards, where premium postcodes often trade at double the cheapest. PR2 and PR5 form the middle ground at £208 and £227, the band where most residential buy-to-let activity sits.
For Sale Asking Prices in Preston
PR1 at £172,216 and PR3 at £331,733 sit 92.6% apart, the widest asking-price gap across Preston's five postcodes with data. Strip out the two rural-fringe postcodes, PR3 and PR4, and the urban range narrows to £172,216 in PR1 up to £225,597 in PR5, a tighter corridor for an investor comparing city entry points. The mean asking price across the five Preston postcodes with data is £253,591.
| Rank | Area | Asking Price |
|---|---|---|
| 1 | PR1 (City Centre, Deepdale) | £172,216 |
| 2 | PR2 (Fulwood, Ribbleton) | £224,214 |
| 3 | PR5 (Bamber Bridge, Walton-le-Dale) | £225,597 |
| 4 | PR4 (Kirkham, Freckleton) | £314,194 |
| 5 | PR3 (Garstang, Longridge) | £331,733 |
| - | PR11 (Preston Large User/DWP) | Not enough data |
PR1 at £172,216 sits in its own tier, nearly £52,000 below the next cheapest postcode and well under the city-wide Land Registry average of £188,844. That is the biggest single step in the table, and for an investor on a fixed budget it makes PR1 the lowest barrier to entry in Preston by a clear margin. PR2 and PR5 then cluster within £1,383 of each other, so the choice between them turns on yield, growth and tenant profile rather than price.
PR3 and PR4 above £310,000 are a different market. These are the larger detached and semi-detached homes of Garstang, Longridge, Kirkham and Freckleton, bought by owner-occupiers and downsizers from across Lancashire. The yields here are the lowest in the city, and the rural-fringe stock turns over more slowly, which matters for an investor thinking about the exit.

House Price Growth in Preston
PR5 (Bamber Bridge, Walton-le-Dale) leads Preston with 22.1% five-year growth and is the only postcode positive across all three timeframes. Every postcode posted positive five-year returns, but the recent picture splits the city. PR5 is up 1.7% over one year and 3.1% over three, while PR3 (Garstang, Longridge) sits at the other end, negative across both the one-year and three-year readings.
| Area | 1 Year | 3 Years | 5 Years |
|---|---|---|---|
| PR5 (Bamber Bridge, Walton-le-Dale) | 1.7% | 3.1% | 22.1% |
| PR2 (Fulwood, Ribbleton) | -2.1% | 6.8% | 15.5% |
| PR1 (City Centre, Deepdale) | -1.2% | 9.7% | 13.8% |
| PR4 (Kirkham, Freckleton) | -2.8% | 1.5% | 8.1% |
| PR3 (Garstang, Longridge) | -2.9% | -3.0% | 7.3% |
PR5 at 22.1% five-year growth has the strongest medium-term record in Preston, and it is the only postcode in positive figures across one, three and five years. Bamber Bridge and Walton-le-Dale sit south of the river towards the M6 and M65 junctions, where commuter access and steady family demand have held values up. That consistency, rather than a single big year, is what marks PR5 out.
PR1 shows a 13.8% five-year return but the most interesting middle period, up 9.7% over three years, the strongest three-year reading in the city, even as the latest year dipped 1.2%. The city-centre and Deepdale stock rerated hard through the post-pandemic catch-up before easing recently. PR3 is the weakest, negative over both one and three years, with its rural-fringe premium stock cooling fastest after the pandemic surge.
Monthly Property Sales in Preston
Transaction volumes range from 43 sales a month in PR3 to 80 in PR2, with turnover running from 8% in PR3 up to 23% in both PR2 and PR5. Even the quietest postcode sees steady monthly activity, but the share of advertised homes selling each month varies widely, and that turnover rate is the better read on how quickly a postcode's listings clear.
| Area | Sales Per Month | Turnover | Asking Price |
|---|---|---|---|
| PR2 (Fulwood, Ribbleton) | 80 | 23% | £224,214 |
| PR4 (Kirkham, Freckleton) | 73 | 12% | £314,194 |
| PR1 (City Centre, Deepdale) | 48 | 15% | £172,216 |
| PR5 (Bamber Bridge, Walton-le-Dale) | 45 | 23% | £225,597 |
| PR3 (Garstang, Longridge) | 43 | 8% | £331,733 |
PR2 and PR5 share the highest turnover at 23%, well ahead of PR3 at 8%. Fulwood, Ribbleton, Bamber Bridge and Walton-le-Dale carry deep pools of mid-priced family stock that change hands often, which for a buy-to-let investor signals an easier exit when the time comes to sell. PR2 records the most transactions at 80 a month on its large housing base.
PR3 records the fewest sales at 43 a month and the lowest turnover at 8%. The premium rural-fringe stock of Garstang and Longridge is more expensive and slower to move, so a similar headline volume represents a far smaller share of total stock. For an investor, a thin-turnover postcode is a longer wait at the exit, which is a holding cost a yield figure never shows.
How Long Properties Take to Sell in Preston
Selling speed splits Preston in two: PR5 (Bamber Bridge, Walton-le-Dale) clears fastest at about 132 days, while PR3 (Garstang, Longridge) is slowest at roughly 380 days. Days on market is the typical time a home is listed before it sells, and months of unsold stock shows how much for-sale supply is sitting there at the current rate of sales. The contrast between PR5 and PR3 is the single biggest exit-speed gap in the city.
| Area | Avg Days to Sell | Months of Unsold Stock | Market |
|---|---|---|---|
| PR5 (Bamber Bridge, Walton-le-Dale) | 132 | 4.3 | Seller's market |
| PR2 (Fulwood, Ribbleton) | 138 | 4.5 | Seller's market |
| PR1 (City Centre, Deepdale) | 179 | 5.9 | Seller's market |
| PR4 (Kirkham, Freckleton) | 254 | 8.3 | Balanced market |
| PR3 (Garstang, Longridge) | 380 | 12.5 | Buyer's market |
The spread is real money. A property in PR5 at 4.3 months of unsold stock moves nearly three times faster than one in PR3 at 12.5 months. Two postcodes can show a similar yield, but the time your capital is locked up waiting for a buyer is part of the return, and in Preston it varies from a brisk four months at the urban end to more than a year on the rural fringe. The three urban postcodes, PR1, PR2 and PR5, all read as seller's markets, which points to an easier exit close to the city.
What Type of Property Can You Buy in Preston?
Detached homes dominate the outer postcodes, from 50.5% of stock in PR4 to 56.4% in PR3, while terraces and flats concentrate heavily in PR1 at 24.1% and 15.7%. The mix of housing shapes which strategy fits each postcode, and the split between the urban centre and the rural fringe is unusually clean. The figures below are drawn from 2021 Census records for each postcode.
| Area | Detached | Semi-detached | Terraced | Flats |
|---|---|---|---|---|
| PR1 (City Centre, Deepdale) | 23.6% | 36.0% | 24.1% | 15.7% |
| PR2 (Fulwood, Ribbleton) | 32.0% | 33.8% | 20.6% | 13.5% |
| PR3 (Garstang, Longridge) | 56.4% | 25.3% | 11.1% | 3.1% |
| PR4 (Kirkham, Freckleton) | 50.5% | 31.0% | 10.8% | 3.2% |
| PR5 (Bamber Bridge, Walton-le-Dale) | 44.3% | 37.2% | 14.4% | 4.0% |
PR1 holds by far the largest share of terraced houses at 24.1% and flats at 15.7%. That is the smaller-unit stock that typically forms the buy-to-let market, and it lines up with PR1 carrying the lowest asking price and the highest yield in the city. City-centre flats suit single lets and student sharers near UCLan, while the terraced streets of Deepdale offer lower-cost family lets.
PR3 is the most detached-dominated postcode at 56.4%, with the smallest flat share at 3.1%. Detached and semi-detached houses together make up more than 80% of PR3's stock, which matches its premium asking prices and the lowest yield of the five postcodes. The housing here is weighted towards owner-occupier family homes rather than the smaller units that drive rental income.
The flats figure covers both purpose-built blocks and conversions, and a small share of mobile and temporary dwellings is not shown, so rows may not total 100%.
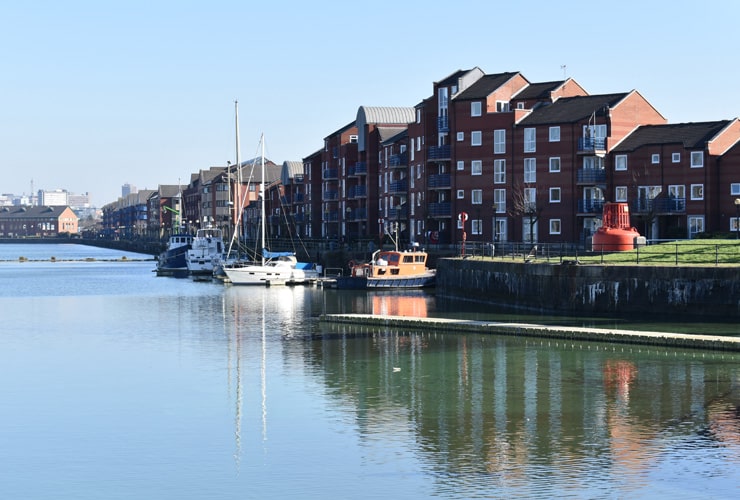
Preston Rental Market Analysis
Monthly rents in Preston range from £891 in PR2 to £1,087 in PR4, with gross rental yields from 3.9% to 6.3% across the five postcodes with data. For investors asking is buy to let worth it in Preston, the sections below break down rents, yields and tenant affordability postcode by postcode. If you are weighing how to build a property portfolio in the North West, Preston pairs Lancashire-affordable asking prices with the broad public-sector and university tenant base of a county capital. Browse current buy-to-let opportunities across the region.
Average Rent & Gross Rental Yields in Preston
Gross rental yields in Preston run from 3.9% in PR3 to 6.3% in PR1. The cheapest postcode delivers the highest yield and the most expensive delivers the lowest, the classic inverse that rewards the income investor for buying at the bottom of the price ladder. PR4 charges the highest rent at £1,087 a month but yields only 4.2%, because its £314,194 asking price is 82.4% higher than PR1's.
| Area | Average Monthly Rent | Asking Price | Gross Yield |
|---|---|---|---|
| PR1 (City Centre, Deepdale) | £910 | £172,216 | 6.3% |
| PR5 (Bamber Bridge, Walton-le-Dale) | £939 | £225,597 | 5.0% |
| PR2 (Fulwood, Ribbleton) | £891 | £224,214 | 4.8% |
| PR4 (Kirkham, Freckleton) | £1,087 | £314,194 | 4.2% |
| PR3 (Garstang, Longridge) | £1,082 | £331,733 | 3.9% |
PR1 at 6.3% combines the lowest asking price with a mid-range rent of £910 to deliver the best yield in Preston. A 30% deposit of £51,665 gets an investor into the highest-yielding postcode in the city, the lowest capital outlay on the table. The tenant pool here is mixed: city-centre flats draw UCLan students and young professionals, while Deepdale's terraced stock houses working families, which spreads void risk across segments.
PR3 at 3.9% sits at the bottom of Preston's yield table. The £1,082 monthly rent is among the highest in the city, but the £331,733 asking price means the income return is still compressed. As with most premium postcodes, the high price in PR3 does more for the rent figure than for the yield.
Is Preston Rent High?
Monthly rents in Preston consume between 28.7% and 35.1% of the local median gross monthly salary. The widely cited threshold for rent affordability is 30% of gross income. Two postcodes, PR1 and PR2, fall below that line, while PR3, PR4 and PR5 sit above it. That is a relatively tight band, reflecting rents that move within a narrow range across the city.
The median gross weekly salary in Preston is £715.70, which equates to £3,101 per month or £37,214 per year. This sits just below the North West median of £720.10 per week and the Great Britain median of £752.40 per week. Data from the Nomis Labour Market Profile (ASHE 2025).
| Rank | Area | Rent as % of Income |
|---|---|---|
| 1 | PR4 (Kirkham, Freckleton) | 35.1% |
| 2 | PR3 (Garstang, Longridge) | 34.9% |
| 3 | PR5 (Bamber Bridge, Walton-le-Dale) | 30.3% |
| 4 | PR1 (City Centre, Deepdale) | 29.3% |
| 5 | PR2 (Fulwood, Ribbleton) | 28.7% |
PR2 at 28.7% is the most affordable for tenants, with PR1 close behind at 29.3%. A monthly rent under £920 against a median monthly salary of £3,101 leaves headroom, and that matters for landlords because rents tenants can comfortably afford tend to bring lower void periods and fewer arrears. The urban core of Preston is where rent and local wage line up most comfortably.
PR4 at 35.1% is the least affordable, but the context is the stock. The higher rents of Kirkham and Freckleton attract dual-income households and professional tenants rather than single earners on the median salary, so the headline affordability figure overstates the strain on the actual tenant base.
How Big Is Preston's Private Rented Sector?
With 22.2% of homes already privately rented, PR1 has Preston's deepest established tenant base, against just 12.2% in PR4. The share of homes already let privately is a guide to how big and how tested the local lettings market is. The table below shows household tenure by postcode.
| Area | Owned Outright | Owned with Mortgage | Private Rented | Social Rented |
|---|---|---|---|---|
| PR1 (City Centre, Deepdale) | 34.1% | 29.3% | 22.2% | 14.0% |
| PR2 (Fulwood, Ribbleton) | 35.6% | 30.9% | 18.4% | 14.3% |
| PR3 (Garstang, Longridge) | 49.6% | 30.5% | 14.7% | 4.5% |
| PR5 (Bamber Bridge, Walton-le-Dale) | 45.5% | 35.7% | 12.9% | 5.6% |
| PR4 (Kirkham, Freckleton) | 47.6% | 33.8% | 12.2% | 5.4% |
PR1 has the largest private rented sector in Preston at 22.2%, with PR2 next at 18.4%. The two urban postcodes carry the city's deepest established tenant pools, which sits naturally with their lower prices, higher yields and proximity to the university and centre. A deeper rented sector points to an active lettings market and a wider pool of existing tenants to draw on.
PR3, PR4 and PR5 sit between 12.2% and 14.7% private rented, with owner-occupation dominant, and PR3 showing the highest outright ownership at 49.6%. These outer postcodes are owner-occupier territory first and rental markets second, which is consistent with their premium prices and lower yields. On the lettings side, PR1 has the volume to read the market clearly: around 394 homes were advertised to rent, taking roughly 226 days to let on average, which currently leaves the balance with tenants. PR2's smaller rental pool of about 87 listings lets far faster at around 68 days, the firmest landlord position in the city.
Local Housing Allowance Rates in Preston
Preston straddles two Broad Rental Market Areas: most of the city falls within Central Lancs, where Local Housing Allowance runs from £70.00 a week for a shared room to £212.88 for a four-bedroom home, while PR4 sits in the Fylde Coast BRMA on its own set of rates. Local Housing Allowance is the most a tenant on benefits can claim towards rent, so rent above that level comes out of the tenant's own income. The Central Lancs rates below cover PR1, PR2, PR3, PR5 and PR11; PR4 is shown separately. To check the current rate for a specific address, use the government's official Local Housing Allowance calculator.
| Property Size | Central Lancs (Weekly) | Fylde Coast / PR4 (Weekly) |
|---|---|---|
| Shared accommodation | £70.00 | £80.75 |
| 1 bedroom | £103.56 | £92.05 |
| 2 bedrooms | £132.33 | £124.73 |
| 3 bedrooms | £149.59 | £143.84 |
| 4 bedrooms | £212.88 | £170.88 |
In the Central Lancs area the two-bedroom rate of £132.33 a week works out at about £573 a month, below Preston's open-market rents of £891 to £1,087, so a benefit-backed tenancy sits under the going rate and the stock that fits within it concentrates in lower-priced PR1. PR4 in the Fylde Coast area carries a higher shared-room rate but lower rates above one bedroom, a quirk of how the two market areas are drawn that is worth checking before letting to that tenant segment in Kirkham or Freckleton.
Buy-to-Let Considerations
Are House Prices High in Preston? Price-to-Earnings Ratios
Buying in Preston takes between 4.6 and 8.9 times the local median annual salary. This is based on the Nomis Labour Market Profile for Preston, which puts the median gross annual income for Preston residents at £37,214.
The national benchmark for price-to-earnings is 7.4x (England's average sold price of £289,946 divided by the Great Britain median annual salary of £39,125). Three of Preston's five postcodes (PR1, PR2 and PR5) sit below that national benchmark, meaning they are more affordable relative to local incomes than England as a whole is relative to national incomes.
| Rank | Area | Price-to-Earnings Ratio |
|---|---|---|
| 1 | PR1 (City Centre, Deepdale) | 4.6x |
| 2 | PR2 (Fulwood, Ribbleton) | 6.0x |
| 3 | PR5 (Bamber Bridge, Walton-le-Dale) | 6.1x |
| 4 | PR4 (Kirkham, Freckleton) | 8.4x |
| 5 | PR3 (Garstang, Longridge) | 8.9x |
PR1 at 4.6x is well below the national benchmark of 7.4x and the most affordable entry point in Preston. At under five times local earnings, PR1 is competitive with the North West's highest-yielding postcodes, in a city with a broad public-sector and university employment base behind it.
PR3 at 8.9x sits above the national benchmark. At nearly nine times the local median salary, the rural-fringe stock of Garstang and Longridge is premium owner-occupier territory, bought by dual-income households or downsizers rather than investors. The elevated ratio is what compresses the yield and lengthens the payback period in these outer postcodes.
Deposit Requirements in Preston
A 30% deposit on a buy-to-let property in Preston ranges from £51,665 in PR1 to £99,520 in PR3. The gap between the cheapest and most expensive deposit is £47,855, nearly enough to fund a second PR1 deposit. For an investor comparing Preston with the wider North West, the PR1 entry sits below the cheapest postcodes in Chester and at the affordable end of the Lancashire market.
Beyond the deposit, the stamp duty calculation and the other ongoing rental costs shape the total capital a purchase needs.
| Rank | Area | 30% Deposit Required |
|---|---|---|
| 1 | PR1 (City Centre, Deepdale) | £51,665 |
| 2 | PR2 (Fulwood, Ribbleton) | £67,264 |
| 3 | PR5 (Bamber Bridge, Walton-le-Dale) | £67,679 |
| 4 | PR4 (Kirkham, Freckleton) | £94,258 |
| 5 | PR3 (Garstang, Longridge) | £99,520 |
PR1 is the cheapest way into Preston at a £51,665 deposit, and it buys the highest yield in the city at the same time. Stepping up to PR2 or PR5 costs roughly £15,600 to £16,000 more, and that money buys a different kind of postcode rather than just a bigger number. PR2 and PR5 are family-housing suburbs with stronger turnover and, in PR5's case, the steadiest five-year growth, where PR1 keeps the entry cost and the income return at their best.
PR2 and PR5 sit within £415 of each other on the deposit, effectively the same outlay, but they are not the same investment. PR2 (Fulwood, Ribbleton) has the larger, busier market and the stronger three-year growth at 6.8%; PR5 (Bamber Bridge, Walton-le-Dale) edges it on yield at 5.0% and has the better five-year record at 22.1%. Near-identical deposit, two different profiles to choose between.

What the Preston Data Tells Buy-to-Let Investors
In Preston the cheapest way in is also the highest-yielding postcode by a clear margin. PR1 has the top yield at 6.3%, the lowest asking price for investment properties in Preston at £172,216, and the most affordable prices against local earnings at 4.6 times income. A 30% deposit there is £51,665, the lowest in the city, for a home renting at £910 a month with the deepest private rented sector behind it.
PR5 leads on steady growth. Bamber Bridge and Walton-le-Dale posted the strongest five-year return at 22.1% and the only positive figures across one, three and five years, on a 5.0% yield and a £67,679 deposit. PR2 sits alongside it on price with the busier market and the better three-year growth at 6.8%. Between them, the two suburbs are where income and growth meet in the middle rather than where either one peaks.
At the other end, PR3 and PR4 carry the highest rents in the city at £1,082 and £1,087 a month, but yields of 3.9% and 4.2% and price-to-earnings ratios near nine times confirm that the rural-fringe premium does more for the rent than for the return. These are slower-turning markets, so an investor buying here is accepting a longer exit alongside the lower yield. Buyers who want to come in below asking in any postcode often work the off-market property in Preston route before listings reach the portals.
Preston runs no selective licensing scheme for private landlords city-wide, though HMOs still need a licence, so check Preston City Council's property licensing pages before letting room by room. With earnings close to the regional average, a 75.4% employment rate and a base of government, university and hospital jobs, Preston reads as a steadier tenant market than its sub-£190,000 average price would suggest. The £600 million-plus regeneration pipeline is a long-term tailwind rather than a priced-in fact today.
How Preston Compares
Preston's mean asking price of £253,591 sits in the middle of five Lancashire and North West locations, yet its top yield of 6.3% is the second-highest in the group, behind only Blackpool. The comparison below places Preston alongside four nearby locations, each with a different investor profile. The mean asking price and mean monthly rent are simple averages across all postcodes with data. Top gross yield is the single highest postcode yield in each location.
| Location | Mean Asking Price | Mean Monthly Rent | Mean Gross Yield | Top Yield (postcode) |
|---|---|---|---|---|
| Blackpool | £204,149 | £755 | 4.4% | 6.6% (FY1) |
| Blackburn | £223,233 | £821 | 4.4% | 5.0% (PR5) |
| Wigan | £233,131 | £892 | 4.6% | 5.4% (M46) |
| Preston | £253,591 | £982 | 4.6% | 6.3% (PR1) |
| Lancaster | £279,578 | £929 | 4.0% | 5.4% (LA1) |
Preston carries the highest mean monthly rent in the group at £982, ahead of even the more expensive Lancaster. Its 6.3% top yield trails only Blackpool at 6.6%, and Blackpool reaches that higher figure on the cheapest stock in the table at £204,149, with a coastal tenant market that behaves differently from Preston's employment-led one. Preston's combination of a mid-table price and a near-top yield comes from the strength of PR1 against the city's affordable base.
For an income investor weighing the wider Lancashire field, Blackburn at 5.0% and Wigan at 5.4% sit lower on yield despite cheaper average prices, while Lancaster at £279,578 is the most expensive in the group on a 5.4% top yield, carrying a university tenant base of its own. Preston offers the highest rent and the second-highest yield without the highest asking price. For a data-driven comparison across all UK locations, see our top buy-to-let locations guide.
Frequently Asked Questions
What are buy-to-let prices, yields and growth in Preston?
Preston's average sold price is £188,844, about 35% below England and 12% below the North West. PR1 records the city's highest published gross yield at 6.3%, while PR5 has the strongest five-year postcode growth at 22.1%.
The median wage is £715.70 a week, just below the regional figure. Government offices, the University of Central Lancashire, the Royal Preston Hospital and BAE Systems nearby provide employment context, but the page data do not establish how those employers affect an individual tenancy or investment return.
What are the best areas in Preston for property investment?
It comes down to whether you want income or growth, and the postcodes split cleanly. PR1 (City Centre and Deepdale) is the cheapest way in at £172,216 and the highest-yielding at 6.3%, with the deepest rental market, so it leans to income. PR5 (Bamber Bridge and Walton-le-Dale) is the only postcode positive across one, three and five years, up 22.1% over five, so it leans to steady growth.
PR2 (Fulwood and Ribbleton) sits beside PR5 on price with the busiest market and the strongest three-year growth at 6.8%, while the rural-fringe PR3 and PR4 carry the highest rents but the lowest yields. If income matters most, PR1 leads; if you want growth that has shown up across every timeframe, PR5 is the one.
What are average house prices in Preston?
The average sold price across Preston is £188,844 on the Land Registry index, about 34.9% below the England average of £289,946 as of March 2026. Asking prices by postcode run from £172,216 in PR1 (City Centre, Deepdale) up to £331,733 in PR3 (Garstang, Longridge), with a city-wide mean of £253,591 across the five postcodes with data. By type, detached homes average £336,222, semi-detached £203,257, terraced £145,518 and flats £100,436.
Through a buy-to-let lens, PR1 is the cheapest entry and the highest-yielding at 6.3%, while PR3 is the dearest and the lowest-yielding at 3.9%.
How does Preston compare to Liverpool or Manchester for buy-to-let?
They differ in measured scale and yield. Liverpool and buy-to-let in Manchester reach top yields of 8.0% and 8.1% across 24 and 22 priced postcodes respectively. Preston records a 6.3% top yield across five priced postcodes.
What Preston offers instead is a lower average price than Manchester and a public-sector and university employment base that holds tenant demand steady through a downturn. It is a county-capital market with steadier fundamentals rather than the scale and yield of the two big North West cities.
Is there demand for student accommodation in Preston?
Yes, and it concentrates in the city centre. The University of Central Lancashire's main campus sits in PR1, where the lower rents (£910 a month on average) and a stock of terraces and flats make the area workable for shared student lets. Student lets bring summer voids and more hands-on management than a standard tenancy, so factor that in. For the purpose-built end of the market, see our guide to purpose-built student accommodation.
On the HMO side, a sample of current PR1 room adverts puts a double room with a shared bathroom at around £114 a week, with most between £98 and £140, and an en-suite double nearer £141 a week. Those were the only room types with enough live adverts for a reliable figure. For how the numbers work on a shared house, see our HMO investment guide.
Can I find buy-to-let property under £200,000 in Preston?
Yes, and the City Centre is where to start. The PR1 postcode (City Centre, Deepdale) averages £172,216 on asking prices, comfortably under £200,000. It also carries the highest yield in the city at 6.3%. Below that figure the value is in property type as much as postcode: terraced houses across Preston average £145,518 on the Land Registry index, and flats average £100,436, both well under the £200,000 mark.
If sub-£200,000 is the target, PR1 terraces and flats are the obvious hunting ground, or look at the cheaper end of PR2. Buyers chasing the keenest prices also work the below market value properties route, which rarely reaches the portals first.
What type of property is most common in Preston?
It depends which part of the city. In the outer postcodes detached houses dominate, from 50.5% of stock in PR4 up to 56.4% in PR3. In the urban core the picture flips: PR1 holds the most terraces at 24.1% and the most flats at 15.7%, which is the smaller-unit stock that usually suits buy-to-let. Semi-detached houses are the steady middle layer everywhere, around a third of stock in most postcodes.
When will the Harris Quarter regeneration affect Preston property prices?
Some of it already has, and the rest is a slow burn. The £45 million Animate complex opened in February 2025 and the restored Harris Museum reopened in September 2025, so the cultural core of the Harris Quarter is delivering rather than promising. The residential conversions, like the 130 apartments in the Red Rose and Elizabethan House buildings, add city-centre stock that mostly affects PR1.
The bigger Station Quarter and Preston 35 plans run to 2035, so any broad effect on prices is a multi-year story. The value of the pipeline today is that schemes are completing on the ground, which is more than many regeneration prospectuses can say.
How do I buy an investment property in Preston?
Decide first whether you are buying for income or for growth, because that points you at a different postcode. PR1 (City Centre, Deepdale) is the cheapest entry at £172,216 and the highest-yielding at 6.3%, while PR5 (Bamber Bridge, Walton-le-Dale) pairs a 5.0% yield with the strongest five-year growth at 22.1%. Budget for a 30% deposit, which runs from £51,665 in PR1 to £99,520 in PR3.
Beyond what is listed openly, plenty of experienced investors buy below asking through off-market property channels. To see what is available now, browse investment properties or buy-to-let property for sale.
Ready to buy property?
Browse investment properties with prices and gross yields shown for each opportunity.
Get property alerts