

Wandsworth is a borough of south-west London, south of the river. The average sold price in Wandsworth is £672,069 on the HM Land Registry House Price Index, 131.8% above the England average of £289,946 and 21.6% above the wider London figure of £552,655. That puts Wandsworth firmly in prime inner-London territory, where the price of entry is high and gross yields compress into a narrow 4.8% to 5.3% band across the eight postcodes. The borough's population grew 6.68% between the 2011 and 2021 censuses, from 306,995 to 327,506 residents.
What separates Wandsworth from cheaper markets further out is the gap between how the sales market and the rental market behave. The for-sale side carries a lot of unsold stock, from about 11 months' worth in SW12 up to 33 months in the Battersea and Nine Elms postcodes at the current rate of sale, while the homes advertised to let amount to only six to nine weeks of lettings in every postcode. Those are stock-against-pace ratios, not a stopwatch on any one sale or tenancy, but they show a market where far more is waiting to sell than waiting to let. The spread between the cheapest postcode, SW17 (Tooting) at a £590,300 asking price, and the dearest, SW11 (Battersea, Clapham Junction) at £787,182, is £196,882, so the asking price alone separates the two ends of the borough.
This guide covers the London Borough of Wandsworth (ONS code E09000032) across postcodes SW4, SW8, SW11, SW12, SW15, SW17, SW18 and SW19. Six of those postcodes run past the borough line: SW4 (Clapham), SW8 (South Lambeth, Nine Elms) and SW12 (Balham) into Lambeth, SW15 (Putney, Roehampton) into Richmond upon Thames and Kingston upon Thames, and SW17 (Tooting) and SW19 (Wimbledon) into Merton, so the borough-level wage, licensing and price-index figures on this page do not cover every address in them. Only SW11 and SW18 sit wholly inside Wandsworth. Wandsworth sits in south-west London, south of the river between Lambeth to the east and Richmond upon Thames to the west, taking in Battersea, Clapham, Balham, Putney, Tooting, Earlsfield and Southfields. The neighbouring boroughs of Lambeth and Merton share parts of the same rental market.
Article updated: July 2026
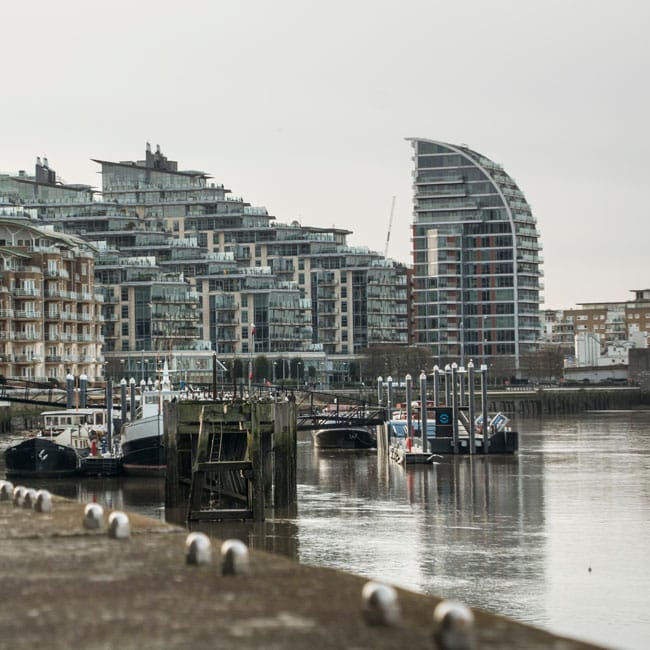
Why Invest in Wandsworth?
Wandsworth added 20,511 residents between the 2011 and 2021 censuses, a 6.68% rise from 306,995 to 327,506, slightly ahead of the 6.3% England and Wales average. The borough runs from Battersea and Nine Elms on the river down through Clapham, Balham and Tooting to Putney and Southfields in the west. It is one of the most connected parts of south London, with the Northern line now extended to Nine Elms and Battersea Power Station, District line stops at Putney and Southfields, and Clapham Junction handling more trains than any other station in Britain.
The local employment rate of 82.9% is well above the Great Britain rate of 75.6%. The borough carries a run of green space at Battersea Park, Clapham Common, Wandsworth Common and Tooting Bec Common, and the University of Roehampton in SW15 adds a student population. The tenure figures on this page count how many households rent privately, not what those renters do for a living.
Median gross annual earnings in Wandsworth are £54,584, which is 17.6% above the London median of £46,415 and 39.5% above the Great Britain median of £39,125. Even at those earnings, the average rent takes more than half of the Wandsworth median salary in every postcode. That salary is the borough's, so for the six postcodes that cross into Lambeth, Merton, Richmond and Kingston it is a Wandsworth-wage benchmark rather than a wage measured for those addresses. The private rented sector is between 27.7% and 41.6% of households depending on the postcode.
Wandsworth Economic Summary
- Population: 327,506 (2021 Census). Growth of 6.68% from 2011.
- Median annual salary: £54,584 (local), £46,415 (London), £39,125 (Great Britain)
- Median weekly salary: £1,016.60 (local), £902.70 (London), £766.60 (Great Britain)
- Employment rate: 82.9% (local), 75.6% (Great Britain)
- Key employment sectors: Professional and technical services, information and communication, finance and insurance, health and social work, wholesale and retail
Source: ONS Census 2021, Nomis Labour Market Profile (ASHE 2025)
Regeneration and Investment in Wandsworth
The Nine Elms regeneration along the Wandsworth riverside is one of the largest development zones in central London, with around 20,000 new homes planned across the wider opportunity area centred on SW8 and SW11. The transformation runs from Battersea Power Station east towards Vauxhall.
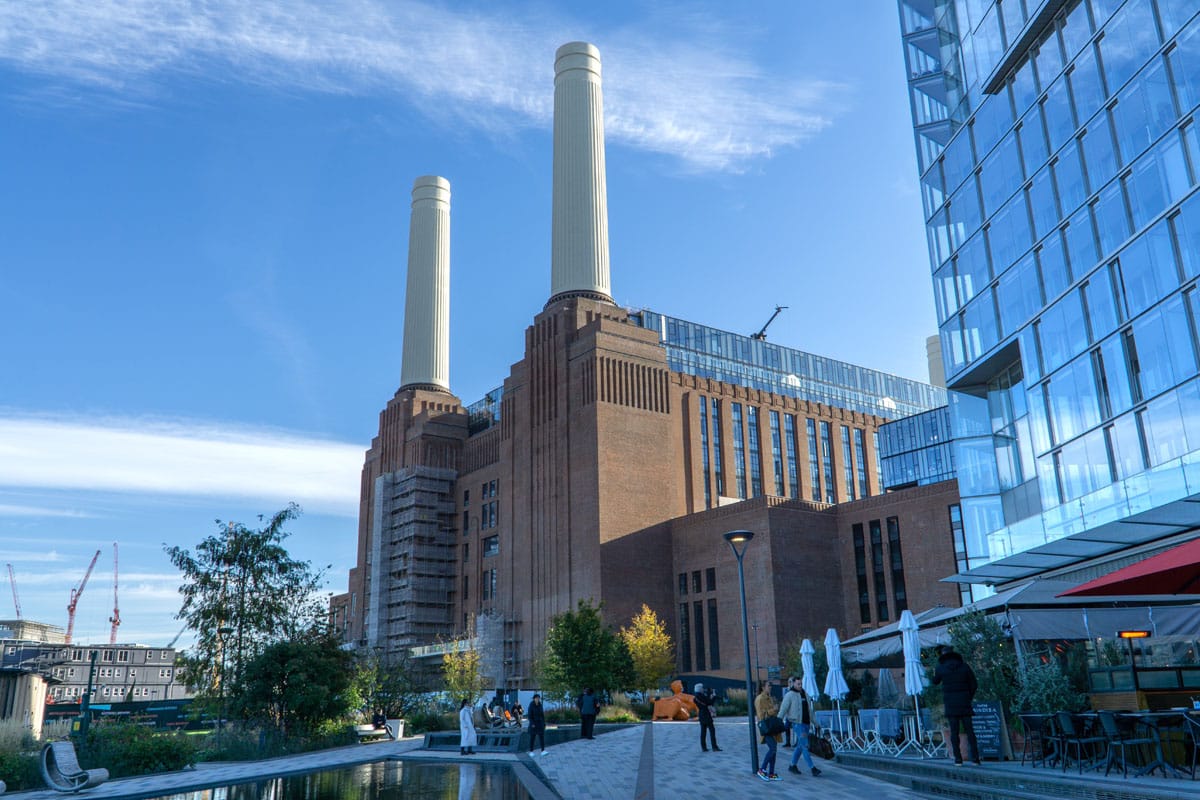
- Battersea Power Station (Phased, ongoing): The Grade II* listed power station reopened in October 2022 as a mixed-use destination with apartments, shops, restaurants and offices, including a large Apple campus. Later residential phases continue to add homes on the surrounding estate. The scheme sits at the western end of the Nine Elms zone and has its own Northern line station. Updates at Battersea Power Station.
- Nine Elms on the South Bank (Active): The wider Nine Elms opportunity area spans the SW8 riverside from Vauxhall to Battersea, with new residential towers, the relocated US Embassy, and the New Covent Garden Market redevelopment. It has added several thousand flats to the SW8 stock over the past decade. Updates at Nine Elms on the South Bank.
- Clapham Junction and Wandsworth town centre (Active): Wandsworth Council has earmarked sites around Clapham Junction in SW11 and the town centre in SW18 for residential-led renewal, including the Southside centre. These are established, well-connected centres rather than new districts, so the homes added here feed straight into the existing rental market. Updates at Wandsworth Council.
Wandsworth Property Market Analysis
Average property prices in Wandsworth have risen 561.4% since January 1995, from £101,607 to £672,069. The sections below trace that journey cycle by cycle, then drill into current postcode-level data for sold prices, price per square foot, asking prices, growth trends, and monthly transaction volumes.
When was the last house price crash in Wandsworth?
All sold prices for Wandsworth come from the HM Land Registry House Price Index at local-authority level. The index tracks average prices from January 1995 to March 2026, covering 31 years of market cycles.
The 1995 to 2007 boom: Wandsworth started at £101,607 in January 1995. By December 2000 the average had reached £215,290, more than doubling in six years as inner London led the national market. Growth continued through the 2000s, passing £323,066 by December 2005, and the market peaked at £454,115 in October 2007.
2008 to 2009, the financial crisis: Prices fell from the October 2007 peak of £454,115 to a trough of £366,386 in January 2009, a decline of 19.3% over 15 months. The worst year-on-year reading was -16.3% in January 2009. Wandsworth's fall was steeper than many regional markets, which is typical of prime London, where the same forces that drive prices up fastest in a boom pull them down hardest in a downturn.
Recovery, 2009 to 2011: Inner London bounced back faster than the rest of the country. Prices climbed off the January 2009 trough and passed the previous October 2007 peak by August 2011, at £454,405. That recovery took under four years, against the eight-and-a-half years it took many northern markets to regain their pre-crash levels.
The 2011 to 2016 surge: This was Wandsworth's strongest run. Prices moved from £440,044 in March 2011 to £635,886 by December 2014, then peaked at £709,000 in October 2016. Annual growth ran into double digits at points, reaching 14.5% in December 2014.
2016 to 2019, the plateau: After the October 2016 high, the market eased. Higher stamp duty on additional properties, tighter mortgage rules and Brexit uncertainty cooled the top end. Prices drifted from £709,000 down to £657,013 by March 2019 before steadying around £693,507 by December 2019.
2020 to 2022, the pandemic peak: The stamp duty holiday and renewed demand for homes with outdoor space lifted the market again. Prices rose from £679,701 in June 2020 to an all-time high of £767,904 in October 2022, with annual growth of 9.4% at that point.
2023 to present: Higher mortgage rates then unwound part of that gain. Prices eased to £728,527 by December 2023 (-2.8% annual), £705,690 by December 2024 (-3.1% annual) and £691,849 by December 2025 (-2.0% annual), reaching £672,069 at the latest reading in March 2026. That leaves the current average 12.5% below the October 2022 high and 2.7% below where it stood a decade ago in March 2016.
Long-term growth summary:
- 5 years (March 2021 to March 2026): 0.8% growth (£667,042 to £672,069)
- 10 years (March 2016 to March 2026): -2.7% change (£690,859 to £672,069)
- 15 years (March 2011 to March 2026): 52.7% growth (£440,044 to £672,069)
- 20 years (March 2006 to March 2026): 98.9% growth (£337,932 to £672,069)
- 31 years (January 1995 to March 2026): 561.4% growth (£101,607 to £672,069)
Wandsworth's 31-year return is 561.4%, and the recovery after 2009 was quick, back above the pre-crash peak within four years. The data since 2016 reads differently. Prices reached £709,000 in October 2016, then set a fresh high of £767,904 in October 2022, and have since come back to £672,069. An investor who bought at the October 2022 peak would be 12.5% down on the Land Registry average today. The long-run figures are strong; the last decade has been flat to slightly negative.
- All property types
- Detached
- Semi-detached
- Terraced
- Flats
Source: HM Land Registry House Price Index
| Year | All property types | Detached | Semi-detached | Terraced | Flats |
|---|---|---|---|---|---|
| 1995-01 | £101,607 | £324,769 | £167,905 | £119,636 | £87,115 |
| 1995-02 | £101,701 | £320,059 | £168,263 | £120,146 | £87,004 |
| 1995-03 | £99,961 | £312,863 | £165,142 | £118,099 | £85,569 |
| 1995-04 | £99,848 | £308,528 | £164,478 | £118,047 | £85,547 |
| 1995-05 | £99,265 | £307,220 | £163,538 | £117,409 | £85,003 |
| 1995-06 | £101,096 | £311,408 | £166,261 | £119,390 | £86,756 |
| 1995-07 | £103,065 | £319,928 | £170,069 | £122,146 | £88,056 |
| 1995-08 | £103,903 | £324,142 | £171,533 | £123,333 | £88,608 |
| 1995-09 | £104,836 | £330,123 | £173,685 | £124,818 | £89,029 |
| 1995-10 | £103,543 | £326,837 | £171,729 | £122,763 | £88,228 |
| 1995-11 | £102,659 | £321,946 | £169,676 | £121,147 | £87,950 |
| 1995-12 | £101,514 | £316,804 | £167,567 | £119,600 | £87,150 |
| 1996-01 | £102,218 | £316,714 | £168,364 | £120,634 | £87,705 |
| 1996-02 | £102,221 | £315,462 | £168,699 | £120,871 | £87,528 |
| 1996-03 | £103,788 | £323,121 | £171,924 | £122,845 | £88,698 |
| 1996-04 | £103,728 | £320,608 | £171,096 | £122,679 | £88,804 |
| 1996-05 | £105,019 | £324,494 | £172,762 | £124,641 | £89,671 |
| 1996-06 | £105,658 | £323,690 | £173,104 | £125,370 | £90,332 |
| 1996-07 | £106,948 | £332,020 | £176,560 | £127,289 | £91,005 |
| 1996-08 | £109,244 | £343,887 | £181,385 | £130,202 | £92,697 |
| 1996-09 | £108,919 | £343,410 | £180,887 | £130,015 | £92,279 |
| 1996-10 | £108,199 | £341,898 | £179,821 | £129,164 | £91,645 |
| 1996-11 | £106,661 | £334,645 | £176,849 | £127,236 | £90,464 |
| 1996-12 | £107,768 | £337,403 | £178,851 | £128,674 | £91,318 |
| 1997-01 | £109,855 | £342,110 | £182,101 | £131,524 | £92,891 |
| 1997-02 | £113,584 | £354,376 | £188,435 | £135,838 | £96,083 |
| 1997-03 | £116,165 | £364,088 | £192,777 | £139,085 | £98,119 |
| 1997-04 | £118,500 | £372,372 | £197,243 | £141,924 | £100,017 |
| 1997-05 | £121,897 | £384,527 | £203,947 | £146,371 | £102,602 |
| 1997-06 | £125,386 | £398,805 | £211,002 | £150,994 | £105,200 |
| 1997-07 | £129,779 | £412,929 | £218,590 | £156,953 | £108,527 |
| 1997-08 | £129,016 | £411,473 | £217,344 | £156,293 | £107,745 |
| 1997-09 | £130,118 | £414,824 | £219,561 | £157,759 | £108,573 |
| 1997-10 | £129,011 | £412,862 | £217,858 | £155,920 | £107,880 |
| 1997-11 | £132,081 | £424,673 | £223,608 | £159,542 | £110,438 |
| 1997-12 | £133,039 | £425,791 | £224,919 | £160,532 | £111,361 |
| 1998-01 | £136,837 | £440,559 | £231,663 | £165,489 | £114,306 |
| 1998-02 | £136,567 | £435,348 | £230,068 | £164,728 | £114,336 |
| 1998-03 | £139,630 | £443,827 | £235,194 | £168,722 | £116,747 |
| 1998-04 | £142,773 | £452,040 | £240,978 | £172,924 | £119,191 |
| 1998-05 | £146,665 | £464,616 | £247,832 | £178,566 | £122,020 |
| 1998-06 | £144,751 | £458,825 | £244,046 | £176,018 | £120,545 |
| 1998-07 | £144,596 | £458,719 | £244,020 | £175,964 | £120,344 |
| 1998-08 | £145,384 | £467,051 | £246,324 | £177,020 | £120,876 |
| 1998-09 | £149,340 | £484,731 | £254,205 | £182,239 | £123,902 |
| 1998-10 | £147,411 | £475,074 | £249,550 | £178,919 | £122,805 |
| 1998-11 | £147,823 | £474,112 | £249,889 | £178,648 | £123,515 |
| 1998-12 | £144,821 | £460,653 | £244,078 | £174,491 | £121,297 |
| 1999-01 | £144,885 | £465,124 | £245,156 | £174,807 | £121,173 |
| 1999-02 | £141,107 | £454,300 | £239,224 | £170,505 | £117,869 |
| 1999-03 | £146,228 | £470,835 | £247,633 | £176,491 | £122,268 |
| 1999-04 | £149,853 | £480,298 | £253,285 | £181,359 | £125,122 |
| 1999-05 | £159,810 | £507,170 | £269,040 | £193,637 | £133,431 |
| 1999-06 | £164,287 | £522,882 | £277,049 | £199,808 | £136,792 |
| 1999-07 | £173,409 | £555,629 | £293,169 | £211,559 | £144,026 |
| 1999-08 | £180,617 | £583,576 | £306,451 | £221,164 | £149,553 |
| 1999-09 | £185,244 | £600,859 | £314,636 | £226,952 | £153,292 |
| 1999-10 | £185,587 | £598,864 | £314,275 | £226,076 | £154,232 |
| 1999-11 | £184,602 | £594,857 | £312,371 | £224,189 | £153,741 |
| 1999-12 | £185,404 | £590,611 | £311,669 | £224,280 | £154,977 |
| 2000-01 | £189,741 | £609,267 | £320,966 | £230,347 | £158,083 |
| 2000-02 | £195,516 | £625,040 | £329,732 | £237,207 | £162,959 |
| 2000-03 | £202,533 | £654,412 | £343,936 | £246,505 | £168,228 |
| 2000-04 | £210,038 | £672,465 | £354,295 | £255,194 | £174,761 |
| 2000-05 | £211,339 | £675,818 | £356,774 | £256,579 | £175,903 |
| 2000-06 | £215,095 | £682,585 | £361,662 | £260,179 | £179,463 |
| 2000-07 | £218,079 | £701,176 | £369,289 | £263,995 | £181,707 |
| 2000-08 | £225,003 | £725,838 | £381,207 | £271,454 | £187,779 |
| 2000-09 | £223,902 | £728,100 | £379,651 | £269,884 | £186,898 |
| 2000-10 | £216,996 | £702,038 | £366,831 | £260,292 | £181,648 |
| 2000-11 | £213,572 | £694,625 | £360,508 | £255,802 | £178,924 |
| 2000-12 | £215,290 | £693,438 | £362,012 | £257,137 | £180,725 |
| 2001-01 | £220,911 | £707,438 | £369,739 | £264,126 | £185,451 |
| 2001-02 | £224,912 | £715,494 | £376,557 | £269,504 | £188,622 |
| 2001-03 | £225,572 | £717,229 | £378,425 | £271,128 | £188,846 |
| 2001-04 | £228,242 | £723,814 | £382,138 | £274,796 | £190,955 |
| 2001-05 | £235,358 | £739,559 | £392,491 | £283,740 | £196,878 |
| 2001-06 | £238,438 | £743,606 | £395,223 | £286,272 | £200,042 |
| 2001-07 | £241,303 | £755,113 | £400,950 | £289,535 | £202,452 |
| 2001-08 | £240,422 | £754,352 | £398,810 | £287,902 | £201,948 |
| 2001-09 | £243,464 | £768,670 | £404,453 | £292,126 | £204,227 |
| 2001-10 | £243,893 | £768,629 | £404,875 | £291,589 | £205,001 |
| 2001-11 | £240,589 | £757,800 | £399,407 | £286,305 | £202,731 |
| 2001-12 | £241,803 | £754,265 | £399,727 | £285,680 | £204,670 |
| 2002-01 | £242,994 | £752,389 | £400,257 | £286,116 | £206,145 |
| 2002-02 | £243,023 | £748,122 | £398,857 | £286,190 | £206,246 |
| 2002-03 | £245,139 | £756,471 | £403,238 | £289,142 | £207,810 |
| 2002-04 | £255,003 | £781,728 | £417,074 | £299,663 | £216,745 |
| 2002-05 | £265,056 | £807,280 | £433,254 | £311,024 | £225,507 |
| 2002-06 | £273,057 | £822,238 | £442,632 | £319,643 | £232,846 |
| 2002-07 | £275,753 | £833,308 | £448,027 | £324,153 | £234,555 |
| 2002-08 | £282,021 | £853,909 | £457,556 | £331,473 | £239,927 |
| 2002-09 | £283,715 | £864,334 | £463,018 | £334,402 | £240,841 |
| 2002-10 | £281,588 | £854,061 | £459,478 | £330,501 | £239,600 |
| 2002-11 | £278,818 | £846,407 | £454,374 | £326,260 | £237,651 |
| 2002-12 | £279,095 | £841,373 | £454,082 | £325,201 | £238,499 |
| 2003-01 | £282,588 | £848,802 | £457,424 | £329,342 | £241,586 |
| 2003-02 | £284,718 | £847,345 | £460,545 | £331,162 | £243,731 |
| 2003-03 | £285,138 | £852,120 | £459,721 | £330,852 | £244,458 |
| 2003-04 | £284,972 | £847,822 | £459,429 | £329,240 | £244,900 |
| 2003-05 | £290,100 | £861,864 | £467,669 | £335,757 | £249,083 |
| 2003-06 | £288,305 | £850,246 | £464,551 | £334,355 | £247,322 |
| 2003-07 | £291,685 | £861,039 | £471,468 | £339,789 | £249,550 |
| 2003-08 | £294,969 | £873,618 | £477,313 | £344,062 | £252,140 |
| 2003-09 | £300,858 | £894,813 | £488,824 | £352,038 | £256,622 |
| 2003-10 | £299,569 | £887,039 | £484,825 | £350,182 | £255,774 |
| 2003-11 | £292,514 | £861,620 | £472,864 | £341,578 | £249,945 |
| 2003-12 | £292,598 | £853,340 | £470,618 | £340,784 | £250,532 |
| 2004-01 | £292,950 | £858,836 | £472,425 | £341,071 | £250,795 |
| 2004-02 | £295,166 | £870,709 | £476,664 | £343,762 | £252,591 |
| 2004-03 | £300,230 | £885,137 | £484,313 | £349,906 | £256,846 |
| 2004-04 | £303,488 | £886,641 | £489,112 | £354,886 | £259,286 |
| 2004-05 | £307,771 | £882,816 | £493,133 | £360,278 | £263,029 |
| 2004-06 | £313,782 | £896,080 | £502,319 | £367,191 | £268,249 |
| 2004-07 | £321,880 | £922,482 | £516,973 | £377,310 | £274,857 |
| 2004-08 | £326,125 | £945,290 | £525,828 | £382,674 | £278,201 |
| 2004-09 | £327,028 | £956,695 | £529,573 | £384,550 | £278,537 |
| 2004-10 | £322,282 | £937,682 | £518,061 | £377,362 | £275,254 |
| 2004-11 | £317,930 | £920,979 | £509,218 | £371,565 | £271,888 |
| 2004-12 | £311,435 | £892,331 | £495,039 | £362,971 | £266,912 |
| 2005-01 | £314,951 | £902,948 | £501,147 | £368,050 | £269,562 |
| 2005-02 | £319,469 | £920,929 | £511,436 | £374,025 | £273,014 |
| 2005-03 | £325,125 | £937,574 | £522,755 | £381,763 | £277,346 |
| 2005-04 | £329,846 | £947,323 | £531,439 | £387,613 | £281,237 |
| 2005-05 | £329,440 | £936,243 | £527,856 | £387,157 | £281,073 |
| 2005-06 | £328,039 | £931,081 | £525,528 | £386,685 | £279,504 |
| 2005-07 | £330,887 | £943,178 | £531,676 | £390,599 | £281,654 |
| 2005-08 | £333,776 | £957,610 | £537,384 | £394,879 | £283,749 |
| 2005-09 | £332,168 | £961,170 | £536,430 | £393,095 | £282,227 |
| 2005-10 | £323,785 | £935,073 | £520,751 | £382,673 | £275,378 |
| 2005-11 | £322,059 | £926,219 | £517,515 | £380,457 | £274,008 |
| 2005-12 | £323,066 | £919,194 | £515,813 | £380,586 | £275,418 |
| 2006-01 | £326,720 | £932,639 | £523,075 | £386,056 | £278,073 |
| 2006-02 | £327,840 | £938,251 | £525,283 | £387,541 | £278,942 |
| 2006-03 | £337,932 | £977,604 | £545,049 | £400,951 | £286,822 |
| 2006-04 | £343,901 | £992,509 | £554,421 | £408,524 | £291,760 |
| 2006-05 | £351,425 | £1,020,092 | £567,764 | £417,798 | £297,941 |
| 2006-06 | £355,891 | £1,033,647 | £575,378 | £423,290 | £301,647 |
| 2006-07 | £363,443 | £1,058,770 | £589,748 | £433,905 | £307,417 |
| 2006-08 | £369,580 | £1,073,761 | £600,311 | £443,394 | £311,918 |
| 2006-09 | £373,357 | £1,089,385 | £608,118 | £449,025 | £314,653 |
| 2006-10 | £374,566 | £1,093,503 | £608,414 | £448,992 | £316,211 |
| 2006-11 | £374,526 | £1,092,124 | £608,495 | £448,321 | £316,372 |
| 2006-12 | £381,884 | £1,113,034 | £619,703 | £456,821 | £322,722 |
| 2007-01 | £387,024 | £1,131,369 | £629,561 | £463,588 | £326,779 |
| 2007-02 | £397,594 | £1,164,904 | £645,873 | £474,519 | £336,221 |
| 2007-03 | £398,772 | £1,167,708 | £648,606 | £476,613 | £336,977 |
| 2007-04 | £412,802 | £1,208,036 | £671,179 | £495,105 | £348,349 |
| 2007-05 | £421,132 | £1,227,608 | £683,840 | £506,688 | £354,972 |
| 2007-06 | £426,057 | £1,243,675 | £691,267 | £512,618 | £359,139 |
| 2007-07 | £434,057 | £1,276,143 | £707,337 | £522,711 | £365,575 |
| 2007-08 | £445,326 | £1,318,158 | £729,574 | £539,005 | £374,076 |
| 2007-09 | £453,102 | £1,353,739 | £745,297 | £548,813 | £380,308 |
| 2007-10 | £454,115 | £1,349,773 | £742,299 | £547,898 | £382,005 |
| 2007-11 | £449,399 | £1,346,384 | £734,024 | £539,717 | £378,726 |
| 2007-12 | £443,374 | £1,316,769 | £720,192 | £531,522 | £374,149 |
| 2008-01 | £437,617 | £1,308,680 | £712,437 | £524,405 | £369,242 |
| 2008-02 | £432,115 | £1,287,197 | £704,399 | £518,138 | £364,521 |
| 2008-03 | £437,132 | £1,302,744 | £715,693 | £525,634 | £368,254 |
| 2008-04 | £430,933 | £1,282,250 | £707,426 | £520,098 | £362,490 |
| 2008-05 | £431,597 | £1,287,826 | £710,186 | £522,419 | £362,596 |
| 2008-06 | £424,079 | £1,271,579 | £699,201 | £514,006 | £356,039 |
| 2008-07 | £422,216 | £1,273,623 | £699,377 | £512,018 | £354,276 |
| 2008-08 | £408,616 | £1,237,917 | £678,030 | £495,764 | £342,749 |
| 2008-09 | £412,264 | £1,252,799 | £682,236 | £498,954 | £346,167 |
| 2008-10 | £402,925 | £1,215,004 | £662,640 | £486,244 | £338,847 |
| 2008-11 | £396,224 | £1,192,905 | £650,547 | £477,216 | £333,492 |
| 2008-12 | £373,312 | £1,123,511 | £614,193 | £450,740 | £313,885 |
| 2009-01 | £366,386 | £1,116,041 | £603,819 | £441,980 | £308,082 |
| 2009-02 | £367,391 | £1,114,594 | £604,567 | £442,595 | £309,112 |
| 2009-03 | £371,576 | £1,122,762 | £609,602 | £446,147 | £313,090 |
| 2009-04 | £371,452 | £1,097,417 | £606,725 | £447,175 | £312,824 |
| 2009-05 | £379,514 | £1,117,360 | £620,370 | £459,265 | £318,704 |
| 2009-06 | £396,389 | £1,162,817 | £648,897 | £482,434 | £331,809 |
| 2009-07 | £405,408 | £1,206,073 | £669,696 | £496,861 | £337,676 |
| 2009-08 | £402,464 | £1,207,760 | £668,072 | £494,953 | £334,375 |
| 2009-09 | £402,037 | £1,215,417 | £670,751 | £496,025 | £333,216 |
| 2009-10 | £406,422 | £1,234,973 | £680,140 | £501,563 | £336,675 |
| 2009-11 | £410,371 | £1,247,909 | £686,033 | £507,891 | £339,429 |
| 2009-12 | £406,836 | £1,234,230 | £680,909 | £504,278 | £336,210 |
| 2010-01 | £408,671 | £1,238,844 | £685,219 | £509,682 | £336,537 |
| 2010-02 | £421,263 | £1,282,367 | £712,620 | £527,861 | £345,713 |
| 2010-03 | £428,215 | £1,310,485 | £725,332 | £536,882 | £351,221 |
| 2010-04 | £434,925 | £1,329,763 | £736,877 | £544,552 | £356,993 |
| 2010-05 | £437,341 | £1,334,921 | £737,405 | £546,093 | £359,679 |
| 2010-06 | £442,800 | £1,353,887 | £749,163 | £554,916 | £363,311 |
| 2010-07 | £448,010 | £1,387,476 | £761,861 | £563,989 | £366,401 |
| 2010-08 | £445,148 | £1,379,319 | £760,764 | £563,001 | £362,953 |
| 2010-09 | £437,605 | £1,365,846 | £750,219 | £554,814 | £356,157 |
| 2010-10 | £427,527 | £1,325,296 | £731,445 | £540,971 | £348,453 |
| 2010-11 | £412,193 | £1,281,791 | £703,890 | £519,654 | £336,674 |
| 2010-12 | £412,242 | £1,280,411 | £704,772 | £518,945 | £336,966 |
| 2011-01 | £421,038 | £1,324,846 | £723,257 | £530,414 | £343,768 |
| 2011-02 | £430,790 | £1,370,621 | £743,065 | £542,385 | £351,608 |
| 2011-03 | £440,044 | £1,419,409 | £760,883 | £554,407 | £358,817 |
| 2011-04 | £443,600 | £1,424,557 | £765,038 | £558,242 | £362,081 |
| 2011-05 | £450,873 | £1,421,945 | £771,546 | £567,023 | £368,641 |
| 2011-06 | £451,239 | £1,396,301 | £768,593 | £566,983 | £369,497 |
| 2011-07 | £446,938 | £1,372,671 | £759,743 | £561,685 | £366,093 |
| 2011-08 | £454,405 | £1,417,846 | £781,186 | £574,693 | £370,364 |
| 2011-09 | £450,606 | £1,424,462 | £779,794 | £572,012 | £366,148 |
| 2011-10 | £446,086 | £1,423,107 | £776,347 | £567,113 | £361,881 |
| 2011-11 | £437,892 | £1,396,014 | £760,251 | £554,250 | £356,171 |
| 2011-12 | £443,683 | £1,399,887 | £766,819 | £560,199 | £361,635 |
| 2012-01 | £456,738 | £1,436,996 | £790,801 | £578,289 | £371,694 |
| 2012-02 | £449,456 | £1,427,170 | £782,680 | £572,313 | £364,416 |
| 2012-03 | £446,754 | £1,425,874 | £779,354 | £569,261 | £361,927 |
| 2012-04 | £441,588 | £1,406,194 | £766,569 | £561,353 | £358,339 |
| 2012-05 | £462,124 | £1,446,786 | £795,738 | £585,767 | £375,928 |
| 2012-06 | £470,216 | £1,467,350 | £809,444 | £598,935 | £381,574 |
| 2012-07 | £484,203 | £1,520,297 | £837,470 | £618,895 | £392,018 |
| 2012-08 | £489,761 | £1,544,786 | £851,332 | £629,818 | £395,062 |
| 2012-09 | £493,087 | £1,560,957 | £858,257 | £633,836 | £397,760 |
| 2012-10 | £483,143 | £1,522,923 | £838,774 | £620,795 | £389,936 |
| 2012-11 | £476,726 | £1,502,412 | £825,898 | £611,517 | £385,160 |
| 2012-12 | £482,703 | £1,523,603 | £837,475 | £620,096 | £389,633 |
| 2013-01 | £492,698 | £1,569,182 | £861,154 | £633,289 | £397,284 |
| 2013-02 | £504,943 | £1,619,482 | £885,137 | £648,676 | £407,105 |
| 2013-03 | £498,721 | £1,601,858 | £872,291 | £638,757 | £402,682 |
| 2013-04 | £506,125 | £1,617,333 | £878,797 | £649,116 | £408,626 |
| 2013-05 | £504,235 | £1,606,096 | £874,546 | £646,489 | £407,211 |
| 2013-06 | £514,416 | £1,640,087 | £894,526 | £661,991 | £414,661 |
| 2013-07 | £522,646 | £1,662,913 | £909,849 | £673,594 | £420,997 |
| 2013-08 | £536,326 | £1,707,989 | £935,105 | £694,403 | £431,067 |
| 2013-09 | £556,164 | £1,778,848 | £969,452 | £718,657 | £447,386 |
| 2013-10 | £552,033 | £1,763,939 | £960,477 | £712,140 | £444,456 |
| 2013-11 | £553,830 | £1,758,762 | £958,374 | £711,327 | £446,992 |
| 2013-12 | £555,390 | £1,742,026 | £956,846 | £712,359 | £448,759 |
| 2014-01 | £570,568 | £1,797,342 | £985,144 | £731,107 | £461,130 |
| 2014-02 | £583,560 | £1,850,919 | £1,009,411 | £747,090 | £471,671 |
| 2014-03 | £593,007 | £1,887,435 | £1,026,326 | £759,124 | £479,205 |
| 2014-04 | £607,282 | £1,934,565 | £1,051,707 | £778,766 | £490,418 |
| 2014-05 | £622,238 | £1,971,301 | £1,076,003 | £798,983 | £502,349 |
| 2014-06 | £638,620 | £2,014,580 | £1,102,241 | £821,585 | £515,313 |
| 2014-07 | £647,132 | £2,034,272 | £1,115,820 | £834,245 | £521,863 |
| 2014-08 | £657,664 | £2,076,863 | £1,137,533 | £850,733 | £529,599 |
| 2014-09 | £654,785 | £2,082,563 | £1,137,437 | £847,750 | £526,944 |
| 2014-10 | £650,495 | £2,072,134 | £1,129,650 | £839,768 | £524,017 |
| 2014-11 | £635,630 | £2,020,229 | £1,100,588 | £817,840 | £512,734 |
| 2014-12 | £635,886 | £2,010,055 | £1,096,313 | £815,928 | £513,588 |
| 2015-01 | £635,439 | £2,006,906 | £1,096,989 | £815,849 | £513,092 |
| 2015-02 | £642,817 | £2,037,726 | £1,114,150 | £825,020 | £518,998 |
| 2015-03 | £643,940 | £2,041,778 | £1,116,978 | £826,207 | £519,942 |
| 2015-04 | £644,260 | £2,047,306 | £1,115,463 | £826,625 | £520,227 |
| 2015-05 | £638,082 | £2,015,916 | £1,100,872 | £818,398 | £515,430 |
| 2015-06 | £638,673 | £2,025,681 | £1,105,652 | £823,716 | £514,758 |
| 2015-07 | £652,142 | £2,062,579 | £1,130,235 | £842,041 | £525,390 |
| 2015-08 | £670,109 | £2,122,817 | £1,162,207 | £868,133 | £539,174 |
| 2015-09 | £676,698 | £2,155,358 | £1,173,233 | £874,524 | £544,930 |
| 2015-10 | £680,740 | £2,170,754 | £1,177,059 | £879,080 | £548,397 |
| 2015-11 | £680,331 | £2,174,553 | £1,177,277 | £877,631 | £548,239 |
| 2015-12 | £681,565 | £2,169,001 | £1,179,085 | £879,142 | £549,291 |
| 2016-01 | £684,376 | £2,178,018 | £1,189,840 | £883,478 | £551,271 |
| 2016-02 | £681,495 | £2,176,996 | £1,188,505 | £879,879 | £548,817 |
| 2016-03 | £690,859 | £2,216,838 | £1,205,256 | £891,845 | £556,343 |
| 2016-04 | £693,134 | £2,209,239 | £1,200,996 | £893,355 | £558,728 |
| 2016-05 | £703,424 | £2,201,946 | £1,204,506 | £902,563 | £568,403 |
| 2016-06 | £699,866 | £2,172,560 | £1,192,659 | £895,524 | £566,283 |
| 2016-07 | £704,521 | £2,189,738 | £1,203,427 | £902,589 | £569,725 |
| 2016-08 | £699,646 | £2,189,663 | £1,199,131 | £897,540 | £565,364 |
| 2016-09 | £703,250 | £2,195,495 | £1,206,460 | £902,810 | £568,122 |
| 2016-10 | £709,000 | £2,212,662 | £1,212,574 | £904,604 | £574,141 |
| 2016-11 | £705,783 | £2,207,246 | £1,206,172 | £897,871 | £572,149 |
| 2016-12 | £705,774 | £2,208,070 | £1,202,830 | £894,768 | £572,928 |
| 2017-01 | £692,362 | £2,159,715 | £1,176,550 | £878,089 | £562,063 |
| 2017-02 | £697,469 | £2,170,037 | £1,180,396 | £880,836 | £567,301 |
| 2017-03 | £714,036 | £2,227,517 | £1,208,195 | £900,034 | £581,205 |
| 2017-04 | £723,637 | £2,275,916 | £1,227,196 | £910,237 | £589,376 |
| 2017-05 | £721,839 | £2,263,572 | £1,223,615 | £906,829 | £588,251 |
| 2017-06 | £711,920 | £2,223,305 | £1,205,153 | £894,254 | £580,271 |
| 2017-07 | £716,130 | £2,218,526 | £1,210,622 | £899,648 | £583,782 |
| 2017-08 | £727,208 | £2,273,183 | £1,237,911 | £919,056 | £591,118 |
| 2017-09 | £718,897 | £2,258,924 | £1,228,404 | £910,345 | £583,750 |
| 2017-10 | £705,284 | £2,238,175 | £1,212,093 | £895,777 | £571,771 |
| 2017-11 | £693,925 | £2,186,371 | £1,188,547 | £879,982 | £563,065 |
| 2017-12 | £684,818 | £2,160,217 | £1,173,089 | £868,748 | £555,580 |
| 2018-01 | £681,418 | £2,132,894 | £1,164,221 | £862,969 | £553,329 |
| 2018-02 | £682,744 | £2,149,796 | £1,168,632 | £863,542 | £554,513 |
| 2018-03 | £679,801 | £2,121,242 | £1,162,895 | £861,525 | £551,938 |
| 2018-04 | £682,474 | £2,134,622 | £1,170,587 | £868,976 | £553,266 |
| 2018-05 | £680,270 | £2,135,021 | £1,174,831 | £873,369 | £549,941 |
| 2018-06 | £688,571 | £2,184,722 | £1,196,143 | £884,115 | £556,424 |
| 2018-07 | £687,525 | £2,210,167 | £1,200,424 | £884,652 | £555,027 |
| 2018-08 | £695,094 | £2,238,565 | £1,212,268 | £893,185 | £561,378 |
| 2018-09 | £690,762 | £2,226,712 | £1,206,887 | £890,899 | £557,220 |
| 2018-10 | £687,502 | £2,198,936 | £1,196,624 | £883,391 | £555,344 |
| 2018-11 | £675,133 | £2,176,357 | £1,180,905 | £870,050 | £544,718 |
| 2018-12 | £683,123 | £2,202,345 | £1,191,854 | £875,594 | £552,111 |
| 2019-01 | £674,182 | £2,178,006 | £1,179,003 | £865,542 | £544,553 |
| 2019-02 | £665,329 | £2,144,676 | £1,160,392 | £850,904 | £538,075 |
| 2019-03 | £657,013 | £2,117,145 | £1,148,689 | £844,478 | £530,416 |
| 2019-04 | £663,188 | £2,136,604 | £1,160,293 | £855,254 | £534,684 |
| 2019-05 | £664,437 | £2,124,720 | £1,162,900 | £860,757 | £534,781 |
| 2019-06 | £660,070 | £2,110,348 | £1,155,609 | £856,366 | £530,949 |
| 2019-07 | £671,628 | £2,132,336 | £1,173,959 | £870,715 | £540,508 |
| 2019-08 | £676,714 | £2,171,843 | £1,188,128 | £880,647 | £543,572 |
| 2019-09 | £691,430 | £2,231,409 | £1,214,003 | £900,596 | £555,158 |
| 2019-10 | £686,907 | £2,247,960 | £1,214,963 | £895,263 | £551,030 |
| 2019-11 | £689,996 | £2,243,682 | £1,219,803 | £897,321 | £554,043 |
| 2019-12 | £693,507 | £2,246,765 | £1,227,543 | £901,673 | £556,896 |
| 2020-01 | £694,384 | £2,237,034 | £1,226,942 | £904,073 | £557,399 |
| 2020-02 | £699,832 | £2,285,606 | £1,244,196 | £914,200 | £560,697 |
| 2020-03 | £700,283 | £2,310,986 | £1,252,076 | £916,623 | £560,314 |
| 2020-04 | £701,313 | £2,350,059 | £1,260,808 | £922,730 | £559,653 |
| 2020-05 | £696,402 | £2,318,594 | £1,246,445 | £911,757 | £557,038 |
| 2020-06 | £679,701 | £2,238,430 | £1,215,547 | £893,431 | £542,959 |
| 2020-07 | £683,004 | £2,223,621 | £1,218,253 | £897,594 | £545,833 |
| 2020-08 | £699,768 | £2,296,094 | £1,258,327 | £928,282 | £556,805 |
| 2020-09 | £721,497 | £2,399,492 | £1,305,901 | £961,172 | £572,767 |
| 2020-10 | £718,177 | £2,396,457 | £1,304,779 | £962,763 | £568,547 |
| 2020-11 | £710,541 | £2,361,990 | £1,287,591 | £954,035 | £562,278 |
| 2020-12 | £695,603 | £2,310,104 | £1,259,325 | £935,668 | £550,105 |
| 2021-01 | £690,313 | £2,281,453 | £1,243,950 | £923,614 | £547,289 |
| 2021-02 | £672,194 | £2,207,306 | £1,205,866 | £894,387 | £534,332 |
| 2021-03 | £667,042 | £2,162,404 | £1,185,930 | £880,479 | £532,389 |
| 2021-04 | £656,416 | £2,128,431 | £1,165,179 | £864,718 | £524,427 |
| 2021-05 | £661,749 | £2,146,245 | £1,174,119 | £871,369 | £528,802 |
| 2021-06 | £664,441 | £2,156,849 | £1,178,711 | £878,729 | £529,936 |
| 2021-07 | £676,559 | £2,223,366 | £1,205,724 | £894,479 | £539,395 |
| 2021-08 | £691,024 | £2,325,504 | £1,249,419 | £918,538 | £548,868 |
| 2021-09 | £698,168 | £2,383,024 | £1,273,880 | £928,600 | £553,903 |
| 2021-10 | £701,791 | £2,424,848 | £1,293,102 | £936,491 | £555,465 |
| 2021-11 | £702,232 | £2,424,186 | £1,293,179 | £936,132 | £556,092 |
| 2021-12 | £702,555 | £2,443,329 | £1,300,106 | £939,492 | £555,323 |
| 2022-01 | £708,758 | £2,458,153 | £1,314,002 | £951,360 | £559,246 |
| 2022-02 | £715,189 | £2,459,887 | £1,321,467 | £959,112 | £564,917 |
| 2022-03 | £728,053 | £2,522,798 | £1,350,088 | £974,841 | £575,276 |
| 2022-04 | £739,554 | £2,562,229 | £1,368,770 | £991,102 | £584,190 |
| 2022-05 | £734,272 | £2,569,749 | £1,367,517 | £988,270 | £578,338 |
| 2022-06 | £731,786 | £2,539,489 | £1,358,097 | £985,497 | £576,476 |
| 2022-07 | £734,106 | £2,538,546 | £1,366,556 | £992,550 | £577,073 |
| 2022-08 | £748,014 | £2,580,805 | £1,393,607 | £1,015,903 | £586,669 |
| 2022-09 | £754,912 | £2,636,350 | £1,416,949 | £1,031,411 | £589,775 |
| 2022-10 | £767,904 | £2,687,983 | £1,439,986 | £1,048,694 | £600,066 |
| 2022-11 | £760,292 | £2,673,968 | £1,426,341 | £1,036,878 | £594,443 |
| 2022-12 | £749,830 | £2,615,700 | £1,400,455 | £1,020,045 | £587,318 |
| 2023-01 | £728,472 | £2,545,529 | £1,365,531 | £990,391 | £570,593 |
| 2023-02 | £722,689 | £2,504,956 | £1,351,346 | £980,559 | £566,892 |
| 2023-03 | £707,020 | £2,463,747 | £1,325,987 | £956,255 | £555,378 |
| 2023-04 | £694,573 | £2,425,979 | £1,301,698 | £938,241 | £545,969 |
| 2023-05 | £697,580 | £2,422,838 | £1,305,256 | £941,300 | £548,787 |
| 2023-06 | £699,279 | £2,432,260 | £1,309,976 | £948,275 | £548,605 |
| 2023-07 | £704,054 | £2,450,819 | £1,322,349 | £958,627 | £551,036 |
| 2023-08 | £697,539 | £2,457,843 | £1,317,688 | £955,052 | £543,898 |
| 2023-09 | £715,880 | £2,510,476 | £1,351,681 | £981,419 | £557,900 |
| 2023-10 | £725,292 | £2,522,418 | £1,363,176 | £991,366 | £566,461 |
| 2023-11 | £739,952 | £2,571,127 | £1,390,386 | £1,007,575 | £579,103 |
| 2023-12 | £728,527 | £2,508,492 | £1,364,245 | £989,316 | £571,267 |
| 2024-01 | £717,216 | £2,466,554 | £1,342,001 | £974,916 | £562,156 |
| 2024-02 | £711,493 | £2,426,855 | £1,328,448 | £968,581 | £557,439 |
| 2024-03 | £721,959 | £2,486,010 | £1,348,640 | £980,765 | £566,002 |
| 2024-04 | £726,454 | £2,510,546 | £1,359,239 | £985,386 | £569,809 |
| 2024-05 | £728,085 | £2,517,147 | £1,358,838 | £985,413 | £571,756 |
| 2024-06 | £730,557 | £2,506,181 | £1,360,134 | £991,100 | £573,263 |
| 2024-07 | £738,478 | £2,534,430 | £1,377,723 | £1,007,159 | £578,025 |
| 2024-08 | £735,934 | £2,523,232 | £1,375,260 | £1,009,328 | £574,522 |
| 2024-09 | £728,180 | £2,526,686 | £1,372,018 | £1,002,907 | £566,936 |
| 2024-10 | £712,364 | £2,471,742 | £1,337,682 | £978,042 | £555,545 |
| 2024-11 | £703,844 | £2,442,497 | £1,322,995 | £965,885 | £548,978 |
| 2024-12 | £705,690 | £2,430,223 | £1,320,864 | £968,178 | £550,716 |
| 2025-01 | £711,367 | £2,445,363 | £1,334,715 | £979,105 | £554,265 |
| 2025-02 | £721,184 | £2,477,751 | £1,350,205 | £992,376 | £562,023 |
| 2025-03 | £704,636 | £2,376,520 | £1,302,945 | £963,849 | £551,036 |
| 2025-04 | £707,861 | £2,415,432 | £1,324,266 | £971,799 | £552,267 |
| 2025-05 | £703,336 | £2,420,431 | £1,325,377 | £968,702 | £547,710 |
| 2025-06 | £712,868 | £2,500,368 | £1,364,405 | £990,872 | £552,332 |
| 2025-07 | £717,784 | £2,486,335 | £1,362,361 | £999,360 | £556,194 |
| 2025-08 | £716,490 | £2,462,153 | £1,361,616 | £1,003,374 | £553,954 |
| 2025-09 | £716,678 | £2,471,595 | £1,368,794 | £1,009,469 | £552,619 |
| 2025-10 | £702,769 | £2,447,311 | £1,350,460 | £991,342 | £541,271 |
| 2025-11 | £700,066 | £2,451,938 | £1,346,622 | £987,201 | £539,171 |
| 2025-12 | £691,849 | £2,420,155 | £1,328,118 | £972,882 | £533,514 |
| 2026-01 | £690,509 | £2,432,557 | £1,332,617 | £974,935 | £531,392 |
| 2026-02 | £676,493 | £2,377,622 | £1,305,776 | £955,363 | £520,515 |
| 2026-03 | £672,069 | £2,333,195 | £1,293,760 | £952,204 | £516,555 |
- All property types
- Detached
- Semi-detached
- Terraced
- Flats
Source: HM Land Registry House Price Index
| Year | All property types | Detached | Semi-detached | Terraced | Flats |
|---|---|---|---|---|---|
| 1996-01 | +0.6% | -2.5% | +0.3% | +0.8% | +0.7% |
| 1996-02 | +0.5% | -1.4% | +0.3% | +0.6% | +0.6% |
| 1996-03 | +3.8% | +3.3% | +4.1% | +4.0% | +3.7% |
| 1996-04 | +3.9% | +3.9% | +4.0% | +3.9% | +3.8% |
| 1996-05 | +5.8% | +5.6% | +5.6% | +6.2% | +5.5% |
| 1996-06 | +4.5% | +3.9% | +4.1% | +5.0% | +4.1% |
| 1996-07 | +3.8% | +3.8% | +3.8% | +4.2% | +3.3% |
| 1996-08 | +5.1% | +6.1% | +5.7% | +5.6% | +4.6% |
| 1996-09 | +3.9% | +4.0% | +4.1% | +4.2% | +3.7% |
| 1996-10 | +4.5% | +4.6% | +4.7% | +5.2% | +3.9% |
| 1996-11 | +3.9% | +3.9% | +4.2% | +5.0% | +2.9% |
| 1996-12 | +6.2% | +6.5% | +6.7% | +7.6% | +4.8% |
| 1997-01 | +7.5% | +8.0% | +8.2% | +9.0% | +5.9% |
| 1997-02 | +11.1% | +12.3% | +11.7% | +12.4% | +9.8% |
| 1997-03 | +11.9% | +12.7% | +12.1% | +13.2% | +10.6% |
| 1997-04 | +14.2% | +16.1% | +15.3% | +15.7% | +12.6% |
| 1997-05 | +16.1% | +18.5% | +18.1% | +17.4% | +14.4% |
| 1997-06 | +18.7% | +23.2% | +21.9% | +20.4% | +16.5% |
| 1997-07 | +21.3% | +24.4% | +23.8% | +23.3% | +19.3% |
| 1997-08 | +18.1% | +19.7% | +19.8% | +20.0% | +16.2% |
| 1997-09 | +19.5% | +20.8% | +21.4% | +21.3% | +17.7% |
| 1997-10 | +19.2% | +20.8% | +21.2% | +20.7% | +17.7% |
| 1997-11 | +23.8% | +26.9% | +26.4% | +25.4% | +22.1% |
| 1997-12 | +23.4% | +26.2% | +25.8% | +24.8% | +21.9% |
| 1998-01 | +24.6% | +28.8% | +27.2% | +25.8% | +23.1% |
| 1998-02 | +20.2% | +22.8% | +22.1% | +21.3% | +19.0% |
| 1998-03 | +20.2% | +21.9% | +22.0% | +21.3% | +19.0% |
| 1998-04 | +20.5% | +21.4% | +22.2% | +21.8% | +19.2% |
| 1998-05 | +20.3% | +20.8% | +21.5% | +22.0% | +18.9% |
| 1998-06 | +15.4% | +15.0% | +15.7% | +16.6% | +14.6% |
| 1998-07 | +11.4% | +11.1% | +11.6% | +12.1% | +10.9% |
| 1998-08 | +12.7% | +13.5% | +13.3% | +13.3% | +12.2% |
| 1998-09 | +14.8% | +16.9% | +15.8% | +15.5% | +14.1% |
| 1998-10 | +14.3% | +15.1% | +14.5% | +14.8% | +13.8% |
| 1998-11 | +11.9% | +11.6% | +11.8% | +12.0% | +11.8% |
| 1998-12 | +8.9% | +8.2% | +8.5% | +8.7% | +8.9% |
| 1999-01 | +5.9% | +5.6% | +5.8% | +5.6% | +6.0% |
| 1999-02 | +3.3% | +4.4% | +4.0% | +3.5% | +3.1% |
| 1999-03 | +4.7% | +6.1% | +5.3% | +4.6% | +4.7% |
| 1999-04 | +5.0% | +6.3% | +5.1% | +4.9% | +5.0% |
| 1999-05 | +9.0% | +9.2% | +8.6% | +8.4% | +9.4% |
| 1999-06 | +13.5% | +14.0% | +13.5% | +13.5% | +13.5% |
| 1999-07 | +19.9% | +21.1% | +20.1% | +20.2% | +19.7% |
| 1999-08 | +24.2% | +24.9% | +24.4% | +24.9% | +23.7% |
| 1999-09 | +24.0% | +24.0% | +23.8% | +24.5% | +23.7% |
| 1999-10 | +25.9% | +26.1% | +25.9% | +26.4% | +25.6% |
| 1999-11 | +24.9% | +25.5% | +25.0% | +25.5% | +24.5% |
| 1999-12 | +28.0% | +28.2% | +27.7% | +28.5% | +27.8% |
| 2000-01 | +31.0% | +31.0% | +30.9% | +31.8% | +30.5% |
| 2000-02 | +38.6% | +37.6% | +37.8% | +39.1% | +38.3% |
| 2000-03 | +38.5% | +39.0% | +38.9% | +39.7% | +37.6% |
| 2000-04 | +40.2% | +40.0% | +39.9% | +40.7% | +39.7% |
| 2000-05 | +32.2% | +33.3% | +32.6% | +32.5% | +31.8% |
| 2000-06 | +30.9% | +30.5% | +30.5% | +30.2% | +31.2% |
| 2000-07 | +25.8% | +26.2% | +26.0% | +24.8% | +26.2% |
| 2000-08 | +24.6% | +24.4% | +24.4% | +22.7% | +25.6% |
| 2000-09 | +20.9% | +21.2% | +20.7% | +18.9% | +21.9% |
| 2000-10 | +16.9% | +17.2% | +16.7% | +15.1% | +17.8% |
| 2000-11 | +15.7% | +16.8% | +15.4% | +14.1% | +16.4% |
| 2000-12 | +16.1% | +17.4% | +16.2% | +14.7% | +16.6% |
| 2001-01 | +16.4% | +16.1% | +15.2% | +14.7% | +17.3% |
| 2001-02 | +15.0% | +14.5% | +14.2% | +13.6% | +15.7% |
| 2001-03 | +11.4% | +9.6% | +10.0% | +10.0% | +12.3% |
| 2001-04 | +8.7% | +7.6% | +7.9% | +7.7% | +9.3% |
| 2001-05 | +11.4% | +9.4% | +10.0% | +10.6% | +11.9% |
| 2001-06 | +10.9% | +8.9% | +9.3% | +10.0% | +11.5% |
| 2001-07 | +10.6% | +7.7% | +8.6% | +9.7% | +11.4% |
| 2001-08 | +6.9% | +3.9% | +4.6% | +6.1% | +7.5% |
| 2001-09 | +8.7% | +5.6% | +6.5% | +8.2% | +9.3% |
| 2001-10 | +12.4% | +9.5% | +10.4% | +12.0% | +12.9% |
| 2001-11 | +12.6% | +9.1% | +10.8% | +11.9% | +13.3% |
| 2001-12 | +12.3% | +8.8% | +10.4% | +11.1% | +13.2% |
| 2002-01 | +10.0% | +6.4% | +8.3% | +8.3% | +11.2% |
| 2002-02 | +8.1% | +4.6% | +5.9% | +6.2% | +9.3% |
| 2002-03 | +8.7% | +5.5% | +6.6% | +6.6% | +10.0% |
| 2002-04 | +11.7% | +8.0% | +9.1% | +9.0% | +13.5% |
| 2002-05 | +12.6% | +9.2% | +10.4% | +9.6% | +14.5% |
| 2002-06 | +14.5% | +10.6% | +12.0% | +11.7% | +16.4% |
| 2002-07 | +14.3% | +10.4% | +11.7% | +12.0% | +15.9% |
| 2002-08 | +17.3% | +13.2% | +14.7% | +15.1% | +18.8% |
| 2002-09 | +16.5% | +12.4% | +14.5% | +14.5% | +17.9% |
| 2002-10 | +15.5% | +11.1% | +13.5% | +13.3% | +16.9% |
| 2002-11 | +15.9% | +11.7% | +13.8% | +14.0% | +17.2% |
| 2002-12 | +15.4% | +11.5% | +13.6% | +13.8% | +16.5% |
| 2003-01 | +16.3% | +12.8% | +14.3% | +15.1% | +17.2% |
| 2003-02 | +17.2% | +13.3% | +15.5% | +15.7% | +18.2% |
| 2003-03 | +16.3% | +12.6% | +14.0% | +14.4% | +17.6% |
| 2003-04 | +11.8% | +8.5% | +10.2% | +9.9% | +13.0% |
| 2003-05 | +9.4% | +6.8% | +7.9% | +8.0% | +10.5% |
| 2003-06 | +5.6% | +3.4% | +5.0% | +4.6% | +6.2% |
| 2003-07 | +5.8% | +3.3% | +5.2% | +4.8% | +6.4% |
| 2003-08 | +4.6% | +2.3% | +4.3% | +3.8% | +5.1% |
| 2003-09 | +6.0% | +3.5% | +5.6% | +5.3% | +6.6% |
| 2003-10 | +6.4% | +3.9% | +5.5% | +6.0% | +6.8% |
| 2003-11 | +4.9% | +1.8% | +4.1% | +4.7% | +5.2% |
| 2003-12 | +4.8% | +1.4% | +3.6% | +4.8% | +5.0% |
| 2004-01 | +3.7% | +1.2% | +3.3% | +3.6% | +3.8% |
| 2004-02 | +3.7% | +2.8% | +3.5% | +3.8% | +3.6% |
| 2004-03 | +5.3% | +3.9% | +5.3% | +5.8% | +5.1% |
| 2004-04 | +6.5% | +4.6% | +6.5% | +7.8% | +5.9% |
| 2004-05 | +6.1% | +2.4% | +5.4% | +7.3% | +5.6% |
| 2004-06 | +8.8% | +5.4% | +8.1% | +9.8% | +8.5% |
| 2004-07 | +10.4% | +7.1% | +9.7% | +11.0% | +10.1% |
| 2004-08 | +10.6% | +8.2% | +10.2% | +11.2% | +10.3% |
| 2004-09 | +8.7% | +6.9% | +8.3% | +9.2% | +8.5% |
| 2004-10 | +7.6% | +5.7% | +6.9% | +7.8% | +7.6% |
| 2004-11 | +8.7% | +6.9% | +7.7% | +8.8% | +8.8% |
| 2004-12 | +6.4% | +4.6% | +5.2% | +6.5% | +6.5% |
| 2005-01 | +7.5% | +5.1% | +6.1% | +7.9% | +7.5% |
| 2005-02 | +8.2% | +5.8% | +7.3% | +8.8% | +8.1% |
| 2005-03 | +8.3% | +5.9% | +7.9% | +9.1% | +8.0% |
| 2005-04 | +8.7% | +6.8% | +8.7% | +9.2% | +8.5% |
| 2005-05 | +7.0% | +6.1% | +7.0% | +7.5% | +6.9% |
| 2005-06 | +4.5% | +3.9% | +4.6% | +5.3% | +4.2% |
| 2005-07 | +2.8% | +2.2% | +2.8% | +3.5% | +2.5% |
| 2005-08 | +2.3% | +1.3% | +2.2% | +3.2% | +2.0% |
| 2005-09 | +1.6% | +0.5% | +1.3% | +2.2% | +1.3% |
| 2005-10 | +0.5% | -0.3% | +0.5% | +1.4% | 0.0% |
| 2005-11 | +1.3% | +0.6% | +1.6% | +2.4% | +0.8% |
| 2005-12 | +3.7% | +3.0% | +4.2% | +4.9% | +3.2% |
| 2006-01 | +3.7% | +3.3% | +4.4% | +4.9% | +3.2% |
| 2006-02 | +2.6% | +1.9% | +2.7% | +3.6% | +2.2% |
| 2006-03 | +3.9% | +4.3% | +4.3% | +5.0% | +3.4% |
| 2006-04 | +4.3% | +4.8% | +4.3% | +5.4% | +3.7% |
| 2006-05 | +6.7% | +9.0% | +7.6% | +7.9% | +6.0% |
| 2006-06 | +8.5% | +11.0% | +9.5% | +9.5% | +7.9% |
| 2006-07 | +9.8% | +12.3% | +10.9% | +11.1% | +9.1% |
| 2006-08 | +10.7% | +12.1% | +11.7% | +12.3% | +9.9% |
| 2006-09 | +12.4% | +13.3% | +13.4% | +14.2% | +11.5% |
| 2006-10 | +15.7% | +16.9% | +16.8% | +17.3% | +14.8% |
| 2006-11 | +16.3% | +17.9% | +17.6% | +17.8% | +15.5% |
| 2006-12 | +18.2% | +21.1% | +20.1% | +20.0% | +17.2% |
| 2007-01 | +18.5% | +21.3% | +20.4% | +20.1% | +17.5% |
| 2007-02 | +21.3% | +24.2% | +23.0% | +22.4% | +20.5% |
| 2007-03 | +18.0% | +19.4% | +19.0% | +18.9% | +17.5% |
| 2007-04 | +20.0% | +21.7% | +21.1% | +21.2% | +19.4% |
| 2007-05 | +19.8% | +20.3% | +20.4% | +21.3% | +19.1% |
| 2007-06 | +19.7% | +20.3% | +20.1% | +21.1% | +19.1% |
| 2007-07 | +19.4% | +20.5% | +19.9% | +20.5% | +18.9% |
| 2007-08 | +20.5% | +22.8% | +21.5% | +21.6% | +19.9% |
| 2007-09 | +21.4% | +24.3% | +22.6% | +22.2% | +20.9% |
| 2007-10 | +21.2% | +23.4% | +22.0% | +22.0% | +20.8% |
| 2007-11 | +20.0% | +23.3% | +20.6% | +20.4% | +19.7% |
| 2007-12 | +16.1% | +18.3% | +16.2% | +16.4% | +15.9% |
| 2008-01 | +13.1% | +15.7% | +13.2% | +13.1% | +13.0% |
| 2008-02 | +8.7% | +10.5% | +9.1% | +9.2% | +8.4% |
| 2008-03 | +9.6% | +11.6% | +10.3% | +10.3% | +9.3% |
| 2008-04 | +4.4% | +6.1% | +5.4% | +5.0% | +4.1% |
| 2008-05 | +2.5% | +4.9% | +3.9% | +3.1% | +2.1% |
| 2008-06 | -0.5% | +2.2% | +1.1% | +0.3% | -0.9% |
| 2008-07 | -2.7% | -0.2% | -1.1% | -2.0% | -3.1% |
| 2008-08 | -8.2% | -6.1% | -7.1% | -8.0% | -8.4% |
| 2008-09 | -9.0% | -7.5% | -8.5% | -9.1% | -9.0% |
| 2008-10 | -11.3% | -10.0% | -10.7% | -11.3% | -11.3% |
| 2008-11 | -11.8% | -11.4% | -11.4% | -11.6% | -11.9% |
| 2008-12 | -15.8% | -14.7% | -14.7% | -15.2% | -16.1% |
| 2009-01 | -16.3% | -14.7% | -15.2% | -15.7% | -16.6% |
| 2009-02 | -15.0% | -13.4% | -14.2% | -14.6% | -15.2% |
| 2009-03 | -15.0% | -13.8% | -14.8% | -15.1% | -15.0% |
| 2009-04 | -13.8% | -14.4% | -14.2% | -14.0% | -13.7% |
| 2009-05 | -12.1% | -13.2% | -12.6% | -12.1% | -12.1% |
| 2009-06 | -6.5% | -8.6% | -7.2% | -6.1% | -6.8% |
| 2009-07 | -4.0% | -5.3% | -4.2% | -3.0% | -4.7% |
| 2009-08 | -1.5% | -2.4% | -1.5% | -0.2% | -2.4% |
| 2009-09 | -2.5% | -3.0% | -1.7% | -0.6% | -3.7% |
| 2009-10 | +0.9% | +1.6% | +2.6% | +3.2% | -0.6% |
| 2009-11 | +3.6% | +4.6% | +5.5% | +6.4% | +1.8% |
| 2009-12 | +9.0% | +9.9% | +10.9% | +11.9% | +7.1% |
| 2010-01 | +11.5% | +11.0% | +13.5% | +15.3% | +9.2% |
| 2010-02 | +14.7% | +15.1% | +17.9% | +19.3% | +11.8% |
| 2010-03 | +15.2% | +16.7% | +19.0% | +20.3% | +12.2% |
| 2010-04 | +17.1% | +21.2% | +21.5% | +21.8% | +14.1% |
| 2010-05 | +15.2% | +19.5% | +18.9% | +18.9% | +12.9% |
| 2010-06 | +11.7% | +16.4% | +15.5% | +15.0% | +9.5% |
| 2010-07 | +10.5% | +15.0% | +13.8% | +13.5% | +8.5% |
| 2010-08 | +10.6% | +14.2% | +13.9% | +13.7% | +8.5% |
| 2010-09 | +8.8% | +12.4% | +11.8% | +11.9% | +6.9% |
| 2010-10 | +5.2% | +7.3% | +7.5% | +7.9% | +3.5% |
| 2010-11 | +0.4% | +2.7% | +2.6% | +2.3% | -0.8% |
| 2010-12 | +1.3% | +3.7% | +3.5% | +2.9% | +0.2% |
| 2011-01 | +3.0% | +6.9% | +5.6% | +4.1% | +2.1% |
| 2011-02 | +2.3% | +6.9% | +4.3% | +2.8% | +1.7% |
| 2011-03 | +2.8% | +8.3% | +4.9% | +3.3% | +2.2% |
| 2011-04 | +2.0% | +7.1% | +3.8% | +2.5% | +1.4% |
| 2011-05 | +3.1% | +6.5% | +4.6% | +3.8% | +2.5% |
| 2011-06 | +1.9% | +3.1% | +2.6% | +2.2% | +1.7% |
| 2011-07 | -0.2% | -1.1% | -0.3% | -0.4% | -0.1% |
| 2011-08 | +2.1% | +2.8% | +2.7% | +2.1% | +2.0% |
| 2011-09 | +3.0% | +4.3% | +3.9% | +3.1% | +2.8% |
| 2011-10 | +4.3% | +7.4% | +6.1% | +4.8% | +3.9% |
| 2011-11 | +6.2% | +8.9% | +8.0% | +6.7% | +5.8% |
| 2011-12 | +7.6% | +9.3% | +8.8% | +7.9% | +7.3% |
| 2012-01 | +8.5% | +8.5% | +9.3% | +9.0% | +8.1% |
| 2012-02 | +4.3% | +4.1% | +5.3% | +5.5% | +3.6% |
| 2012-03 | +1.5% | +0.5% | +2.4% | +2.7% | +0.9% |
| 2012-04 | -0.5% | -1.3% | +0.2% | +0.6% | -1.0% |
| 2012-05 | +2.5% | +1.7% | +3.1% | +3.3% | +2.0% |
| 2012-06 | +4.2% | +5.1% | +5.3% | +5.6% | +3.3% |
| 2012-07 | +8.3% | +10.8% | +10.2% | +10.2% | +7.1% |
| 2012-08 | +7.8% | +9.0% | +9.0% | +9.6% | +6.7% |
| 2012-09 | +9.4% | +9.6% | +10.1% | +10.8% | +8.6% |
| 2012-10 | +8.3% | +7.0% | +8.0% | +9.5% | +7.8% |
| 2012-11 | +8.9% | +7.6% | +8.6% | +10.3% | +8.1% |
| 2012-12 | +8.8% | +8.8% | +9.2% | +10.7% | +7.7% |
| 2013-01 | +7.9% | +9.2% | +8.9% | +9.5% | +6.9% |
| 2013-02 | +12.3% | +13.5% | +13.1% | +13.3% | +11.7% |
| 2013-03 | +11.6% | +12.3% | +11.9% | +12.2% | +11.3% |
| 2013-04 | +14.6% | +15.0% | +14.6% | +15.6% | +14.0% |
| 2013-05 | +9.1% | +11.0% | +9.9% | +10.4% | +8.3% |
| 2013-06 | +9.4% | +11.8% | +10.5% | +10.5% | +8.7% |
| 2013-07 | +7.9% | +9.4% | +8.6% | +8.8% | +7.4% |
| 2013-08 | +9.5% | +10.6% | +9.8% | +10.3% | +9.1% |
| 2013-09 | +12.8% | +14.0% | +13.0% | +13.4% | +12.5% |
| 2013-10 | +14.3% | +15.8% | +14.5% | +14.7% | +14.0% |
| 2013-11 | +16.2% | +17.1% | +16.0% | +16.3% | +16.1% |
| 2013-12 | +15.1% | +14.3% | +14.3% | +14.9% | +15.2% |
| 2014-01 | +15.8% | +14.5% | +14.4% | +15.4% | +16.1% |
| 2014-02 | +15.6% | +14.3% | +14.0% | +15.2% | +15.9% |
| 2014-03 | +18.9% | +17.8% | +17.7% | +18.8% | +19.0% |
| 2014-04 | +20.0% | +19.6% | +19.7% | +20.0% | +20.0% |
| 2014-05 | +23.4% | +22.7% | +23.0% | +23.6% | +23.4% |
| 2014-06 | +24.1% | +22.8% | +23.2% | +24.1% | +24.3% |
| 2014-07 | +23.8% | +22.3% | +22.6% | +23.8% | +24.0% |
| 2014-08 | +22.6% | +21.6% | +21.6% | +22.5% | +22.9% |
| 2014-09 | +17.7% | +17.1% | +17.3% | +18.0% | +17.8% |
| 2014-10 | +17.8% | +17.5% | +17.6% | +17.9% | +17.9% |
| 2014-11 | +14.8% | +14.9% | +14.8% | +15.0% | +14.7% |
| 2014-12 | +14.5% | +15.4% | +14.6% | +14.5% | +14.4% |
| 2015-01 | +11.4% | +11.7% | +11.4% | +11.6% | +11.3% |
| 2015-02 | +10.2% | +10.1% | +10.4% | +10.4% | +10.0% |
| 2015-03 | +8.6% | +8.2% | +8.8% | +8.8% | +8.5% |
| 2015-04 | +6.1% | +5.8% | +6.1% | +6.1% | +6.1% |
| 2015-05 | +2.5% | +2.3% | +2.3% | +2.4% | +2.6% |
| 2015-06 | 0.0% | +0.6% | +0.3% | +0.3% | -0.1% |
| 2015-07 | +0.8% | +1.4% | +1.3% | +0.9% | +0.7% |
| 2015-08 | +1.9% | +2.2% | +2.2% | +2.0% | +1.8% |
| 2015-09 | +3.3% | +3.5% | +3.1% | +3.2% | +3.4% |
| 2015-10 | +4.6% | +4.8% | +4.2% | +4.7% | +4.7% |
| 2015-11 | +7.0% | +7.6% | +7.0% | +7.3% | +6.9% |
| 2015-12 | +7.2% | +7.9% | +7.6% | +7.7% | +7.0% |
| 2016-01 | +7.7% | +8.5% | +8.5% | +8.3% | +7.4% |
| 2016-02 | +6.0% | +6.8% | +6.7% | +6.6% | +5.7% |
| 2016-03 | +7.3% | +8.6% | +7.9% | +7.9% | +7.0% |
| 2016-04 | +7.6% | +7.9% | +7.7% | +8.1% | +7.4% |
| 2016-05 | +10.2% | +9.2% | +9.4% | +10.3% | +10.3% |
| 2016-06 | +9.6% | +7.3% | +7.9% | +8.7% | +10.0% |
| 2016-07 | +8.0% | +6.2% | +6.5% | +7.2% | +8.4% |
| 2016-08 | +4.4% | +3.1% | +3.2% | +3.4% | +4.9% |
| 2016-09 | +3.9% | +1.9% | +2.8% | +3.2% | +4.3% |
| 2016-10 | +4.2% | +1.9% | +3.0% | +2.9% | +4.7% |
| 2016-11 | +3.7% | +1.5% | +2.5% | +2.3% | +4.4% |
| 2016-12 | +3.6% | +1.8% | +2.0% | +1.8% | +4.3% |
| 2017-01 | +1.2% | -0.8% | -1.1% | -0.6% | +2.0% |
| 2017-02 | +2.3% | -0.3% | -0.7% | +0.1% | +3.4% |
| 2017-03 | +3.4% | +0.5% | +0.2% | +0.9% | +4.5% |
| 2017-04 | +4.4% | +3.0% | +2.2% | +1.9% | +5.5% |
| 2017-05 | +2.6% | +2.8% | +1.6% | +0.5% | +3.5% |
| 2017-06 | +1.7% | +2.3% | +1.0% | -0.1% | +2.5% |
| 2017-07 | +1.6% | +1.3% | +0.6% | -0.3% | +2.5% |
| 2017-08 | +3.9% | +3.8% | +3.2% | +2.4% | +4.6% |
| 2017-09 | +2.2% | +2.9% | +1.8% | +0.8% | +2.8% |
| 2017-10 | -0.5% | +1.2% | 0.0% | -1.0% | -0.4% |
| 2017-11 | -1.7% | -0.9% | -1.5% | -2.0% | -1.6% |
| 2017-12 | -3.0% | -2.2% | -2.5% | -2.9% | -3.0% |
| 2018-01 | -1.6% | -1.2% | -1.0% | -1.7% | -1.6% |
| 2018-02 | -2.1% | -0.9% | -1.0% | -2.0% | -2.3% |
| 2018-03 | -4.8% | -4.8% | -3.7% | -4.3% | -5.0% |
| 2018-04 | -5.7% | -6.2% | -4.6% | -4.5% | -6.1% |
| 2018-05 | -5.8% | -5.7% | -4.0% | -3.7% | -6.5% |
| 2018-06 | -3.3% | -1.7% | -0.7% | -1.1% | -4.1% |
| 2018-07 | -4.0% | -0.4% | -0.8% | -1.7% | -4.9% |
| 2018-08 | -4.4% | -1.5% | -2.1% | -2.8% | -5.0% |
| 2018-09 | -3.9% | -1.4% | -1.8% | -2.1% | -4.5% |
| 2018-10 | -2.5% | -1.8% | -1.3% | -1.4% | -2.9% |
| 2018-11 | -2.7% | -0.5% | -0.6% | -1.1% | -3.3% |
| 2018-12 | -0.2% | +2.0% | +1.6% | +0.8% | -0.6% |
| 2019-01 | -1.1% | +2.1% | +1.3% | +0.3% | -1.6% |
| 2019-02 | -2.6% | -0.2% | -0.7% | -1.5% | -3.0% |
| 2019-03 | -3.4% | -0.2% | -1.2% | -2.0% | -3.9% |
| 2019-04 | -2.8% | +0.1% | -0.9% | -1.6% | -3.4% |
| 2019-05 | -2.3% | -0.5% | -1.0% | -1.4% | -2.8% |
| 2019-06 | -4.1% | -3.4% | -3.4% | -3.1% | -4.6% |
| 2019-07 | -2.3% | -3.5% | -2.2% | -1.6% | -2.6% |
| 2019-08 | -2.6% | -3.0% | -2.0% | -1.4% | -3.2% |
| 2019-09 | +0.1% | +0.2% | +0.6% | +1.1% | -0.4% |
| 2019-10 | -0.1% | +2.2% | +1.5% | +1.3% | -0.8% |
| 2019-11 | +2.2% | +3.1% | +3.3% | +3.1% | +1.7% |
| 2019-12 | +1.5% | +2.0% | +3.0% | +3.0% | +0.9% |
| 2020-01 | +3.0% | +2.7% | +4.1% | +4.5% | +2.4% |
| 2020-02 | +5.2% | +6.6% | +7.2% | +7.4% | +4.2% |
| 2020-03 | +6.6% | +9.2% | +9.0% | +8.5% | +5.6% |
| 2020-04 | +5.7% | +10.0% | +8.7% | +7.9% | +4.7% |
| 2020-05 | +4.8% | +9.1% | +7.2% | +5.9% | +4.2% |
| 2020-06 | +3.0% | +6.1% | +5.2% | +4.3% | +2.3% |
| 2020-07 | +1.7% | +4.3% | +3.8% | +3.1% | +1.0% |
| 2020-08 | +3.4% | +5.7% | +5.9% | +5.4% | +2.4% |
| 2020-09 | +4.3% | +7.5% | +7.6% | +6.7% | +3.2% |
| 2020-10 | +4.6% | +6.6% | +7.4% | +7.5% | +3.2% |
| 2020-11 | +3.0% | +5.3% | +5.6% | +6.3% | +1.5% |
| 2020-12 | +0.3% | +2.8% | +2.6% | +3.8% | -1.2% |
| 2021-01 | -0.6% | +2.0% | +1.4% | +2.2% | -1.8% |
| 2021-02 | -3.9% | -3.4% | -3.1% | -2.2% | -4.7% |
| 2021-03 | -4.7% | -6.4% | -5.3% | -3.9% | -5.0% |
| 2021-04 | -6.4% | -9.4% | -7.6% | -6.3% | -6.3% |
| 2021-05 | -5.0% | -7.4% | -5.8% | -4.4% | -5.1% |
| 2021-06 | -2.2% | -3.6% | -3.0% | -1.6% | -2.4% |
| 2021-07 | -0.9% | 0.0% | -1.0% | -0.3% | -1.2% |
| 2021-08 | -1.2% | +1.3% | -0.7% | -1.0% | -1.4% |
| 2021-09 | -3.2% | -0.7% | -2.5% | -3.4% | -3.3% |
| 2021-10 | -2.3% | +1.2% | -0.9% | -2.7% | -2.3% |
| 2021-11 | -1.2% | +2.6% | +0.4% | -1.9% | -1.1% |
| 2021-12 | +1.0% | +5.8% | +3.2% | +0.4% | +0.9% |
| 2022-01 | +2.7% | +7.7% | +5.6% | +3.0% | +2.2% |
| 2022-02 | +6.4% | +11.4% | +9.6% | +7.2% | +5.7% |
| 2022-03 | +9.1% | +16.7% | +13.8% | +10.7% | +8.1% |
| 2022-04 | +12.7% | +20.4% | +17.5% | +14.6% | +11.4% |
| 2022-05 | +11.0% | +19.7% | +16.5% | +13.4% | +9.4% |
| 2022-06 | +10.1% | +17.7% | +15.2% | +12.2% | +8.8% |
| 2022-07 | +8.5% | +14.2% | +13.3% | +11.0% | +7.0% |
| 2022-08 | +8.2% | +11.0% | +11.5% | +10.6% | +6.9% |
| 2022-09 | +8.1% | +10.6% | +11.2% | +11.1% | +6.5% |
| 2022-10 | +9.4% | +10.9% | +11.4% | +12.0% | +8.0% |
| 2022-11 | +8.3% | +10.3% | +10.3% | +10.8% | +6.9% |
| 2022-12 | +6.7% | +7.1% | +7.7% | +8.6% | +5.8% |
| 2023-01 | +2.8% | +3.6% | +3.9% | +4.1% | +2.0% |
| 2023-02 | +1.0% | +1.8% | +2.3% | +2.2% | +0.3% |
| 2023-03 | -2.9% | -2.3% | -1.8% | -1.9% | -3.5% |
| 2023-04 | -6.1% | -5.3% | -4.9% | -5.3% | -6.5% |
| 2023-05 | -5.0% | -5.7% | -4.6% | -4.8% | -5.1% |
| 2023-06 | -4.4% | -4.2% | -3.5% | -3.8% | -4.8% |
| 2023-07 | -4.1% | -3.5% | -3.2% | -3.4% | -4.5% |
| 2023-08 | -6.7% | -4.8% | -5.4% | -6.0% | -7.3% |
| 2023-09 | -5.2% | -4.8% | -4.6% | -4.8% | -5.4% |
| 2023-10 | -5.5% | -6.2% | -5.3% | -5.5% | -5.6% |
| 2023-11 | -2.7% | -3.8% | -2.5% | -2.8% | -2.6% |
| 2023-12 | -2.8% | -4.1% | -2.6% | -3.0% | -2.7% |
| 2024-01 | -1.5% | -3.1% | -1.7% | -1.6% | -1.5% |
| 2024-02 | -1.5% | -3.1% | -1.7% | -1.2% | -1.7% |
| 2024-03 | +2.1% | +0.9% | +1.7% | +2.6% | +1.9% |
| 2024-04 | +4.6% | +3.5% | +4.4% | +5.0% | +4.4% |
| 2024-05 | +4.4% | +3.9% | +4.1% | +4.7% | +4.2% |
| 2024-06 | +4.5% | +3.0% | +3.8% | +4.5% | +4.5% |
| 2024-07 | +4.9% | +3.4% | +4.2% | +5.1% | +4.9% |
| 2024-08 | +5.5% | +2.7% | +4.4% | +5.7% | +5.6% |
| 2024-09 | +1.7% | +0.6% | +1.5% | +2.2% | +1.6% |
| 2024-10 | -1.8% | -2.0% | -1.9% | -1.3% | -1.9% |
| 2024-11 | -4.9% | -5.0% | -4.8% | -4.1% | -5.2% |
| 2024-12 | -3.1% | -3.1% | -3.2% | -2.1% | -3.6% |
| 2025-01 | -0.8% | -0.9% | -0.5% | +0.4% | -1.4% |
| 2025-02 | +1.4% | +2.1% | +1.6% | +2.5% | +0.8% |
| 2025-03 | -2.4% | -4.4% | -3.4% | -1.7% | -2.6% |
| 2025-04 | -2.6% | -3.8% | -2.6% | -1.4% | -3.1% |
| 2025-05 | -3.4% | -3.8% | -2.5% | -1.7% | -4.2% |
| 2025-06 | -2.4% | -0.2% | +0.3% | 0.0% | -3.6% |
| 2025-07 | -2.8% | -1.9% | -1.1% | -0.8% | -3.8% |
| 2025-08 | -2.6% | -2.4% | -1.0% | -0.6% | -3.6% |
| 2025-09 | -1.6% | -2.2% | -0.2% | +0.7% | -2.5% |
| 2025-10 | -1.3% | -1.0% | +1.0% | +1.4% | -2.6% |
| 2025-11 | -0.5% | +0.4% | +1.8% | +2.2% | -1.8% |
| 2025-12 | -2.0% | -0.4% | +0.5% | +0.5% | -3.1% |
| 2026-01 | -2.9% | -0.5% | -0.2% | -0.4% | -4.1% |
| 2026-02 | -6.2% | -4.0% | -3.3% | -3.7% | -7.4% |
| 2026-03 | -4.6% | -1.8% | -0.7% | -1.2% | -6.3% |
Sold House Prices in Wandsworth
The average sold price across all property types in Wandsworth is £672,069, which is 131.8% above the England average of £289,946 as of March 2026. The premium is wide across every property type, and flats, the largest housing type in every postcode, carry the smallest premium of the four.
| Property Type | Wandsworth Average | England Average | Difference |
|---|---|---|---|
| Detached houses | £2,333,195 | £470,492 | +395.9% |
| Semi-detached houses | £1,293,760 | £288,185 | +348.9% |
| Terraced houses | £952,204 | £243,788 | +290.6% |
| Flats and maisonettes | £516,555 | £214,563 | +140.7% |
| All property types | £672,069 | £289,946 | +131.8% |
Detached houses at £2,333,195 sit almost 400% above England's £470,492, but the figure covers a tiny slice of the borough. Detached homes make up under 4% of stock in most Wandsworth postcodes and just 1.4% in SW8, so the average rests on a small share of the housing stock. Detached prices fell 1.8% over the past year.
Semi-detached houses at £1,293,760 are 348.9% above England's £288,185. Like detached stock, semis are thin on the ground in the denser northern postcodes and more common in Putney and Southfields. The -0.7% annual change is the mildest of the four types, so this end of the market has held up better than the flats that dominate the borough.
Terraced houses at £952,204 carry a 290.6% premium over England's £243,788, after a 1.2% fall over the past year. SW17 (Tooting) holds the borough's largest terrace share at 34.6% of its housing stock.
Flats and maisonettes at £516,555 show the smallest premium at 140.7% above England's £214,563, and flats are the largest housing type in every postcode. It is also the type that has softened most, with a -6.3% annual change. The Nine Elms and Battersea new-build boom added a large volume of flats to SW8 and SW11.
Price Per Square Foot in Wandsworth
Just £147 per square foot separates Wandsworth's cheapest postcode from its dearest, with SW15 (Putney, Roehampton) at £724 and SW11 (Battersea, Clapham Junction) at £871. Measuring by the square foot takes property size out of the comparison. SW11 tops the table and SW15 sits at the bottom.
| Rank | Area | Price Per Sq Ft |
|---|---|---|
| 1 | SW15 (Putney, Roehampton) | £724 |
| 2 | SW17 (Tooting) | £730 |
| 3 | SW19 (Southfields, Wimbledon) | £745 |
| 4 | SW18 (Wandsworth Town, Earlsfield) | £800 |
| 5 | SW4 (Clapham) | £818 |
| 6 | SW8 (Nine Elms, South Lambeth) | £836 |
| 7 | SW12 (Balham) | £844 |
| 8 | SW11 (Battersea, Clapham Junction) | £871 |
SW15 at £724 per square foot is the cheapest space in the borough, based on 902 transactions analysed. Putney and Roehampton stretch from riverside apartments down to the large estates around Richmond Park.
SW11 at £871 per square foot costs £147 more for each square foot than SW15, drawn from 1,107 transactions, so the gap holds even after allowing for property size. What else sits behind it, whether property type, condition or position, is not something these figures separate.
For Sale Asking Prices in Wandsworth
SW17 (Tooting) at £590,300 and SW11 (Battersea, Clapham Junction) at £787,182 sit 33.4% apart, the full range of asking prices across the eight postcodes. The mean asking price across the borough is £663,635. Unlike many cities, Wandsworth has no genuinely cheap corner: even the lowest postcode asks close to £600,000.
| Rank | Area | Asking Price |
|---|---|---|
| 1 | SW17 (Tooting) | £590,300 |
| 2 | SW19 (Southfields, Wimbledon) | £609,057 |
| 3 | SW4 (Clapham) | £609,116 |
| 4 | SW18 (Wandsworth Town, Earlsfield) | £615,050 |
| 5 | SW15 (Putney, Roehampton) | £622,115 |
| 6 | SW12 (Balham) | £709,363 |
| 7 | SW8 (Nine Elms, South Lambeth) | £766,900 |
| 8 | SW11 (Battersea, Clapham Junction) | £787,182 |
SW17 at £590,300 is the lowest asking price in the borough, and it sits below the borough-wide sold-price average of £672,069. Tooting has become one of the busier residential centres in south London, with Northern line stops and a lively high street, and its asking prices still trail Balham next door.
SW11 at £787,182 is the most expensive, £196,882 above SW17. SW8 (Nine Elms, South Lambeth) is close behind at £766,900.
House Price Growth in Wandsworth
Two Wandsworth postcodes posted positive growth across all three timeframes: SW18 at 5.8% (one-year), 4.1% (three-year) and 6.3% (five-year), and SW17 at 2.8%, 3.1% and 1.8%. The rest of the borough is mixed, and SW8 (Nine Elms) shows the widest swings of any postcode.
| Area | 1 Year | 3 Years | 5 Years |
|---|---|---|---|
| SW18 (Wandsworth Town, Earlsfield) | 5.8% | 4.1% | 6.3% |
| SW17 (Tooting) | 2.8% | 3.1% | 1.8% |
| SW11 (Battersea, Clapham Junction) | -4.3% | -16.6% | 1.3% |
| SW8 (Nine Elms, South Lambeth) | 9.4% | -34.4% | 1.1% |
| SW4 (Clapham) | -1.9% | -1.5% | 0.5% |
| SW19 (Southfields, Wimbledon) | -1.6% | -3.1% | -1.9% |
| SW12 (Balham) | 0.7% | -5.8% | -2.1% |
| SW15 (Putney, Roehampton) | -4.5% | -11.6% | -9.0% |
SW18 at 6.3% over five years posted the highest five-year growth in the borough and is positive across one, three and five years. Wandsworth Town and Earlsfield are mid-market family territory, with Victorian terraces, direct trains to Waterloo and the Southside centre at the heart of the town. That is the house-heavier, mid-market end of the borough.
SW8's -34.4% over three years is the sharpest fall in the borough, sitting oddly next to a +9.4% one-year reading. A postcode average moves with the mix of what sells in each period, so the two readings are not a measured trend for any one home. SW15 (Putney, Roehampton) is the weakest over the longer run at -9.0% over five years, and it is one of two postcodes down across all three windows, with SW19 (Southfields, Wimbledon) the other at -1.6%, -3.1% and -1.9%.
Monthly Property Sales in Wandsworth
Monthly sales run from 18 transactions in SW8 to 57 in SW18, with turnover rates from 3% in SW8 and SW11 up to 9% in SW12. The busiest postcode by volume, SW18, is also the one with the highest five-year growth, while the two Nine Elms and Battersea postcodes turn over the smallest share of their for-sale stock. Turnover here is each month's sales measured against the homes currently on the market, not against every home in the postcode.
| Area | Sales Per Month | Turnover | Asking Price |
|---|---|---|---|
| SW18 (Wandsworth Town, Earlsfield) | 57 | 7% | £615,050 |
| SW11 (Battersea, Clapham Junction) | 52 | 3% | £787,182 |
| SW19 (Southfields, Wimbledon) | 48 | 5% | £609,057 |
| SW17 (Tooting) | 44 | 6% | £590,300 |
| SW15 (Putney, Roehampton) | 41 | 6% | £622,115 |
| SW12 (Balham) | 27 | 9% | £709,363 |
| SW4 (Clapham) | 24 | 5% | £609,116 |
| SW8 (Nine Elms, South Lambeth) | 18 | 3% | £766,900 |
SW12 (Balham) has the highest turnover at 9% despite one of the lower monthly sales counts, because turnover measures each month's sales against the homes on the market at the time, and Balham has relatively few for sale. A high turnover means the for-sale stock is being worked through faster relative to its size.
SW8 and SW11 share the lowest turnover at 3%. Both carry a large for-sale stock against monthly sales that do not keep pace, so a small proportion of the listed stock sells in any given month.
How Long Properties Take to Sell in Wandsworth
Wandsworth's homes take a long time to sell: SW12 (Balham) has the least unsold stock at around 11 months' worth, while SW11 (Battersea) and SW8 (Nine Elms) sit at over 33 months at the current rate of sale. Months of unsold stock is how many months of homes are on the market at the current pace of sales, an estimate of how long the for-sale supply takes to clear rather than a measured time from listing to completion for any particular home.
| Area | Months of Unsold Stock | Sales Per Month | Market |
|---|---|---|---|
| SW12 (Balham) | 11.1 | 28 | Balanced market |
| SW18 (Wandsworth Town, Earlsfield) | 14.3 | 60 | Buyer's market |
| SW15 (Putney, Roehampton) | 16.7 | 41 | Buyer's market |
| SW17 (Tooting) | 16.7 | 44 | Buyer's market |
| SW19 (Southfields, Wimbledon) | 16.7 | 51 | Buyer's market |
| SW4 (Clapham) | 20.0 | 26 | Buyer's market |
| SW11 (Battersea, Clapham Junction) | 33.3 | 54 | Buyer's market |
| SW8 (Nine Elms, South Lambeth) | 33.3 | 19 | Buyer's market |
How much stock sits ahead of yours when you come to sell is a cost a yield figure never shows. SW11 and SW8 hold around 33 months of unsold stock, three times SW12's 11.1, so a seller in Battersea or Nine Elms is competing with far more listings for each buyer. SW12 and SW18 carry the least unsold stock against their monthly sales.
What Type of Property Can You Buy in Wandsworth?
Flats are the largest category in every Wandsworth postcode, from 45.4% of stock in SW15 (Putney, Roehampton) up to 82.7% in SW8 (Nine Elms). This is a flat borough. The shares quoted here and in the table are the housing-type breakdown a commercial property-data provider reports for each postcode, which it describes as Census-based. The Census release and the areas behind each figure are not specified in the data we hold, so read the percentages as the provider's reported figures rather than verified proportions of all the homes in the postcode.
| Area | Detached | Semi-detached | Terraced | Flats |
|---|---|---|---|---|
| SW4 (Clapham) | 1.5% | 6.0% | 17.9% | 74.5% |
| SW8 (Nine Elms, South Lambeth) | 1.4% | 3.8% | 12.0% | 82.7% |
| SW11 (Battersea, Clapham Junction) | 1.5% | 5.0% | 17.8% | 75.4% |
| SW12 (Balham) | 2.5% | 10.1% | 22.8% | 64.6% |
| SW15 (Putney, Roehampton) | 16.4% | 14.8% | 23.3% | 45.4% |
| SW17 (Tooting) | 2.4% | 13.2% | 34.6% | 49.8% |
| SW18 (Wandsworth Town, Earlsfield) | 3.4% | 13.6% | 27.1% | 55.8% |
| SW19 (Southfields, Wimbledon) | 7.2% | 12.8% | 25.1% | 54.7% |
SW8 (Nine Elms) is the most flat-dominated postcode at 82.7%, with just 1.4% detached and 12.0% terraced. That is the imprint of the riverside towers, and it lines up with SW8's high asking prices and its low-turnover, heavily stocked resale market.
SW15 (Putney, Roehampton) has the most balanced mix, with 16.4% detached and the smallest flat share at 45.4%. It is also the postcode with the lowest per-square-foot cost in the borough. SW17 (Tooting) holds the most terraces at 34.6%, Victorian family stock, and it is one of the two postcodes with growth positive across one, three and five years.
Flats combine purpose-built and converted units. A small share of mobile and temporary dwellings is not shown, so rows may not total 100%.
Wandsworth Rental Market Analysis
Monthly rents in Wandsworth range from £2,352 in SW17 to £3,504 in SW11, with gross rental yields from 4.8% to 5.3% across all eight postcodes. Where the sales side carries months of unsold stock, the lettings side carries weeks: every postcode is rated a landlord's market on that ratio, with the homes advertised to let amounting to six to nine weeks of lettings at the current pace. For investors asking is buy to let worth it in Wandsworth, the sections below break down rents, yields and tenant affordability postcode by postcode. If you are working out how to build a property portfolio in London, Wandsworth pairs a large private rented sector with a high cost of entry. Browse current buy-to-let homes for sale across the region.
Average Rent & Gross Rental Yields in Wandsworth
Gross rental yields in Wandsworth range from 4.8% in SW12, SW17 and SW19 to 5.3% in SW11 and SW4. The band is tight, and the top yield does not sit with the cheapest postcode as it does in most markets. SW11 charges the highest rent in the borough at £3,504 a month and reaches 5.3% despite its £787,182 asking price, while SW4 (Clapham) reaches the same 5.3% on a much lower £609,116 asking price.
| Area | Average Monthly Rent | Asking Price | Gross Yield |
|---|---|---|---|
| SW11 (Battersea, Clapham Junction) | £3,504 | £787,182 | 5.3% |
| SW4 (Clapham) | £2,670 | £609,116 | 5.3% |
| SW18 (Wandsworth Town, Earlsfield) | £2,593 | £615,050 | 5.1% |
| SW8 (Nine Elms, South Lambeth) | £3,219 | £766,900 | 5.0% |
| SW15 (Putney, Roehampton) | £2,535 | £622,115 | 4.9% |
| SW12 (Balham) | £2,866 | £709,363 | 4.8% |
| SW17 (Tooting) | £2,352 | £590,300 | 4.8% |
| SW19 (Southfields, Wimbledon) | £2,416 | £609,057 | 4.8% |
SW4 at 5.3% reaches the top of the yield table on a mid-range £609,116 asking price and a £2,670 rent. It gets there because that rent sits against a price well below Battersea's, not because it charges the most.
SW11 at 5.3% gets there differently, on the borough's highest rent of £3,504 against its highest asking price of £787,182. SW4 and SW11 both show a 5.3% gross yield, but SW4 needs less money upfront and brings in less rent each month. At the bottom, SW17, SW19 and SW12 all sit at 4.8%, still a narrow gap from the top.
Is Wandsworth Rent High?
Monthly rents in Wandsworth take between 51.7% and 77.0% of the borough's median gross monthly salary. The widely cited affordability threshold is 30% of gross income, and every Wandsworth postcode sits well above it. The figures compare a whole home's rent with one Wandsworth median salary, so they say more about how far that one income goes than about who actually pays these rents, and for the six postcodes that cross the borough line they are a Wandsworth-wage benchmark rather than a measure of what residents of those addresses earn.
The median gross weekly salary in Wandsworth is £1,016.60, and the median annual salary is £54,584, about £4,549 a month. This is above the London median of £902.70 a week and the Great Britain median of £766.60 a week. Data from the Nomis Labour Market Profile (ASHE 2025).
| Rank | Area | Rent as % of Income |
|---|---|---|
| 1 | SW11 (Battersea, Clapham Junction) | 77.0% |
| 2 | SW8 (Nine Elms, South Lambeth) | 70.8% |
| 3 | SW12 (Balham) | 63.0% |
| 4 | SW4 (Clapham) | 58.7% |
| 5 | SW18 (Wandsworth Town, Earlsfield) | 57.0% |
| 6 | SW15 (Putney, Roehampton) | 55.7% |
| 7 | SW19 (Southfields, Wimbledon) | 53.1% |
| 8 | SW17 (Tooting) | 51.7% |
SW17 at 51.7% is the lowest ratio in the borough, and it is still well beyond the 30% mark. On the Wandsworth median salary, a single earner would be spending more than half their gross pay to rent a whole home alone anywhere in the borough.
SW11 at 77.0% is the least affordable, driven by the £3,504 rent in Battersea. A tenant paying that rent alone would need to earn well above the borough median. The figures here compare a whole home's rent against one median salary, which is why they run so high; they say nothing about how many people share a home or what they earn.
How Big Is Wandsworth's Private Rented Sector?
The private rented sector is deepest in SW11 at 41.6% of households and SW8 at 37.8%, and shallowest in SW15 (Putney, Roehampton) at 27.7%. In SW11 private renters outnumber outright owners and mortgage holders combined, so renting is already a large part of that postcode's housing. The table below shows household tenure by postcode.
| Area | Owned Outright | Owned with Mortgage | Private Rented | Social Rented |
|---|---|---|---|---|
| SW11 (Battersea, Clapham Junction) | 16.7% | 20.8% | 41.6% | 19.4% |
| SW8 (Nine Elms, South Lambeth) | 13.6% | 14.7% | 37.8% | 32.2% |
| SW12 (Balham) | 18.3% | 28.2% | 37.6% | 15.1% |
| SW4 (Clapham) | 13.1% | 21.9% | 37.4% | 26.1% |
| SW17 (Tooting) | 20.0% | 27.3% | 35.9% | 15.6% |
| SW19 (Southfields, Wimbledon) | 24.2% | 26.8% | 34.4% | 12.9% |
| SW18 (Wandsworth Town, Earlsfield) | 20.6% | 32.4% | 32.4% | 13.0% |
| SW15 (Putney, Roehampton) | 30.4% | 28.1% | 27.7% | 13.1% |
SW11 (Battersea) has the largest private rented sector at 41.6%, with more homes rented privately than owned outright and with a mortgage combined. That depth of existing tenants is a different signal from yield: it shows how much of the postcode already rents, not how fast any one flat will let. SW15 (Putney, Roehampton) sits at the other end with 27.7% private renting and the borough's highest outright ownership at 30.4%, a more owner-occupied mix alongside its house-heavier stock.
Every postcode is rated a landlord's market on current listing volumes, the lettings equivalent of months of unsold stock on the sales side. Across the borough the homes advertised to let amount to roughly six to nine weeks of lettings at the current pace, from about six weeks in SW15 to eight and a half in SW8, with SW11 the busiest at around 428 lettings a month against 725 homes advertised at any one time. That is a rental stock measured in weeks sitting on top of a sales stock measured in months.
Local Housing Allowance Rates in Wandsworth
Wandsworth spans three Broad Rental Market Areas, so Local Housing Allowance rates vary by postcode: the Inner South West London area covers most of the borough, with SW19 in Outer South West London and SW4 in Inner South East London. Local Housing Allowance sets the maximum housing support a tenant on benefits can receive, so any rent above that limit has to come from the tenant's own pocket. Because Wandsworth straddles three areas, the rate for a given size of home is not the same across the whole borough. To check the current rate for a specific address, you can use the government's official Local Housing Allowance calculator.
| Property Size | Inner South West London (weekly) | Outer South West London (SW19) | Inner South East London (SW4) |
|---|---|---|---|
| Shared accommodation | £157.64 | £136.13 | £149.59 |
| 1 bedroom | £326.79 | £276.16 | £298.15 |
| 2 bedrooms | £391.23 | £344.05 | £356.71 |
| 3 bedrooms | £497.10 | £414.25 | £448.77 |
| 4 bedrooms | £667.40 | £586.85 | £604.11 |
Most of Wandsworth, including SW8, SW11, SW12, SW15, SW17 and SW18, falls in the Inner South West London area, where the two-bedroom rate of £391.23 a week works out at about £1,695 a month. The rents elsewhere on this page average every size of home, so they do not line up with a per-bedroom rate like this one. What the table shows is the ceiling on housing support for each size of home; rent above that ceiling comes out of the tenant's own pocket. SW19 (Southfields, Wimbledon) uses the lower Outer South West London rates, and SW4 (Clapham) the Inner South East London rates, so the rate that applies depends on the address rather than on the borough.
Buy-to-Let Considerations
Are House Prices High in Wandsworth? Price-to-Earnings Ratios
Buying a property in Wandsworth costs between 10.8 and 14.4 times the borough's median annual salary. This is based on the Nomis Labour Market Profile for Wandsworth, which puts the median gross annual income for residents at £54,584. The same borough figure is applied to every postcode, including the six that cross into Lambeth, Merton, Richmond and Kingston, where it is a benchmark rather than a wage measured for those addresses.
The national benchmark for price-to-earnings is 7.4x (England's average sold price of £289,946 divided by the Great Britain median annual salary of £39,125). Every Wandsworth postcode sits above that benchmark, which is the expected picture for prime inner London: prices are high relative to income even against strong local earnings.
| Rank | Area | Price-to-Earnings Ratio |
|---|---|---|
| 1 | SW17 (Tooting) | 10.8x |
| 2 | SW19 (Southfields, Wimbledon) | 11.2x |
| 3 | SW4 (Clapham) | 11.2x |
| 4 | SW18 (Wandsworth Town, Earlsfield) | 11.3x |
| 5 | SW15 (Putney, Roehampton) | 11.4x |
| 6 | SW12 (Balham) | 13.0x |
| 7 | SW8 (Nine Elms, South Lambeth) | 14.0x |
| 8 | SW11 (Battersea, Clapham Junction) | 14.4x |
SW17 at 10.8x is the lowest ratio against the Wandsworth median, and it is the same postcode with the lowest asking price and growth positive across all three windows. Even so, at nearly eleven times that income it is a long way above the 7.4x national benchmark.
SW11 at 14.4x sits at the top of the borough, more than fourteen times the Wandsworth median income. Its 5.3% yield pairs the borough's highest rent, £3,504, with its highest asking price, £787,182.
Deposit Requirements in Wandsworth
A 30% deposit on a buy-to-let property in Wandsworth runs from £177,090 in SW17 to £236,154 in SW11. The gap between the cheapest and dearest deposit is £59,064. Of the four neighbouring boroughs compared later on this page, only Richmond upon Thames has a higher mean asking price, so deposits here run above Lambeth, Kingston and Merton on average.
Beyond the deposit, the stamp duty calculation and other buy-to-let running costs add materially to the capital required, and stamp duty in particular is heavy at these price points.
| Rank | Area | 30% Deposit Required |
|---|---|---|
| 1 | SW17 (Tooting) | £177,090 |
| 2 | SW19 (Southfields, Wimbledon) | £182,717 |
| 3 | SW4 (Clapham) | £182,735 |
| 4 | SW18 (Wandsworth Town, Earlsfield) | £184,515 |
| 5 | SW15 (Putney, Roehampton) | £186,635 |
| 6 | SW12 (Balham) | £212,809 |
| 7 | SW8 (Nine Elms, South Lambeth) | £230,070 |
| 8 | SW11 (Battersea, Clapham Junction) | £236,154 |
SW17 is the lowest way into the borough at a £177,090 deposit, and it comes with the lowest yield band at 4.8%, joint with SW12 and SW19, growth positive across all three windows and the most affordable rents. SW4 sits just above at £182,735 and reaches the borough's top yield of 5.3%, and SW18 at £184,515 carries 5.1%, so two of the four lowest deposits also sit in the top three for yield. That is a different pattern from the more expensive SW11 and SW8, where the larger deposits buy into the heavily stocked Battersea and Nine Elms flat market.
The five cheapest postcodes, from SW17 to SW15, all cluster within about £10,000 of each other on the deposit, yet they behave differently. SW4 pairs its low deposit with the top yield of 5.3% on a growth record that is negative over one and three years, SW18 pairs its own with a 5.1% yield and growth positive across all three windows, while SW15 and SW19 sit at the softer end of the growth table.
What the Wandsworth Data Tells Buy-to-Let Investors
In Wandsworth the top yield does not sit with the cheapest postcode. SW4 (Clapham) reaches the borough's top yield of 5.3% on a mid-range £609,116 asking price for buying an investment property, a £2,670 rent and one of the lower deposits at £182,735. SW11 (Battersea) matches that 5.3% from the other direction, on the highest rent of £3,504 against the highest asking price of £787,182.
SW18 (Wandsworth Town, Earlsfield) is one of two postcodes positive across every timeframe, up 5.8% over a year, 4.1% over three years and 6.3% over five, on a 5.1% yield and a £184,515 deposit. SW17 (Tooting) is the other, positive across all three windows and the cheapest way in, with the lowest asking price at £590,300, the lowest deposit at £177,090 and the most affordable rents in the borough.
At the pricier end, SW8 (Nine Elms) shows the widest swings, down 34.4% over three years but up 9.4% over the past year. SW11 and SW8 also hold the most unsold stock against their sales, around 33 months' worth, so a seller there has the most listings competing for each buyer. Homes sold before they reach the portals are covered in our guide to off-market property in Wandsworth.
What runs through the whole borough is the rental market. Every postcode is rated a landlord's market, with only six to nine weeks of homes to let on the market, sitting on top of a sales market carrying 11 to 33 months of unsold stock. With an 82.9% employment rate, earnings well above the London median and a private rented sector reaching 41.6% in Battersea, the figures that set Wandsworth apart are on the rental side rather than in headline yield or recent capital growth.
How Wandsworth Compares
Wandsworth's mean asking price of £663,635 is the second highest of five south-west London boroughs compared here, yet its top yield of 5.3% is the second highest in the group. The comparison below places Wandsworth alongside four neighbouring boroughs. The mean asking price and mean monthly rent are simple averages across all postcodes with data. Top gross yield is the single highest postcode yield in each borough.
| Location | Mean Asking Price | Mean Monthly Rent | Mean Gross Yield | Top Yield (postcode) |
|---|---|---|---|---|
| Lambeth | £587,762 | £2,368 | 4.8% | 5.6% (SE5) |
| Kingston upon Thames | £590,531 | £1,931 | 3.9% | 4.2% (KT1, KT6) |
| Merton | £596,108 | £2,223 | 4.5% | 5.2% (CR4) |
| Wandsworth | £663,635 | £2,770 | 5.0% | 5.3% (SW11, SW4) |
| Richmond upon Thames | £880,115 | £2,622 | 3.6% | 4.9% (TW9) |
Wandsworth is the second most expensive borough in this comparison at £663,635 mean asking price, behind only Richmond, and it carries the highest mean monthly rent in the group at £2,770. Its top yield of 5.3% is just ahead of Merton's 5.2% and behind Lambeth's 5.6%, so on income Wandsworth sits in the upper half of the group despite its higher prices.
For investors focused on the lowest entry cost, Lambeth at £587,762 and Kingston upon Thames at £590,531 ask the least, though Kingston's 4.2% is the lowest top yield here. Merton next door offers a similar yield to Wandsworth on a lower average price, while Richmond upon Thames is the priciest at £880,115 with a 4.9% top yield. For a data-driven comparison across the whole country, see our guide to the highest-yielding areas.
Frequently Asked Questions
Is Wandsworth a good place to live for buy-to-let tenants?
The private rented sector is between 27.7% and 41.6% of households depending on the postcode. The employment rate is 82.9%, well above the 75.6% Great Britain figure, and the typical wage is £1,016.60 a week against roughly £903 across London. Clapham Junction, the Northern line and the District line give fast routes into central London and the City.
On the lettings side, every postcode is rated a landlord's market, with the homes advertised to let amounting to six to nine weeks of lettings at the current pace. That is the homes to let set against the pace of lettings, not a measure of how quickly any one flat lets. Battersea Park and the commons at Clapham, Wandsworth and Tooting Bec are the borough's main open spaces.
What are the best areas in Wandsworth for property investment?
The top yield is shared by two very different postcodes. SW4 (Clapham) and SW11 (Battersea, Clapham Junction) both reach the top yield of 5.3%, but from opposite ends: SW4 on a mid-range £609,116 asking price and a lower deposit, SW11 on the borough's highest rent of £3,504 against its highest asking price of £787,182.
For growth that has actually shown up, SW18 (Wandsworth Town, Earlsfield) is one of the two postcodes positive across one, three and five years, and SW17 (Tooting) is the other, while also being the cheapest way in at a £590,300 asking price. SW4 leads on yield against a lower entry cost; SW18 and SW17 are the two whose growth has stayed positive across all three windows.
How does Wandsworth compare to Lambeth for buy-to-let?
They are neighbouring boroughs, and the numbers are not far apart. Lambeth's mean asking price is £587,762 against Wandsworth's £663,635, so Lambeth is the cheaper entry, and its top yield of 5.6% edges Wandsworth's 5.3%. Wandsworth carries the higher mean rent at £2,770 a month against Lambeth's £2,368.
Lambeth asks less and returns a touch more on the top postcode; Wandsworth commands the higher rents.
Is there demand for student accommodation in Wandsworth?
Some, and it comes from two ends of the borough. The University of Roehampton sits in Putney and Roehampton in SW15, and City St George's, University of London has its Tooting campus in SW17. The flats and shared houses around both support student lets; how large a share of the borough's renters students make up is not something this page measures. Shared houses here also need a licence in most cases: since 1 July 2025 the council has run additional licensing for HMOs that fall outside the national mandatory scheme, and selective licensing covers Furzedown, Tooting Bec, Tooting Broadway and South Balham from the same date, with East Putney, West Putney and Northcote added from 1 April 2026. The council's property licence check shows which scheme an address falls under. For the purpose-built end of the market, see our guide to PBSA investment.
On the shared-house side, a sample of current SW15 room adverts puts a double with a shared bathroom at around £191 a week, with most between £165 and £254. SW17 (Tooting) and SW19 (Southfields, Wimbledon) also carry enough live adverts to read, at roughly £222 and £204 a week for the same room type. For how the numbers work on a shared house, see our HMO investment guide.
Can I find buy-to-let property under £600,000 in Wandsworth?
Only in one postcode on average. The cheapest is SW17 (Tooting) at a £590,300 asking price, so it is the single postcode sitting below £600,000, with SW19 and SW4 just above at around £609,000. The postcode figures average every property type. Flats across the borough average £516,555 on the Land Registry index, well under the house prices, but that is a borough-wide figure rather than a price for any one postcode, so it points at the property type, not the street. Homes offered under their market price are covered in our guide to below market value property.
What are average house prices in Wandsworth?
High, and well above the national picture. The average sold price in Wandsworth is £672,069 on the Land Registry index, about 131.8% above the England average of £289,946 as of March 2026. Asking prices by postcode run from £590,300 in SW17 (Tooting) up to £787,182 in SW11 (Battersea, Clapham Junction), with a borough-wide mean of £663,635. By type, detached homes average £2,333,195, semi-detached £1,293,760, terraced £952,204 and flats £516,555, though detached and semi-detached houses make up only a small share of a flat-dominated borough.
Flats are the largest housing type in every postcode, from 45.4% of the stock in SW15 to 82.7% in SW8, and they carry the smallest premium over England at 140.7% while showing the softest recent change at -6.3% over the past year.
What are the Local Housing Allowance rates in Wandsworth?
They vary by postcode, because Wandsworth spans three Broad Rental Market Areas. Most of the borough falls in Inner South West London, where the June 2026 rates run at £157.64 a week for a shared room, £326.79 for a one-bed, £391.23 for two beds, £497.10 for three and £667.40 for four. SW19 (Southfields, Wimbledon) uses the lower Outer South West London rates and SW4 (Clapham) the Inner South East London rates. Those figures are the most a tenant on housing support can claim towards rent, so rent above those levels comes out of the tenant's own income. They are set per bedroom count, so they do not compare directly with the all-sizes rent averages elsewhere on this page.
What type of property is most common in Wandsworth?
Flats, in every single postcode, by a wide margin. They run from 45.4% of the stock in SW15 (Putney, Roehampton) up to 82.7% in SW8 (Nine Elms). Terraced houses are the next most common, most concentrated in SW17 (Tooting) at 34.6%. Detached and semi-detached houses are scarcer: together they are under 10% of stock in SW4, SW8 and SW11, a fifth or less in four more postcodes, and 31.2% only in SW15, so the housing stock is overwhelmingly flats.
How do I buy an investment property in Wandsworth?
The top yield and the positive growth records sit in different postcodes. SW4 (Clapham) reaches the top yield of 5.3% on a mid-range £609,116 asking price, while SW18 (Wandsworth Town, Earlsfield) pairs a 5.1% yield with growth positive across one, three and five years. A 30% deposit runs from £177,090 in SW17 up to £236,154 in SW11, and stamp duty at these price points is a large additional cost.
Beyond what is listed openly, off-market property and BMV property are covered in their own guides. To see what is available now, browse investment properties or buy-to-let homes for sale.
Ready to buy property?
Browse investment properties with prices and gross yields shown for each opportunity.
Get property alerts