
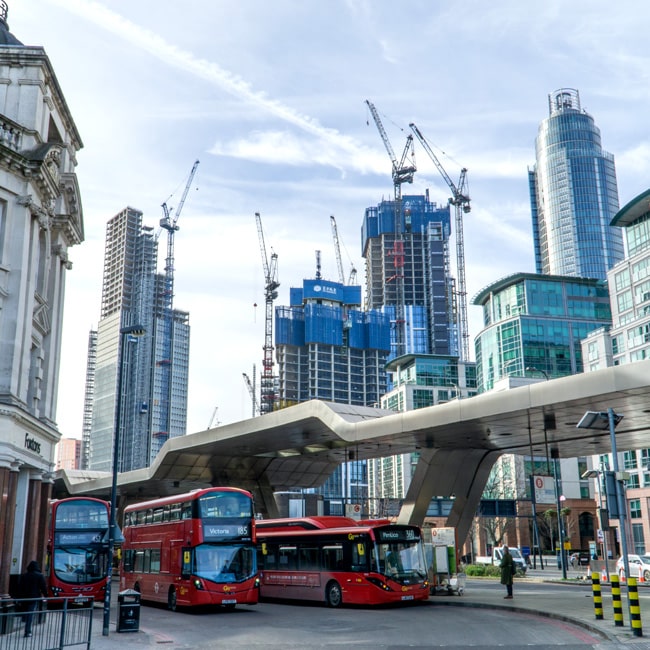
Lambeth is a borough of south London. Average sold prices across Lambeth sit at £554,128 on the HM Land Registry House Price Index, 91.1% above the England average of £289,946 and £12,063 above the London regional average of £542,065. That puts Lambeth firmly in inner-London territory, but the headline figure hides a wide spread. Asking prices run from £445,881 in SE19 (Crystal Palace, Upper Norwood) to £766,900 in SW8 (South Lambeth, Nine Elms), a 72.0% gap inside a single borough.
Lambeth is a flat-dominated borough. Flats and maisonettes average £454,315 on the Land Registry index, well below the houses, and they are the largest single type of home in every postcode. SE5 (Camberwell, Denmark Hill) tops the yield table at 5.6% gross. SE11 (Kennington, Vauxhall) is joint second at 5.4% despite a £642,627 asking price, and SW8, the dearest postcode, still returns 5.0%, so price and yield do not line up neatly.
This guide covers the London Borough of Lambeth (ONS code E09000022) across fourteen postcodes: SE1, SE5, SE11, SE19, SE21, SE24, SE26, SE27, SW2, SW4, SW8, SW9, SW12 and SW16. Only SE27, SW2 and SW9 sit wholly inside the borough. SE26 (Sydenham) lies outside it altogether, in Lewisham, Bromley and Southwark, and the rest cross the boundary: SE1, SE5, SE11, SE21 and SE24 into Southwark, SE19 into Croydon, Southwark and Bromley, SW4, SW8 and SW12 into Wandsworth, and SW16 into Croydon, Wandsworth and Merton. The borough-level sold prices, wages, licensing and planning rules cover Lambeth addresses only; the postcode tables cover every address in the postcode. Lambeth runs south from the Thames at Waterloo and Vauxhall down through Brixton, Clapham and Streatham to Crystal Palace. It is part of the wider South London buy-to-let market, sitting between Wandsworth to the west and Southwark to the east.
Article updated: July 2026

Why Invest in Lambeth?
Lambeth's population reached 317,654 at the 2021 Census, up 4.81% on the 303,086 recorded in 2011. That is slower than the 6.3% England and Wales average. The borough runs from the South Bank, directly across the Thames from Westminster and the West End, down through Brixton and Clapham to Streatham, with the City a few stops away.
North Lambeth holds St Thomas' Hospital on Westminster Bridge Road and King's College London's Waterloo campus on Stamford Street. The transport spine runs through Waterloo, Vauxhall and the Victoria line terminus at Brixton. The data does not show how much of the rental demand comes from any of them.
Median gross weekly pay for Lambeth residents is £946.60, which is 4.9% above the London figure of £902.70 and 23.5% above the Great Britain median of £766.60. The employment rate of 77.8% runs ahead of London's 74.9%.
Lambeth Economic Summary
- Population (Lambeth): 317,654 (2021 Census). Growth of 4.81% from 2011.
- Median annual salary: £49,034 (local), £46,414 (London), £39,125 (Great Britain)
- Median gross weekly pay: £946.60 (local), £902.70 (London), £766.60 (Great Britain)
- Employment rate: 77.8% (local), 74.9% (London)
- Unemployment rate: 7.3% (local)
Source: ONS Census 2021, Nomis Labour Market Profile (ASHE 2025, Employment Oct 2024-Sep 2025)
Regeneration and Investment in Lambeth
Lambeth's northern riverside sits inside Vauxhall Nine Elms Battersea, the largest central London regeneration area, where more than 18,000 new homes are planned and around 3,500 of them fall in the Vauxhall part of the borough. The activity is concentrated in SW8 and SE11, but the scale of investment along the river reaches across North Lambeth, and the rest of the borough is seeing smaller schemes come forward in Brixton and Streatham.
- Vauxhall Nine Elms Battersea (VNEB) regeneration (18,000+ homes, target completion 2030): The area runs from Lambeth Bridge down to Battersea Power Station and is the largest central London regeneration zone, with roughly 3,500 of the new homes in the Vauxhall area. Lambeth Council estimates around 22,000 construction jobs during the build, with around 50 acres of new public space. The £1 billion Northern line extension that serves it, with stations at Nine Elms and Battersea Power Station, opened in 2021, and the Vauxhall station upgrade, which added capacity and step-free access, was completed in August 2017 at a final cost TfL put at about £30 million (TfL programme report). Updates at Lambeth Council.
- Brixton, 49 Brixton Station Road and Canterbury Crescent (288 homes): Lambeth Council, working with developer London Square, has brought forward a mixed-use scheme of 288 flats across two council-owned sites, including 98 homes at social rent, alongside new shops, dedicated storage for Brixton's market traders, a community hub and workspace. The blocks range from six to twenty storeys. Lambeth's planning committee granted permission on 24 March 2026, so the scheme is approved but not yet built; the council's project page expects construction from March 2027 to December 2029, with completion in early 2030, and Pop Brixton's lease on the Brixton Station Road site runs until winter 2026 (Lambeth Council). Updates at South London Press.
- Streatham, Leigham Court Road (92 homes): Pocket Living has planning consent for 92 build-to-rent homes, half of them affordable (social rent and discount market rent) and the rest for private rent, with a new community and commercial building on the site; the council's March 2026 update expects construction to start in 2026 to 2027 (Lambeth Council, Bell Phillips). Updates at South London Press.
Source: Office for National Statistics - Population for Lambeth
Lambeth Property Market Analysis
Average property prices in Lambeth have risen 663.8% since January 1995, from £72,550 to £554,128. The sections below trace that journey cycle by cycle, then drill into current postcode-level data for sold prices, price per square foot, asking prices, growth trends, and monthly transaction volumes.
When was the last house price crash in Lambeth?
All sold property prices for Lambeth from HM Land Registry are recorded at borough level. The Land Registry House Price Index tracks average prices from January 1995 to the latest reading in March 2026, covering 31 years of market cycles.
The 1995 to 2007 climb: Lambeth started at £72,550 in January 1995. By December 2000 the average had reached £172,066, more than doubling in six years. The run continued through the 2000s and the market peaked at £342,834 in October 2007.
2008 to 2009, the financial crisis: Prices fell from the October 2007 peak of £342,834 to a trough of £264,672 in April 2009, a decline of 22.8% over eighteen months, with the worst year-on-year reading at -19.1% in April 2009. Lambeth's fall was steeper than England's 18.2% (£183,883 in September 2007 to £150,438 in March 2009).
Recovery, 2009 to 2012: Lambeth bounced back quickly. Prices climbed off the April 2009 trough and passed the pre-crash peak by May 2012, when the average reached £346,768. That recovery took four years and seven months.
The 2012 to 2016 London boom: Prices ran from £346,768 in May 2012 to £548,167 by December 2016, with annual growth touching 19.0% at the end of 2013. The borough's average rose by more than half in four years.
The 2016 to 2019 plateau: Prices moved sideways, from £548,167 in December 2016 to £557,289 in December 2019, with annual growth slowing to 1.9%. Lambeth held its gains rather than extending them.
2020 to 2022, the pandemic peak: A brief surge carried the borough to its all-time high of £607,388 in October 2022.
2023 to present: The average eased to £569,140 by December 2023 and £532,742 by December 2025 before recovering to £554,128 at the latest March 2026 reading, down 1.1% on the year. The current figure sits 8.8% below the October 2022 high and 61.6% above the 2007 pre-crash peak.
Long-term growth summary:
- 5 years (March 2021 to March 2026): -5.4% growth (£585,754 to £554,128)
- 10 years (December 2015 to March 2026): 6.8% growth (£518,704 to £554,128)
- 15 years (December 2010 to March 2026): 77.0% growth (£313,089 to £554,128)
- 20 years (December 2005 to March 2026): 123.2% growth (£248,315 to £554,128)
- 31 years (January 1995 to March 2026): 663.8% growth (£72,550 to £554,128)
Lambeth's 31-year return is 663.8%. The recent picture is softer: the borough is down 5.4% over five years. A buyer who took on a property at the October 2007 peak would still be 61.6% ahead on the Land Registry average, while one who bought at the October 2022 high would be 8.8% behind.
- All property types
- Detached
- Semi-detached
- Terraced
- Flats
Source: HM Land Registry House Price Index
| Year | All property types | Detached | Semi-detached | Terraced | Flats |
|---|---|---|---|---|---|
| 1995-01 | £72,550 | £144,572 | £116,732 | £89,383 | £64,619 |
| 1995-02 | £69,992 | £137,325 | £112,735 | £86,573 | £62,126 |
| 1995-03 | £71,014 | £138,316 | £114,047 | £87,838 | £63,109 |
| 1995-04 | £71,070 | £136,785 | £113,858 | £87,920 | £63,231 |
| 1995-05 | £73,903 | £142,893 | £118,471 | £91,331 | £65,790 |
| 1995-06 | £73,738 | £142,702 | £118,308 | £90,867 | £65,808 |
| 1995-07 | £74,517 | £145,462 | £119,968 | £92,142 | £66,189 |
| 1995-08 | £73,694 | £144,681 | £118,775 | £91,298 | £65,299 |
| 1995-09 | £75,103 | £148,677 | £121,387 | £93,331 | £66,263 |
| 1995-10 | £74,525 | £147,786 | £120,611 | £92,198 | £66,011 |
| 1995-11 | £72,853 | £143,853 | £117,595 | £89,642 | £64,935 |
| 1995-12 | £71,938 | £141,300 | £115,930 | £88,310 | £64,310 |
| 1996-01 | £73,630 | £143,700 | £118,384 | £90,519 | £65,794 |
| 1996-02 | £77,405 | £150,673 | £124,656 | £95,222 | £69,080 |
| 1996-03 | £76,823 | £150,086 | £124,175 | £94,530 | £68,469 |
| 1996-04 | £76,718 | £149,714 | £123,558 | £94,128 | £68,582 |
| 1996-05 | £76,420 | £149,185 | £122,906 | £94,214 | £68,087 |
| 1996-06 | £78,650 | £152,536 | £126,167 | £97,080 | £70,065 |
| 1996-07 | £79,013 | £154,042 | £127,725 | £98,083 | £69,958 |
| 1996-08 | £77,955 | £153,082 | £126,667 | £96,975 | £68,816 |
| 1996-09 | £78,078 | £154,640 | £126,912 | £97,259 | £68,822 |
| 1996-10 | £77,406 | £154,271 | £125,991 | £96,354 | £68,227 |
| 1996-11 | £78,529 | £155,998 | £127,561 | £97,609 | £69,332 |
| 1996-12 | £80,007 | £158,805 | £130,125 | £99,445 | £70,622 |
| 1997-01 | £83,766 | £165,657 | £136,141 | £104,492 | £73,762 |
| 1997-02 | £84,639 | £167,546 | £137,456 | £105,390 | £74,610 |
| 1997-03 | £84,784 | £167,509 | £137,576 | £105,788 | £74,623 |
| 1997-04 | £83,263 | £164,244 | £135,249 | £103,805 | £73,313 |
| 1997-05 | £86,712 | £171,476 | £141,614 | £108,547 | £76,060 |
| 1997-06 | £91,392 | £182,279 | £150,213 | £114,845 | £79,840 |
| 1997-07 | £98,487 | £197,076 | £162,054 | £124,247 | £85,788 |
| 1997-08 | £98,458 | £197,680 | £162,181 | £124,388 | £85,653 |
| 1997-09 | £99,047 | £198,263 | £163,085 | £125,093 | £86,200 |
| 1997-10 | £95,516 | £191,443 | £157,475 | £120,377 | £83,218 |
| 1997-11 | £97,859 | £196,383 | £161,489 | £123,254 | £85,274 |
| 1997-12 | £99,619 | £199,804 | £164,351 | £125,228 | £86,924 |
| 1998-01 | £103,017 | £206,961 | £169,915 | £129,748 | £89,776 |
| 1998-02 | £104,164 | £207,326 | £170,890 | £130,739 | £91,017 |
| 1998-03 | £103,489 | £205,491 | £169,553 | £129,823 | £90,431 |
| 1998-04 | £104,481 | £206,927 | £171,696 | £131,049 | £91,264 |
| 1998-05 | £106,386 | £211,334 | £175,382 | £134,073 | £92,648 |
| 1998-06 | £112,197 | £222,901 | £184,796 | £141,435 | £97,710 |
| 1998-07 | £115,532 | £230,157 | £190,602 | £146,021 | £100,448 |
| 1998-08 | £117,368 | £235,337 | £194,128 | £148,518 | £101,924 |
| 1998-09 | £115,926 | £234,372 | £192,677 | £147,145 | £100,409 |
| 1998-10 | £114,562 | £230,522 | £189,097 | £144,501 | £99,673 |
| 1998-11 | £113,669 | £228,497 | £187,261 | £142,507 | £99,235 |
| 1998-12 | £114,669 | £228,388 | £188,222 | £143,043 | £100,444 |
| 1999-01 | £113,602 | £226,220 | £186,964 | £141,782 | £99,441 |
| 1999-02 | £114,715 | £227,504 | £188,940 | £143,529 | £100,286 |
| 1999-03 | £114,181 | £225,830 | £187,673 | £142,753 | £99,897 |
| 1999-04 | £117,485 | £231,221 | £192,694 | £147,295 | £102,688 |
| 1999-05 | £120,298 | £235,187 | £196,705 | £150,806 | £105,222 |
| 1999-06 | £120,826 | £236,403 | £198,081 | £152,126 | £105,405 |
| 1999-07 | £125,577 | £247,346 | £206,632 | £158,626 | £109,288 |
| 1999-08 | £128,965 | £255,255 | £212,860 | £163,641 | £111,911 |
| 1999-09 | £133,963 | £266,209 | £221,006 | £169,889 | £116,275 |
| 1999-10 | £134,541 | £266,242 | £221,078 | £169,440 | £117,277 |
| 1999-11 | £135,601 | £267,744 | £222,380 | £170,189 | £118,448 |
| 1999-12 | £138,326 | £270,336 | £225,602 | £172,980 | £121,189 |
| 2000-01 | £141,316 | £278,302 | £231,955 | £177,418 | £123,418 |
| 2000-02 | £145,344 | £285,942 | £237,921 | £182,392 | £126,925 |
| 2000-03 | £146,281 | £289,824 | £240,800 | £184,322 | £127,305 |
| 2000-04 | £152,695 | £298,857 | £249,536 | £191,903 | £133,132 |
| 2000-05 | £155,469 | £302,995 | £254,370 | £195,226 | £135,585 |
| 2000-06 | £160,383 | £310,497 | £261,564 | £200,656 | £140,112 |
| 2000-07 | £158,776 | £311,014 | £260,807 | £198,931 | £138,514 |
| 2000-08 | £162,097 | £318,743 | £266,149 | £202,110 | £141,652 |
| 2000-09 | £165,738 | £328,791 | £272,094 | £206,126 | £144,943 |
| 2000-10 | £168,755 | £332,245 | £276,013 | £208,814 | £147,916 |
| 2000-11 | £172,819 | £340,397 | £281,799 | £213,298 | £151,660 |
| 2000-12 | £172,066 | £335,750 | £279,234 | £211,483 | £151,319 |
| 2001-01 | £172,191 | £334,773 | £277,985 | £211,755 | £151,486 |
| 2001-02 | £166,565 | £321,630 | £268,705 | £205,264 | £146,476 |
| 2001-03 | £166,942 | £322,994 | £270,030 | £206,451 | £146,595 |
| 2001-04 | £168,365 | £326,449 | £272,146 | £208,251 | £147,837 |
| 2001-05 | £176,033 | £341,582 | £284,105 | £217,916 | £154,536 |
| 2001-06 | £178,895 | £344,332 | £287,314 | £220,759 | £157,358 |
| 2001-07 | £181,008 | £348,460 | £291,547 | £223,671 | £159,082 |
| 2001-08 | £181,945 | £349,813 | £292,610 | £224,587 | £160,005 |
| 2001-09 | £181,801 | £351,668 | £292,314 | £224,463 | £159,849 |
| 2001-10 | £180,551 | £348,484 | £289,881 | £222,072 | £159,035 |
| 2001-11 | £179,232 | £346,077 | £287,985 | £219,555 | £158,137 |
| 2001-12 | £182,047 | £347,853 | £291,839 | £221,758 | £161,074 |
| 2002-01 | £190,451 | £362,453 | £304,253 | £231,095 | £168,854 |
| 2002-02 | £190,771 | £360,892 | £303,991 | £231,651 | £169,143 |
| 2002-03 | £191,689 | £362,474 | £305,684 | £233,095 | £169,842 |
| 2002-04 | £189,164 | £355,062 | £300,300 | £229,411 | £167,889 |
| 2002-05 | £193,975 | £362,898 | £307,708 | £234,742 | £172,338 |
| 2002-06 | £199,141 | £370,236 | £313,814 | £240,636 | £177,173 |
| 2002-07 | £205,887 | £384,758 | £325,752 | £250,095 | £182,680 |
| 2002-08 | £214,392 | £401,092 | £338,747 | £260,418 | £190,250 |
| 2002-09 | £217,964 | £411,468 | £346,808 | £265,510 | £193,023 |
| 2002-10 | £217,972 | £410,655 | £346,721 | £264,372 | £193,400 |
| 2002-11 | £216,166 | £408,089 | £343,681 | £261,554 | £191,998 |
| 2002-12 | £219,003 | £410,566 | £347,737 | £263,863 | £194,919 |
| 2003-01 | £220,425 | £412,814 | £348,820 | £265,919 | £196,143 |
| 2003-02 | £221,967 | £412,849 | £351,197 | £267,276 | £197,702 |
| 2003-03 | £217,977 | £404,742 | £343,746 | £262,421 | £194,231 |
| 2003-04 | £216,091 | £398,493 | £341,053 | £259,471 | £192,772 |
| 2003-05 | £211,056 | £388,982 | £334,058 | £254,708 | £187,825 |
| 2003-06 | £210,605 | £387,410 | £333,168 | £254,213 | £187,423 |
| 2003-07 | £212,001 | £390,116 | £335,720 | £256,615 | £188,421 |
| 2003-08 | £218,051 | £401,349 | £345,188 | £263,978 | £193,790 |
| 2003-09 | £221,283 | £409,409 | £352,603 | £269,441 | £196,035 |
| 2003-10 | £221,063 | £408,685 | £351,190 | £269,016 | £195,949 |
| 2003-11 | £221,080 | £408,100 | £350,563 | £268,541 | £196,158 |
| 2003-12 | £221,027 | £403,974 | £348,329 | £267,509 | £196,561 |
| 2004-01 | £227,770 | £417,396 | £360,358 | £276,019 | £202,365 |
| 2004-02 | £226,684 | £414,605 | £359,276 | £275,338 | £201,176 |
| 2004-03 | £228,280 | £417,862 | £361,554 | £277,741 | £202,458 |
| 2004-04 | £229,063 | £414,914 | £361,986 | £279,475 | £203,012 |
| 2004-05 | £231,368 | £415,416 | £363,978 | £282,439 | £205,133 |
| 2004-06 | £236,388 | £421,606 | £371,751 | £288,629 | £209,589 |
| 2004-07 | £239,329 | £428,140 | £377,654 | £292,702 | £211,983 |
| 2004-08 | £247,224 | £443,459 | £390,872 | £302,591 | £218,860 |
| 2004-09 | £250,236 | £452,295 | £397,230 | £306,916 | £221,240 |
| 2004-10 | £247,049 | £443,535 | £389,519 | £301,786 | £218,926 |
| 2004-11 | £243,815 | £436,511 | £383,360 | £297,408 | £216,247 |
| 2004-12 | £243,226 | £430,070 | £379,269 | £295,747 | £216,203 |
| 2005-01 | £242,714 | £429,139 | £378,208 | £295,725 | £215,603 |
| 2005-02 | £240,652 | £424,584 | £376,396 | £293,877 | £213,534 |
| 2005-03 | £236,438 | £418,920 | £371,469 | £289,784 | £209,403 |
| 2005-04 | £237,185 | £418,895 | £373,563 | £291,205 | £209,903 |
| 2005-05 | £238,467 | £421,895 | £374,118 | £292,713 | £211,120 |
| 2005-06 | £243,421 | £429,144 | £381,404 | £299,367 | £215,398 |
| 2005-07 | £250,382 | £443,042 | £393,221 | £308,346 | £221,394 |
| 2005-08 | £252,351 | £447,934 | £396,660 | £311,345 | £222,961 |
| 2005-09 | £254,068 | £452,806 | £399,983 | £313,634 | £224,388 |
| 2005-10 | £247,401 | £439,986 | £388,083 | £305,045 | £218,667 |
| 2005-11 | £248,499 | £440,169 | £389,659 | £306,438 | £219,649 |
| 2005-12 | £248,315 | £436,516 | £387,326 | £305,396 | £219,824 |
| 2006-01 | £253,462 | £446,505 | £396,449 | £312,584 | £224,104 |
| 2006-02 | £250,885 | £440,814 | £392,803 | £309,532 | £221,781 |
| 2006-03 | £252,547 | £447,571 | £398,502 | £313,069 | £222,690 |
| 2006-04 | £254,534 | £451,232 | £401,380 | £315,735 | £224,404 |
| 2006-05 | £263,839 | £469,279 | £416,340 | £327,250 | £232,590 |
| 2006-06 | £266,875 | £472,509 | £420,395 | £330,747 | £235,384 |
| 2006-07 | £272,252 | £482,559 | £430,286 | £338,623 | £239,755 |
| 2006-08 | £275,726 | £489,643 | £436,437 | £344,473 | £242,398 |
| 2006-09 | £280,099 | £501,347 | £444,701 | £350,584 | £245,990 |
| 2006-10 | £281,086 | £502,401 | £444,949 | £350,686 | £247,205 |
| 2006-11 | £280,440 | £501,028 | £443,960 | £349,426 | £246,748 |
| 2006-12 | £281,637 | £500,594 | £445,364 | £351,021 | £247,816 |
| 2007-01 | £286,101 | £509,992 | £453,506 | £357,065 | £251,563 |
| 2007-02 | £291,626 | £518,320 | £461,172 | £362,775 | £256,719 |
| 2007-03 | £299,395 | £532,650 | £473,603 | £373,095 | £263,394 |
| 2007-04 | £303,850 | £538,584 | £480,415 | £379,876 | £267,071 |
| 2007-05 | £310,944 | £549,250 | £491,196 | £389,714 | £273,123 |
| 2007-06 | £321,285 | £566,830 | £507,238 | £402,463 | £282,269 |
| 2007-07 | £327,315 | £580,281 | £518,484 | £410,145 | £287,452 |
| 2007-08 | £337,306 | £603,111 | £537,046 | £424,607 | £295,665 |
| 2007-09 | £340,822 | £612,817 | £544,940 | £429,382 | £298,558 |
| 2007-10 | £342,834 | £614,129 | £544,443 | £430,198 | £300,855 |
| 2007-11 | £338,778 | £607,465 | £537,467 | £423,445 | £297,671 |
| 2007-12 | £330,937 | £591,380 | £522,197 | £412,485 | £291,159 |
| 2008-01 | £329,645 | £592,123 | £521,206 | £410,906 | £289,953 |
| 2008-02 | £324,462 | £584,091 | £514,086 | £404,972 | £285,253 |
| 2008-03 | £325,759 | £585,685 | £517,575 | £407,966 | £286,074 |
| 2008-04 | £327,182 | £587,414 | £520,766 | £411,578 | £286,939 |
| 2008-05 | £324,111 | £581,572 | £516,310 | £408,694 | £284,041 |
| 2008-06 | £317,522 | £572,651 | £507,124 | £401,003 | £278,079 |
| 2008-07 | £315,859 | £570,798 | £506,272 | £398,929 | £276,547 |
| 2008-08 | £317,630 | £576,427 | £510,298 | £401,254 | £278,022 |
| 2008-09 | £323,732 | £591,141 | £518,408 | £407,762 | £283,629 |
| 2008-10 | £309,773 | £564,660 | £493,462 | £388,728 | £271,781 |
| 2008-11 | £295,118 | £535,211 | £467,884 | £369,453 | £259,194 |
| 2008-12 | £284,954 | £514,852 | £452,933 | £357,769 | £250,037 |
| 2009-01 | £281,348 | £514,037 | £448,993 | £353,034 | £246,809 |
| 2009-02 | £281,465 | £515,773 | £450,180 | £352,790 | £246,918 |
| 2009-03 | £272,983 | £500,343 | £435,979 | £341,110 | £239,682 |
| 2009-04 | £264,672 | £479,416 | £421,371 | £331,311 | £232,341 |
| 2009-05 | £269,736 | £486,497 | £429,219 | £339,251 | £236,413 |
| 2009-06 | £276,385 | £498,569 | £440,676 | £349,347 | £241,772 |
| 2009-07 | £289,613 | £526,865 | £465,826 | £368,947 | £252,425 |
| 2009-08 | £292,464 | £535,451 | £472,933 | £374,303 | £254,355 |
| 2009-09 | £296,202 | £543,698 | £480,892 | £380,332 | £257,210 |
| 2009-10 | £302,850 | £556,337 | £492,421 | £389,208 | £262,866 |
| 2009-11 | £304,700 | £562,541 | £495,365 | £392,662 | £264,194 |
| 2009-12 | £301,854 | £556,941 | £491,432 | £389,731 | £261,523 |
| 2010-01 | £305,989 | £568,457 | £500,056 | £397,408 | £264,442 |
| 2010-02 | £306,982 | £571,039 | £505,042 | £400,058 | £264,822 |
| 2010-03 | £315,847 | £588,787 | £519,394 | £411,166 | £272,577 |
| 2010-04 | £315,047 | £584,936 | £517,265 | £408,981 | £272,205 |
| 2010-05 | £318,281 | £590,952 | £520,689 | £412,137 | £275,330 |
| 2010-06 | £319,015 | £593,606 | £523,886 | £414,906 | £275,436 |
| 2010-07 | £325,115 | £610,969 | £536,934 | £425,038 | £280,013 |
| 2010-08 | £330,665 | £624,251 | £549,097 | £434,262 | £284,179 |
| 2010-09 | £328,777 | £625,228 | £547,821 | £432,877 | £282,186 |
| 2010-10 | £323,779 | £614,652 | £538,782 | £425,439 | £278,133 |
| 2010-11 | £314,896 | £599,882 | £523,236 | £412,315 | £270,856 |
| 2010-12 | £313,089 | £595,201 | £521,298 | £409,450 | £269,375 |
| 2011-01 | £310,814 | £591,114 | £518,779 | £406,803 | £267,280 |
| 2011-02 | £314,176 | £596,670 | £524,736 | £410,644 | £270,307 |
| 2011-03 | £314,311 | £602,209 | £525,438 | £411,099 | £270,299 |
| 2011-04 | £319,604 | £612,839 | £533,274 | £417,260 | £275,084 |
| 2011-05 | £321,216 | £610,708 | £532,811 | £418,751 | £276,841 |
| 2011-06 | £325,952 | £612,822 | £538,700 | £424,078 | £281,288 |
| 2011-07 | £326,105 | £609,816 | £538,322 | £424,676 | £281,388 |
| 2011-08 | £334,643 | £633,724 | £559,551 | £439,425 | £287,431 |
| 2011-09 | £336,099 | £641,912 | £565,230 | £443,366 | £287,979 |
| 2011-10 | £338,765 | £652,632 | £573,427 | £447,596 | £289,843 |
| 2011-11 | £332,509 | £637,094 | £560,132 | £437,136 | £285,180 |
| 2011-12 | £331,438 | £633,176 | £556,538 | £434,342 | £284,701 |
| 2012-01 | £330,013 | £631,379 | £555,898 | £433,844 | £283,056 |
| 2012-02 | £335,443 | £647,009 | £568,729 | £444,027 | £286,758 |
| 2012-03 | £336,717 | £649,452 | £571,787 | £446,258 | £287,655 |
| 2012-04 | £341,391 | £655,764 | £576,208 | £451,401 | £292,093 |
| 2012-05 | £346,768 | £661,294 | £581,182 | £456,694 | £297,363 |
| 2012-06 | £356,774 | £681,324 | £598,265 | £472,312 | £305,358 |
| 2012-07 | £358,908 | £688,225 | £604,476 | £476,777 | £306,649 |
| 2012-08 | £362,266 | £700,545 | £613,843 | £484,454 | £308,541 |
| 2012-09 | £357,992 | £692,631 | £607,252 | £478,629 | £304,889 |
| 2012-10 | £362,294 | £699,117 | £612,905 | £483,859 | £308,772 |
| 2012-11 | £357,992 | £688,687 | £604,204 | £477,392 | £305,359 |
| 2012-12 | £360,139 | £697,488 | £609,505 | £480,906 | £306,919 |
| 2013-01 | £355,048 | £689,442 | £604,574 | £474,821 | £302,213 |
| 2013-02 | £364,932 | £708,734 | £623,046 | £487,796 | £310,574 |
| 2013-03 | £370,630 | £716,254 | £631,611 | £493,719 | £315,814 |
| 2013-04 | £375,897 | £724,693 | £638,219 | £501,039 | £320,352 |
| 2013-05 | £371,050 | £712,180 | £629,057 | £494,411 | £316,314 |
| 2013-06 | £375,912 | £721,303 | £639,061 | £503,028 | £319,982 |
| 2013-07 | £386,740 | £740,439 | £658,046 | £518,504 | £329,002 |
| 2013-08 | £393,217 | £756,036 | £672,047 | £529,520 | £333,929 |
| 2013-09 | £404,038 | £778,926 | £689,017 | £543,050 | £343,360 |
| 2013-10 | £414,816 | £803,103 | £706,770 | £556,135 | £352,784 |
| 2013-11 | £421,832 | £814,776 | £714,941 | £563,088 | £359,379 |
| 2013-12 | £428,622 | £824,854 | £725,137 | £571,179 | £365,425 |
| 2014-01 | £422,966 | £816,232 | £716,567 | £563,283 | £360,614 |
| 2014-02 | £434,890 | £843,840 | £737,589 | £578,705 | £370,763 |
| 2014-03 | £430,146 | £837,758 | £730,233 | £572,207 | £366,625 |
| 2014-04 | £442,898 | £860,120 | £751,130 | £590,087 | £377,403 |
| 2014-05 | £453,844 | £877,328 | £769,267 | £605,525 | £386,644 |
| 2014-06 | £466,227 | £901,257 | £790,385 | £622,890 | £397,076 |
| 2014-07 | £477,471 | £926,996 | £811,391 | £639,148 | £406,415 |
| 2014-08 | £480,985 | £941,073 | £821,088 | £646,105 | £408,969 |
| 2014-09 | £495,152 | £971,030 | £847,395 | £666,393 | £420,777 |
| 2014-10 | £496,700 | £973,782 | £849,349 | £666,788 | £422,340 |
| 2014-11 | £490,073 | £957,917 | £835,766 | £655,905 | £417,045 |
| 2014-12 | £479,085 | £932,901 | £814,059 | £638,941 | £408,097 |
| 2015-01 | £472,350 | £919,918 | £803,523 | £629,973 | £402,333 |
| 2015-02 | £469,549 | £917,201 | £800,800 | £626,093 | £399,890 |
| 2015-03 | £474,431 | £928,469 | £809,202 | £631,828 | £404,242 |
| 2015-04 | £476,641 | £933,722 | £812,145 | £635,362 | £406,054 |
| 2015-05 | £492,317 | £961,715 | £837,236 | £655,565 | £419,594 |
| 2015-06 | £500,785 | £981,497 | £855,499 | £670,690 | £426,031 |
| 2015-07 | £518,815 | £1,015,780 | £887,202 | £695,256 | £441,276 |
| 2015-08 | £534,734 | £1,049,617 | £915,068 | £718,688 | £454,439 |
| 2015-09 | £544,088 | £1,069,618 | £929,434 | £729,723 | £462,686 |
| 2015-10 | £534,414 | £1,050,897 | £911,334 | £716,418 | £454,567 |
| 2015-11 | £521,626 | £1,026,123 | £889,960 | £698,809 | £443,746 |
| 2015-12 | £518,704 | £1,023,030 | £886,939 | £695,222 | £441,121 |
| 2016-01 | £525,815 | £1,040,391 | £904,172 | £705,406 | £446,864 |
| 2016-02 | £537,391 | £1,066,180 | £926,772 | £721,024 | £456,575 |
| 2016-03 | £548,679 | £1,084,429 | £944,253 | £735,029 | £466,445 |
| 2016-04 | £550,344 | £1,085,955 | £942,338 | £736,178 | £468,215 |
| 2016-05 | £546,893 | £1,069,373 | £928,529 | £728,957 | £466,040 |
| 2016-06 | £545,804 | £1,070,207 | £925,111 | £726,439 | £465,325 |
| 2016-07 | £559,534 | £1,097,433 | £949,144 | £745,094 | £476,940 |
| 2016-08 | £567,232 | £1,118,136 | £964,447 | £755,973 | £483,286 |
| 2016-09 | £567,761 | £1,116,875 | £966,842 | £756,761 | £483,682 |
| 2016-10 | £558,414 | £1,095,234 | £948,000 | £740,060 | £476,533 |
| 2016-11 | £554,143 | £1,087,902 | £938,861 | £731,632 | £473,404 |
| 2016-12 | £548,167 | £1,077,483 | £926,355 | £721,604 | £468,727 |
| 2017-01 | £545,653 | £1,071,960 | £920,211 | £718,726 | £466,580 |
| 2017-02 | £543,024 | £1,062,087 | £911,871 | £712,831 | £464,885 |
| 2017-03 | £544,921 | £1,065,453 | £913,007 | £713,884 | £466,824 |
| 2017-04 | £545,426 | £1,068,190 | £912,415 | £712,954 | £467,557 |
| 2017-05 | £554,664 | £1,082,393 | £926,594 | £723,231 | £475,827 |
| 2017-06 | £562,007 | £1,091,485 | £936,335 | £732,595 | £482,267 |
| 2017-07 | £570,376 | £1,104,698 | £951,168 | £743,651 | £489,404 |
| 2017-08 | £568,783 | £1,105,448 | £952,513 | £746,751 | £487,045 |
| 2017-09 | £567,661 | £1,105,879 | £954,059 | £747,169 | £485,653 |
| 2017-10 | £560,601 | £1,098,856 | £946,572 | £740,148 | £479,075 |
| 2017-11 | £552,603 | £1,083,048 | £933,151 | £728,050 | £472,486 |
| 2017-12 | £545,087 | £1,069,148 | £920,447 | £718,441 | £466,009 |
| 2018-01 | £550,435 | £1,075,220 | £928,591 | £724,337 | £470,811 |
| 2018-02 | £549,221 | £1,078,801 | £928,458 | £723,156 | £469,611 |
| 2018-03 | £546,268 | £1,073,512 | £926,547 | £720,188 | £466,850 |
| 2018-04 | £552,608 | £1,091,124 | £940,559 | £732,368 | £471,591 |
| 2018-05 | £555,554 | £1,103,229 | £951,970 | £740,639 | £473,251 |
| 2018-06 | £562,102 | £1,117,992 | £965,860 | £749,859 | £478,672 |
| 2018-07 | £548,505 | £1,096,454 | £944,485 | £732,762 | £466,866 |
| 2018-08 | £539,162 | £1,071,241 | £926,039 | £720,089 | £459,032 |
| 2018-09 | £531,014 | £1,057,444 | £913,538 | £710,958 | £451,785 |
| 2018-10 | £541,027 | £1,068,731 | £927,113 | £721,479 | £460,863 |
| 2018-11 | £548,850 | £1,090,486 | £943,458 | £732,968 | £467,267 |
| 2018-12 | £547,147 | £1,086,186 | £938,037 | £727,838 | £466,314 |
| 2019-01 | £537,251 | £1,071,528 | £923,980 | £715,749 | £457,620 |
| 2019-02 | £530,614 | £1,057,068 | £910,931 | £705,251 | £452,254 |
| 2019-03 | £532,724 | £1,065,197 | £917,818 | £711,686 | £453,390 |
| 2019-04 | £534,968 | £1,069,420 | £921,808 | £717,272 | £454,901 |
| 2019-05 | £530,328 | £1,057,645 | £915,937 | £714,187 | £450,419 |
| 2019-06 | £540,004 | £1,076,126 | £933,281 | £728,230 | £458,466 |
| 2019-07 | £546,002 | £1,083,981 | £943,554 | £735,772 | £463,669 |
| 2019-08 | £556,727 | £1,113,550 | £965,967 | £753,291 | £472,140 |
| 2019-09 | £555,274 | £1,110,767 | £962,496 | £752,437 | £470,769 |
| 2019-10 | £549,428 | £1,104,315 | £957,319 | £745,471 | £465,472 |
| 2019-11 | £553,298 | £1,108,923 | £964,375 | £748,896 | £469,031 |
| 2019-12 | £557,289 | £1,115,462 | £972,010 | £753,510 | £472,520 |
| 2020-01 | £560,049 | £1,121,233 | £976,878 | £758,555 | £474,657 |
| 2020-02 | £554,805 | £1,118,144 | £971,303 | £753,970 | £469,584 |
| 2020-03 | £551,841 | £1,120,183 | £971,948 | £752,438 | £466,429 |
| 2020-04 | £538,001 | £1,098,097 | £949,451 | £736,378 | £454,143 |
| 2020-05 | £543,522 | £1,099,567 | £954,338 | £740,152 | £459,700 |
| 2020-06 | £552,494 | £1,110,328 | £968,759 | £753,436 | £467,193 |
| 2020-07 | £572,980 | £1,148,702 | £1,004,480 | £781,411 | £484,529 |
| 2020-08 | £579,325 | £1,172,119 | £1,024,090 | £797,044 | £488,304 |
| 2020-09 | £582,791 | £1,192,030 | £1,038,310 | £806,804 | £489,989 |
| 2020-10 | £580,331 | £1,196,413 | £1,038,582 | £807,417 | £487,007 |
| 2020-11 | £579,400 | £1,193,306 | £1,033,717 | £806,010 | £486,383 |
| 2020-12 | £572,048 | £1,179,046 | £1,019,321 | £796,928 | £480,071 |
| 2021-01 | £578,071 | £1,178,831 | £1,022,704 | £800,884 | £486,237 |
| 2021-02 | £573,989 | £1,161,254 | £1,009,637 | £791,303 | £483,752 |
| 2021-03 | £585,754 | £1,167,767 | £1,019,212 | £800,036 | £495,465 |
| 2021-04 | £580,904 | £1,156,359 | £1,008,461 | £791,912 | £491,715 |
| 2021-05 | £586,152 | £1,167,009 | £1,016,880 | £798,611 | £496,260 |
| 2021-06 | £572,530 | £1,140,633 | £993,546 | £783,937 | £484,064 |
| 2021-07 | £558,412 | £1,107,800 | £967,162 | £762,677 | £472,555 |
| 2021-08 | £554,902 | £1,119,120 | £973,396 | £762,743 | £468,208 |
| 2021-09 | £558,164 | £1,136,317 | £986,099 | £767,814 | £470,530 |
| 2021-10 | £570,270 | £1,191,691 | £1,022,687 | £790,230 | £479,013 |
| 2021-11 | £572,904 | £1,197,144 | £1,027,152 | £793,288 | £481,332 |
| 2021-12 | £573,243 | £1,215,222 | £1,035,024 | £796,698 | £480,767 |
| 2022-01 | £573,879 | £1,213,412 | £1,038,777 | £800,328 | £480,771 |
| 2022-02 | £577,570 | £1,217,045 | £1,042,313 | £804,163 | £484,338 |
| 2022-03 | £568,952 | £1,198,035 | £1,029,055 | £791,705 | £477,110 |
| 2022-04 | £568,769 | £1,197,419 | £1,027,175 | £792,640 | £476,787 |
| 2022-05 | £563,781 | £1,195,449 | £1,025,567 | £790,348 | £471,350 |
| 2022-06 | £569,314 | £1,200,189 | £1,032,193 | £798,362 | £476,108 |
| 2022-07 | £575,541 | £1,214,498 | £1,046,733 | £809,803 | £480,664 |
| 2022-08 | £594,977 | £1,258,152 | £1,084,883 | £841,420 | £495,957 |
| 2022-09 | £603,542 | £1,288,661 | £1,108,749 | £858,968 | £501,654 |
| 2022-10 | £607,388 | £1,298,039 | £1,115,449 | £864,499 | £504,846 |
| 2022-11 | £594,776 | £1,271,832 | £1,091,317 | £845,366 | £494,619 |
| 2022-12 | £586,042 | £1,247,524 | £1,070,811 | £830,693 | £487,993 |
| 2023-01 | £580,515 | £1,237,351 | £1,064,905 | £822,679 | £483,255 |
| 2023-02 | £584,032 | £1,242,161 | £1,070,988 | £825,927 | £486,560 |
| 2023-03 | £589,011 | £1,256,431 | £1,083,489 | £830,357 | £491,084 |
| 2023-04 | £590,387 | £1,258,590 | £1,084,640 | £831,102 | £492,528 |
| 2023-05 | £577,229 | £1,221,257 | £1,057,310 | £811,618 | £481,930 |
| 2023-06 | £563,141 | £1,185,811 | £1,031,522 | £795,718 | £469,429 |
| 2023-07 | £567,603 | £1,193,423 | £1,043,627 | £805,723 | £472,276 |
| 2023-08 | £575,015 | £1,214,506 | £1,062,513 | £820,496 | £477,357 |
| 2023-09 | £594,709 | £1,257,478 | £1,100,110 | £849,832 | £493,409 |
| 2023-10 | £589,227 | £1,240,279 | £1,085,295 | £839,250 | £489,622 |
| 2023-11 | £585,894 | £1,235,798 | £1,079,776 | £831,410 | £487,417 |
| 2023-12 | £569,140 | £1,196,310 | £1,045,637 | £804,438 | £474,266 |
| 2024-01 | £560,564 | £1,177,501 | £1,028,685 | £793,182 | £467,003 |
| 2024-02 | £552,962 | £1,157,888 | £1,013,252 | £783,638 | £460,516 |
| 2024-03 | £555,563 | £1,164,931 | £1,016,684 | £786,357 | £462,855 |
| 2024-04 | £560,794 | £1,173,832 | £1,026,309 | £792,839 | £467,381 |
| 2024-05 | £566,183 | £1,179,788 | £1,031,196 | £798,615 | £472,416 |
| 2024-06 | £560,421 | £1,162,344 | £1,019,050 | £792,207 | £467,408 |
| 2024-07 | £563,483 | £1,173,103 | £1,028,274 | £801,026 | £469,029 |
| 2024-08 | £570,507 | £1,192,350 | £1,044,591 | £815,715 | £473,906 |
| 2024-09 | £580,865 | £1,224,745 | £1,071,390 | £834,002 | £481,550 |
| 2024-10 | £574,119 | £1,208,513 | £1,055,378 | £821,609 | £476,567 |
| 2024-11 | £568,285 | £1,198,498 | £1,045,550 | £812,458 | £471,812 |
| 2024-12 | £572,344 | £1,210,816 | £1,051,101 | £817,817 | £475,308 |
| 2025-01 | £573,843 | £1,217,391 | £1,056,577 | £822,441 | £476,007 |
| 2025-02 | £569,086 | £1,204,797 | £1,047,212 | £816,638 | £471,916 |
| 2025-03 | £560,269 | £1,157,731 | £1,019,543 | £800,067 | £465,814 |
| 2025-04 | £555,552 | £1,159,899 | £1,019,895 | £796,085 | £461,079 |
| 2025-05 | £554,869 | £1,168,260 | £1,025,520 | £797,861 | £459,777 |
| 2025-06 | £558,282 | £1,200,450 | £1,049,262 | £811,384 | £460,453 |
| 2025-07 | £565,792 | £1,209,330 | £1,059,886 | £824,349 | £466,486 |
| 2025-08 | £570,313 | £1,219,253 | £1,073,702 | £835,991 | £469,244 |
| 2025-09 | £568,176 | £1,219,323 | £1,074,095 | £837,264 | £466,624 |
| 2025-10 | £557,079 | £1,199,397 | £1,057,510 | £822,557 | £457,085 |
| 2025-11 | £541,986 | £1,163,898 | £1,026,547 | £800,390 | £444,777 |
| 2025-12 | £532,742 | £1,139,143 | £1,005,928 | £784,104 | £437,733 |
| 2026-01 | £542,125 | £1,159,674 | £1,026,097 | £801,099 | £444,870 |
| 2026-02 | £552,304 | £1,182,818 | £1,046,114 | £814,654 | £453,412 |
| 2026-03 | £554,128 | £1,183,081 | £1,050,427 | £820,993 | £454,315 |
- All property types
- Detached
- Semi-detached
- Terraced
- Flats
Source: HM Land Registry House Price Index
| Year | All property types | Detached | Semi-detached | Terraced | Flats |
|---|---|---|---|---|---|
| 1996-01 | +1.5% | -0.6% | +1.4% | +1.3% | +1.8% |
| 1996-02 | +10.6% | +9.7% | +10.6% | +10.0% | +11.2% |
| 1996-03 | +8.2% | +8.5% | +8.9% | +7.6% | +8.5% |
| 1996-04 | +7.9% | +9.5% | +8.5% | +7.1% | +8.5% |
| 1996-05 | +3.4% | +4.4% | +3.7% | +3.2% | +3.5% |
| 1996-06 | +6.7% | +6.9% | +6.6% | +6.8% | +6.5% |
| 1996-07 | +6.0% | +5.9% | +6.5% | +6.4% | +5.7% |
| 1996-08 | +5.8% | +5.8% | +6.6% | +6.2% | +5.4% |
| 1996-09 | +4.0% | +4.0% | +4.6% | +4.2% | +3.9% |
| 1996-10 | +3.9% | +4.4% | +4.5% | +4.5% | +3.4% |
| 1996-11 | +7.8% | +8.4% | +8.5% | +8.9% | +6.8% |
| 1996-12 | +11.2% | +12.4% | +12.2% | +12.6% | +9.8% |
| 1997-01 | +13.8% | +15.3% | +15.0% | +15.4% | +12.1% |
| 1997-02 | +9.3% | +11.2% | +10.3% | +10.7% | +8.0% |
| 1997-03 | +10.4% | +11.6% | +10.8% | +11.9% | +9.0% |
| 1997-04 | +8.5% | +9.7% | +9.5% | +10.3% | +6.9% |
| 1997-05 | +13.5% | +14.9% | +15.2% | +15.2% | +11.7% |
| 1997-06 | +16.2% | +19.5% | +19.1% | +18.3% | +14.0% |
| 1997-07 | +24.6% | +27.9% | +26.9% | +26.7% | +22.6% |
| 1997-08 | +26.3% | +29.1% | +28.0% | +28.3% | +24.5% |
| 1997-09 | +26.9% | +28.2% | +28.5% | +28.6% | +25.3% |
| 1997-10 | +23.4% | +24.1% | +25.0% | +24.9% | +22.0% |
| 1997-11 | +24.6% | +25.9% | +26.6% | +26.3% | +23.0% |
| 1997-12 | +24.5% | +25.8% | +26.3% | +25.9% | +23.1% |
| 1998-01 | +23.0% | +24.9% | +24.8% | +24.2% | +21.7% |
| 1998-02 | +23.1% | +23.7% | +24.3% | +24.1% | +22.0% |
| 1998-03 | +22.1% | +22.7% | +23.2% | +22.7% | +21.2% |
| 1998-04 | +25.5% | +26.0% | +26.9% | +26.2% | +24.5% |
| 1998-05 | +22.7% | +23.2% | +23.8% | +23.5% | +21.8% |
| 1998-06 | +22.8% | +22.3% | +23.0% | +23.2% | +22.4% |
| 1998-07 | +17.3% | +16.8% | +17.6% | +17.5% | +17.1% |
| 1998-08 | +19.2% | +19.0% | +19.7% | +19.4% | +19.0% |
| 1998-09 | +17.0% | +18.2% | +18.1% | +17.6% | +16.5% |
| 1998-10 | +19.9% | +20.4% | +20.1% | +20.0% | +19.8% |
| 1998-11 | +16.2% | +16.4% | +16.0% | +15.6% | +16.4% |
| 1998-12 | +15.1% | +14.3% | +14.5% | +14.2% | +15.6% |
| 1999-01 | +10.3% | +9.3% | +10.0% | +9.3% | +10.8% |
| 1999-02 | +10.1% | +9.7% | +10.6% | +9.8% | +10.2% |
| 1999-03 | +10.3% | +9.9% | +10.7% | +10.0% | +10.5% |
| 1999-04 | +12.4% | +11.7% | +12.2% | +12.4% | +12.5% |
| 1999-05 | +13.1% | +11.3% | +12.2% | +12.5% | +13.6% |
| 1999-06 | +7.7% | +6.1% | +7.2% | +7.6% | +7.9% |
| 1999-07 | +8.7% | +7.5% | +8.4% | +8.6% | +8.8% |
| 1999-08 | +9.9% | +8.5% | +9.6% | +10.2% | +9.8% |
| 1999-09 | +15.6% | +13.6% | +14.7% | +15.5% | +15.8% |
| 1999-10 | +17.4% | +15.5% | +16.9% | +17.3% | +17.7% |
| 1999-11 | +19.3% | +17.2% | +18.8% | +19.4% | +19.4% |
| 1999-12 | +20.6% | +18.4% | +19.9% | +20.9% | +20.7% |
| 2000-01 | +24.4% | +23.0% | +24.1% | +25.1% | +24.1% |
| 2000-02 | +26.7% | +25.7% | +25.9% | +27.1% | +26.6% |
| 2000-03 | +28.1% | +28.3% | +28.3% | +29.1% | +27.4% |
| 2000-04 | +30.0% | +29.3% | +29.5% | +30.3% | +29.6% |
| 2000-05 | +29.2% | +28.8% | +29.3% | +29.5% | +28.9% |
| 2000-06 | +32.7% | +31.3% | +32.0% | +31.9% | +32.9% |
| 2000-07 | +26.4% | +25.7% | +26.2% | +25.4% | +26.7% |
| 2000-08 | +25.7% | +24.9% | +25.0% | +23.5% | +26.6% |
| 2000-09 | +23.7% | +23.5% | +23.1% | +21.3% | +24.7% |
| 2000-10 | +25.4% | +24.8% | +24.8% | +23.2% | +26.1% |
| 2000-11 | +27.4% | +27.1% | +26.7% | +25.3% | +28.0% |
| 2000-12 | +24.4% | +24.2% | +23.8% | +22.3% | +24.9% |
| 2001-01 | +21.8% | +20.3% | +19.8% | +19.4% | +22.7% |
| 2001-02 | +14.6% | +12.5% | +12.9% | +12.5% | +15.4% |
| 2001-03 | +14.1% | +11.4% | +12.1% | +12.0% | +15.2% |
| 2001-04 | +10.3% | +9.2% | +9.1% | +8.5% | +11.0% |
| 2001-05 | +13.2% | +12.7% | +11.7% | +11.6% | +14.0% |
| 2001-06 | +11.5% | +10.9% | +9.8% | +10.0% | +12.3% |
| 2001-07 | +14.0% | +12.0% | +11.8% | +12.4% | +14.8% |
| 2001-08 | +12.2% | +9.7% | +9.9% | +11.1% | +13.0% |
| 2001-09 | +9.7% | +7.0% | +7.4% | +8.9% | +10.3% |
| 2001-10 | +7.0% | +4.9% | +5.0% | +6.3% | +7.5% |
| 2001-11 | +3.7% | +1.7% | +2.2% | +2.9% | +4.3% |
| 2001-12 | +5.8% | +3.6% | +4.5% | +4.9% | +6.4% |
| 2002-01 | +10.6% | +8.3% | +9.4% | +9.1% | +11.5% |
| 2002-02 | +14.5% | +12.2% | +13.1% | +12.9% | +15.5% |
| 2002-03 | +14.8% | +12.2% | +13.2% | +12.9% | +15.9% |
| 2002-04 | +12.4% | +8.8% | +10.3% | +10.2% | +13.6% |
| 2002-05 | +10.2% | +6.2% | +8.3% | +7.7% | +11.5% |
| 2002-06 | +11.3% | +7.5% | +9.2% | +9.0% | +12.6% |
| 2002-07 | +13.7% | +10.4% | +11.7% | +11.8% | +14.8% |
| 2002-08 | +17.8% | +14.7% | +15.8% | +16.0% | +18.9% |
| 2002-09 | +19.9% | +17.0% | +18.6% | +18.3% | +20.8% |
| 2002-10 | +20.7% | +17.8% | +19.6% | +19.0% | +21.6% |
| 2002-11 | +20.6% | +17.9% | +19.3% | +19.1% | +21.4% |
| 2002-12 | +20.3% | +18.0% | +19.2% | +19.0% | +21.0% |
| 2003-01 | +15.7% | +13.9% | +14.6% | +15.1% | +16.2% |
| 2003-02 | +16.4% | +14.4% | +15.5% | +15.4% | +16.9% |
| 2003-03 | +13.7% | +11.7% | +12.5% | +12.6% | +14.4% |
| 2003-04 | +14.2% | +12.2% | +13.6% | +13.1% | +14.8% |
| 2003-05 | +8.8% | +7.2% | +8.6% | +8.5% | +9.0% |
| 2003-06 | +5.8% | +4.6% | +6.2% | +5.6% | +5.8% |
| 2003-07 | +3.0% | +1.4% | +3.1% | +2.6% | +3.1% |
| 2003-08 | +1.7% | +0.1% | +1.9% | +1.4% | +1.9% |
| 2003-09 | +1.5% | -0.5% | +1.7% | +1.5% | +1.6% |
| 2003-10 | +1.4% | -0.5% | +1.3% | +1.8% | +1.3% |
| 2003-11 | +2.3% | 0.0% | +2.0% | +2.7% | +2.2% |
| 2003-12 | +0.9% | -1.6% | +0.2% | +1.4% | +0.8% |
| 2004-01 | +3.3% | +1.1% | +3.3% | +3.8% | +3.2% |
| 2004-02 | +2.1% | +0.4% | +2.3% | +3.0% | +1.8% |
| 2004-03 | +4.7% | +3.2% | +5.2% | +5.8% | +4.2% |
| 2004-04 | +6.0% | +4.1% | +6.1% | +7.7% | +5.3% |
| 2004-05 | +9.6% | +6.8% | +9.0% | +10.9% | +9.2% |
| 2004-06 | +12.2% | +8.8% | +11.6% | +13.5% | +11.8% |
| 2004-07 | +12.9% | +9.7% | +12.5% | +14.1% | +12.5% |
| 2004-08 | +13.4% | +10.5% | +13.2% | +14.6% | +12.9% |
| 2004-09 | +13.1% | +10.5% | +12.7% | +13.9% | +12.9% |
| 2004-10 | +11.8% | +8.5% | +10.9% | +12.2% | +11.7% |
| 2004-11 | +10.3% | +7.0% | +9.4% | +10.7% | +10.2% |
| 2004-12 | +10.0% | +6.5% | +8.9% | +10.6% | +10.0% |
| 2005-01 | +6.6% | +2.8% | +5.0% | +7.1% | +6.5% |
| 2005-02 | +6.2% | +2.4% | +4.8% | +6.7% | +6.1% |
| 2005-03 | +3.6% | +0.3% | +2.7% | +4.3% | +3.4% |
| 2005-04 | +3.5% | +1.0% | +3.2% | +4.2% | +3.4% |
| 2005-05 | +3.1% | +1.6% | +2.8% | +3.6% | +2.9% |
| 2005-06 | +3.0% | +1.8% | +2.6% | +3.7% | +2.8% |
| 2005-07 | +4.6% | +3.5% | +4.1% | +5.3% | +4.4% |
| 2005-08 | +2.1% | +1.0% | +1.5% | +2.9% | +1.9% |
| 2005-09 | +1.5% | +0.1% | +0.7% | +2.2% | +1.4% |
| 2005-10 | +0.1% | -0.8% | -0.4% | +1.1% | -0.1% |
| 2005-11 | +1.9% | +0.8% | +1.6% | +3.0% | +1.6% |
| 2005-12 | +2.1% | +1.5% | +2.1% | +3.3% | +1.7% |
| 2006-01 | +4.4% | +4.0% | +4.8% | +5.7% | +3.9% |
| 2006-02 | +4.3% | +3.8% | +4.4% | +5.3% | +3.9% |
| 2006-03 | +6.8% | +6.8% | +7.3% | +8.0% | +6.3% |
| 2006-04 | +7.3% | +7.7% | +7.4% | +8.4% | +6.9% |
| 2006-05 | +10.6% | +11.2% | +11.3% | +11.8% | +10.2% |
| 2006-06 | +9.6% | +10.1% | +10.2% | +10.5% | +9.3% |
| 2006-07 | +8.7% | +8.9% | +9.4% | +9.8% | +8.3% |
| 2006-08 | +9.3% | +9.3% | +10.0% | +10.6% | +8.7% |
| 2006-09 | +10.2% | +10.7% | +11.2% | +11.8% | +9.6% |
| 2006-10 | +13.6% | +14.2% | +14.7% | +15.0% | +13.1% |
| 2006-11 | +12.9% | +13.8% | +13.9% | +14.0% | +12.3% |
| 2006-12 | +13.4% | +14.7% | +15.0% | +14.9% | +12.7% |
| 2007-01 | +12.9% | +14.2% | +14.4% | +14.2% | +12.3% |
| 2007-02 | +16.2% | +17.6% | +17.4% | +17.2% | +15.8% |
| 2007-03 | +18.6% | +19.0% | +18.8% | +19.2% | +18.3% |
| 2007-04 | +19.4% | +19.4% | +19.7% | +20.3% | +19.0% |
| 2007-05 | +17.9% | +17.0% | +18.0% | +19.1% | +17.4% |
| 2007-06 | +20.4% | +20.0% | +20.7% | +21.7% | +19.9% |
| 2007-07 | +20.2% | +20.3% | +20.5% | +21.1% | +19.9% |
| 2007-08 | +22.3% | +23.2% | +23.1% | +23.3% | +22.0% |
| 2007-09 | +21.7% | +22.2% | +22.5% | +22.5% | +21.4% |
| 2007-10 | +22.0% | +22.2% | +22.4% | +22.7% | +21.7% |
| 2007-11 | +20.8% | +21.2% | +21.1% | +21.2% | +20.6% |
| 2007-12 | +17.5% | +18.1% | +17.3% | +17.5% | +17.5% |
| 2008-01 | +15.2% | +16.1% | +14.9% | +15.1% | +15.3% |
| 2008-02 | +11.3% | +12.7% | +11.5% | +11.6% | +11.1% |
| 2008-03 | +8.8% | +10.0% | +9.3% | +9.3% | +8.6% |
| 2008-04 | +7.7% | +9.1% | +8.4% | +8.3% | +7.4% |
| 2008-05 | +4.2% | +5.9% | +5.1% | +4.9% | +4.0% |
| 2008-06 | -1.2% | +1.0% | 0.0% | -0.4% | -1.5% |
| 2008-07 | -3.5% | -1.6% | -2.4% | -2.7% | -3.8% |
| 2008-08 | -5.8% | -4.4% | -5.0% | -5.5% | -6.0% |
| 2008-09 | -5.0% | -3.5% | -4.9% | -5.0% | -5.0% |
| 2008-10 | -9.6% | -8.1% | -9.4% | -9.6% | -9.7% |
| 2008-11 | -12.9% | -11.9% | -12.9% | -12.8% | -12.9% |
| 2008-12 | -13.9% | -12.9% | -13.3% | -13.3% | -14.1% |
| 2009-01 | -14.7% | -13.2% | -13.9% | -14.1% | -14.9% |
| 2009-02 | -13.3% | -11.7% | -12.4% | -12.9% | -13.4% |
| 2009-03 | -16.2% | -14.6% | -15.8% | -16.4% | -16.2% |
| 2009-04 | -19.1% | -18.4% | -19.1% | -19.5% | -19.0% |
| 2009-05 | -16.8% | -16.3% | -16.9% | -17.0% | -16.8% |
| 2009-06 | -13.0% | -12.9% | -13.1% | -12.9% | -13.1% |
| 2009-07 | -8.3% | -7.7% | -8.0% | -7.5% | -8.7% |
| 2009-08 | -7.9% | -7.1% | -7.3% | -6.7% | -8.5% |
| 2009-09 | -8.5% | -8.0% | -7.2% | -6.7% | -9.3% |
| 2009-10 | -2.2% | -1.5% | -0.2% | +0.1% | -3.3% |
| 2009-11 | +3.2% | +5.1% | +5.9% | +6.3% | +1.9% |
| 2009-12 | +5.9% | +8.2% | +8.5% | +8.9% | +4.6% |
| 2010-01 | +8.8% | +10.6% | +11.4% | +12.6% | +7.1% |
| 2010-02 | +9.1% | +10.7% | +12.2% | +13.4% | +7.3% |
| 2010-03 | +15.7% | +17.7% | +19.1% | +20.5% | +13.7% |
| 2010-04 | +19.0% | +22.0% | +22.8% | +23.4% | +17.2% |
| 2010-05 | +18.0% | +21.5% | +21.3% | +21.5% | +16.5% |
| 2010-06 | +15.4% | +19.1% | +18.9% | +18.8% | +13.9% |
| 2010-07 | +12.3% | +16.0% | +15.3% | +15.2% | +10.9% |
| 2010-08 | +13.1% | +16.6% | +16.1% | +16.0% | +11.7% |
| 2010-09 | +11.0% | +15.0% | +13.9% | +13.8% | +9.7% |
| 2010-10 | +6.9% | +10.5% | +9.4% | +9.3% | +5.8% |
| 2010-11 | +3.3% | +6.6% | +5.6% | +5.0% | +2.5% |
| 2010-12 | +3.7% | +6.9% | +6.1% | +5.1% | +3.0% |
| 2011-01 | +1.6% | +4.0% | +3.7% | +2.4% | +1.1% |
| 2011-02 | +2.3% | +4.5% | +3.9% | +2.6% | +2.1% |
| 2011-03 | -0.5% | +2.3% | +1.2% | 0.0% | -0.8% |
| 2011-04 | +1.4% | +4.8% | +3.1% | +2.0% | +1.1% |
| 2011-05 | +0.9% | +3.3% | +2.3% | +1.6% | +0.5% |
| 2011-06 | +2.2% | +3.2% | +2.8% | +2.2% | +2.1% |
| 2011-07 | +0.3% | -0.2% | +0.3% | -0.1% | +0.5% |
| 2011-08 | +1.2% | +1.5% | +1.9% | +1.2% | +1.1% |
| 2011-09 | +2.2% | +2.7% | +3.2% | +2.4% | +2.1% |
| 2011-10 | +4.6% | +6.2% | +6.4% | +5.2% | +4.2% |
| 2011-11 | +5.6% | +6.2% | +7.1% | +6.0% | +5.3% |
| 2011-12 | +5.9% | +6.4% | +6.8% | +6.1% | +5.7% |
| 2012-01 | +6.2% | +6.8% | +7.2% | +6.6% | +5.9% |
| 2012-02 | +6.8% | +8.4% | +8.4% | +8.1% | +6.1% |
| 2012-03 | +7.1% | +7.8% | +8.8% | +8.6% | +6.4% |
| 2012-04 | +6.8% | +7.0% | +8.1% | +8.2% | +6.2% |
| 2012-05 | +8.0% | +8.3% | +9.1% | +9.1% | +7.4% |
| 2012-06 | +9.5% | +11.2% | +11.1% | +11.4% | +8.6% |
| 2012-07 | +10.1% | +12.9% | +12.3% | +12.3% | +9.0% |
| 2012-08 | +8.3% | +10.5% | +9.7% | +10.2% | +7.3% |
| 2012-09 | +6.5% | +7.9% | +7.4% | +8.0% | +5.9% |
| 2012-10 | +6.9% | +7.1% | +6.9% | +8.1% | +6.5% |
| 2012-11 | +7.7% | +8.1% | +7.9% | +9.2% | +7.1% |
| 2012-12 | +8.7% | +10.2% | +9.5% | +10.7% | +7.8% |
| 2013-01 | +7.6% | +9.2% | +8.8% | +9.4% | +6.8% |
| 2013-02 | +8.8% | +9.5% | +9.6% | +9.9% | +8.3% |
| 2013-03 | +10.1% | +10.3% | +10.5% | +10.6% | +9.8% |
| 2013-04 | +10.1% | +10.5% | +10.8% | +11.0% | +9.7% |
| 2013-05 | +7.0% | +7.7% | +8.2% | +8.3% | +6.4% |
| 2013-06 | +5.4% | +5.9% | +6.8% | +6.5% | +4.8% |
| 2013-07 | +7.8% | +7.6% | +8.9% | +8.8% | +7.3% |
| 2013-08 | +8.5% | +7.9% | +9.5% | +9.3% | +8.2% |
| 2013-09 | +12.9% | +12.5% | +13.5% | +13.5% | +12.6% |
| 2013-10 | +14.5% | +14.9% | +15.3% | +14.9% | +14.3% |
| 2013-11 | +17.8% | +18.3% | +18.3% | +18.0% | +17.7% |
| 2013-12 | +19.0% | +18.3% | +19.0% | +18.8% | +19.1% |
| 2014-01 | +19.1% | +18.4% | +18.5% | +18.6% | +19.3% |
| 2014-02 | +19.2% | +19.1% | +18.4% | +18.6% | +19.4% |
| 2014-03 | +16.1% | +17.0% | +15.6% | +15.9% | +16.1% |
| 2014-04 | +17.8% | +18.7% | +17.7% | +17.8% | +17.8% |
| 2014-05 | +22.3% | +23.2% | +22.3% | +22.5% | +22.2% |
| 2014-06 | +24.0% | +24.9% | +23.7% | +23.8% | +24.1% |
| 2014-07 | +23.5% | +25.2% | +23.3% | +23.3% | +23.5% |
| 2014-08 | +22.3% | +24.5% | +22.2% | +22.0% | +22.5% |
| 2014-09 | +22.6% | +24.7% | +23.0% | +22.7% | +22.5% |
| 2014-10 | +19.7% | +21.3% | +20.2% | +19.9% | +19.7% |
| 2014-11 | +16.2% | +17.6% | +16.9% | +16.5% | +16.0% |
| 2014-12 | +11.8% | +13.1% | +12.3% | +11.9% | +11.7% |
| 2015-01 | +11.7% | +12.7% | +12.1% | +11.8% | +11.6% |
| 2015-02 | +8.0% | +8.7% | +8.6% | +8.2% | +7.9% |
| 2015-03 | +10.3% | +10.8% | +10.8% | +10.4% | +10.3% |
| 2015-04 | +7.6% | +8.6% | +8.1% | +7.7% | +7.6% |
| 2015-05 | +8.5% | +9.6% | +8.8% | +8.3% | +8.5% |
| 2015-06 | +7.4% | +8.9% | +8.2% | +7.7% | +7.3% |
| 2015-07 | +8.7% | +9.6% | +9.3% | +8.8% | +8.6% |
| 2015-08 | +11.2% | +11.5% | +11.4% | +11.2% | +11.1% |
| 2015-09 | +9.9% | +10.2% | +9.7% | +9.5% | +10.0% |
| 2015-10 | +7.6% | +7.9% | +7.3% | +7.4% | +7.6% |
| 2015-11 | +6.4% | +7.1% | +6.5% | +6.5% | +6.4% |
| 2015-12 | +8.3% | +9.7% | +9.0% | +8.8% | +8.1% |
| 2016-01 | +11.3% | +13.1% | +12.5% | +12.0% | +11.1% |
| 2016-02 | +14.4% | +16.2% | +15.7% | +15.2% | +14.2% |
| 2016-03 | +15.6% | +16.8% | +16.7% | +16.3% | +15.4% |
| 2016-04 | +15.5% | +16.3% | +16.0% | +15.9% | +15.3% |
| 2016-05 | +11.1% | +11.2% | +10.9% | +11.2% | +11.1% |
| 2016-06 | +9.0% | +9.0% | +8.1% | +8.3% | +9.2% |
| 2016-07 | +7.8% | +8.0% | +7.0% | +7.2% | +8.1% |
| 2016-08 | +6.1% | +6.5% | +5.4% | +5.2% | +6.3% |
| 2016-09 | +4.4% | +4.4% | +4.0% | +3.7% | +4.5% |
| 2016-10 | +4.5% | +4.2% | +4.0% | +3.3% | +4.8% |
| 2016-11 | +6.2% | +6.0% | +5.5% | +4.7% | +6.7% |
| 2016-12 | +5.7% | +5.3% | +4.4% | +3.8% | +6.3% |
| 2017-01 | +3.8% | +3.0% | +1.8% | +1.9% | +4.4% |
| 2017-02 | +1.0% | -0.4% | -1.6% | -1.1% | +1.8% |
| 2017-03 | -0.7% | -1.7% | -3.3% | -2.9% | +0.1% |
| 2017-04 | -0.9% | -1.6% | -3.2% | -3.2% | -0.1% |
| 2017-05 | +1.4% | +1.2% | -0.2% | -0.8% | +2.1% |
| 2017-06 | +3.0% | +2.0% | +1.2% | +0.8% | +3.6% |
| 2017-07 | +1.9% | +0.7% | +0.2% | -0.2% | +2.6% |
| 2017-08 | +0.3% | -1.1% | -1.2% | -1.2% | +0.8% |
| 2017-09 | 0.0% | -1.0% | -1.3% | -1.3% | +0.4% |
| 2017-10 | +0.4% | +0.3% | -0.2% | 0.0% | +0.5% |
| 2017-11 | -0.3% | -0.4% | -0.6% | -0.5% | -0.2% |
| 2017-12 | -0.6% | -0.8% | -0.6% | -0.4% | -0.6% |
| 2018-01 | +0.9% | +0.3% | +0.9% | +0.8% | +0.9% |
| 2018-02 | +1.1% | +1.6% | +1.8% | +1.4% | +1.0% |
| 2018-03 | +0.2% | +0.8% | +1.5% | +0.9% | 0.0% |
| 2018-04 | +1.3% | +2.1% | +3.1% | +2.7% | +0.9% |
| 2018-05 | +0.2% | +1.9% | +2.7% | +2.4% | -0.5% |
| 2018-06 | 0.0% | +2.4% | +3.2% | +2.4% | -0.7% |
| 2018-07 | -3.8% | -0.7% | -0.7% | -1.5% | -4.6% |
| 2018-08 | -5.2% | -3.1% | -2.8% | -3.6% | -5.8% |
| 2018-09 | -6.5% | -4.4% | -4.2% | -4.8% | -7.0% |
| 2018-10 | -3.5% | -2.7% | -2.1% | -2.5% | -3.8% |
| 2018-11 | -0.7% | +0.7% | +1.1% | +0.7% | -1.1% |
| 2018-12 | +0.4% | +1.6% | +1.9% | +1.3% | +0.1% |
| 2019-01 | -2.4% | -0.3% | -0.5% | -1.2% | -2.8% |
| 2019-02 | -3.4% | -2.0% | -1.9% | -2.5% | -3.7% |
| 2019-03 | -2.5% | -0.8% | -0.9% | -1.2% | -2.9% |
| 2019-04 | -3.2% | -2.0% | -2.0% | -2.1% | -3.5% |
| 2019-05 | -4.5% | -4.1% | -3.8% | -3.6% | -4.8% |
| 2019-06 | -3.9% | -3.7% | -3.4% | -2.9% | -4.2% |
| 2019-07 | -0.5% | -1.1% | -0.1% | +0.4% | -0.7% |
| 2019-08 | +3.3% | +3.9% | +4.3% | +4.6% | +2.9% |
| 2019-09 | +4.6% | +5.0% | +5.4% | +5.8% | +4.2% |
| 2019-10 | +1.6% | +3.3% | +3.3% | +3.3% | +1.0% |
| 2019-11 | +0.8% | +1.7% | +2.2% | +2.2% | +0.4% |
| 2019-12 | +1.9% | +2.7% | +3.6% | +3.5% | +1.3% |
| 2020-01 | +4.2% | +4.6% | +5.7% | +6.0% | +3.7% |
| 2020-02 | +4.6% | +5.8% | +6.6% | +6.9% | +3.8% |
| 2020-03 | +3.6% | +5.2% | +5.9% | +5.7% | +2.9% |
| 2020-04 | +0.6% | +2.7% | +3.0% | +2.7% | -0.2% |
| 2020-05 | +2.5% | +4.0% | +4.2% | +3.6% | +2.1% |
| 2020-06 | +2.3% | +3.2% | +3.8% | +3.5% | +1.9% |
| 2020-07 | +4.9% | +6.0% | +6.5% | +6.2% | +4.5% |
| 2020-08 | +4.1% | +5.3% | +6.0% | +5.8% | +3.4% |
| 2020-09 | +5.0% | +7.3% | +7.9% | +7.2% | +4.1% |
| 2020-10 | +5.6% | +8.3% | +8.5% | +8.3% | +4.6% |
| 2020-11 | +4.7% | +7.6% | +7.2% | +7.6% | +3.7% |
| 2020-12 | +2.6% | +5.7% | +4.9% | +5.8% | +1.6% |
| 2021-01 | +3.2% | +5.1% | +4.7% | +5.6% | +2.4% |
| 2021-02 | +3.5% | +3.9% | +3.9% | +5.0% | +3.0% |
| 2021-03 | +6.1% | +4.2% | +4.9% | +6.3% | +6.2% |
| 2021-04 | +8.0% | +5.3% | +6.2% | +7.5% | +8.3% |
| 2021-05 | +7.8% | +6.1% | +6.6% | +7.9% | +8.0% |
| 2021-06 | +3.6% | +2.7% | +2.6% | +4.0% | +3.6% |
| 2021-07 | -2.5% | -3.6% | -3.7% | -2.4% | -2.5% |
| 2021-08 | -4.2% | -4.5% | -5.0% | -4.3% | -4.1% |
| 2021-09 | -4.2% | -4.7% | -5.0% | -4.8% | -4.0% |
| 2021-10 | -1.7% | -0.4% | -1.5% | -2.1% | -1.6% |
| 2021-11 | -1.1% | +0.3% | -0.6% | -1.6% | -1.0% |
| 2021-12 | +0.2% | +3.1% | +1.5% | 0.0% | +0.1% |
| 2022-01 | -0.7% | +2.9% | +1.6% | -0.1% | -1.1% |
| 2022-02 | +0.6% | +4.8% | +3.2% | +1.6% | +0.1% |
| 2022-03 | -2.9% | +2.6% | +1.0% | -1.0% | -3.7% |
| 2022-04 | -2.1% | +3.6% | +1.9% | +0.1% | -3.0% |
| 2022-05 | -3.8% | +2.4% | +0.9% | -1.0% | -5.0% |
| 2022-06 | -0.6% | +5.2% | +3.9% | +1.8% | -1.6% |
| 2022-07 | +3.1% | +9.6% | +8.2% | +6.2% | +1.7% |
| 2022-08 | +7.2% | +12.4% | +11.5% | +10.3% | +5.9% |
| 2022-09 | +8.1% | +13.4% | +12.4% | +11.9% | +6.6% |
| 2022-10 | +6.5% | +8.9% | +9.1% | +9.4% | +5.4% |
| 2022-11 | +3.8% | +6.2% | +6.2% | +6.6% | +2.8% |
| 2022-12 | +2.2% | +2.7% | +3.5% | +4.3% | +1.5% |
| 2023-01 | +1.2% | +2.0% | +2.5% | +2.8% | +0.5% |
| 2023-02 | +1.1% | +2.1% | +2.8% | +2.7% | +0.5% |
| 2023-03 | +3.5% | +4.9% | +5.3% | +4.9% | +2.9% |
| 2023-04 | +3.8% | +5.1% | +5.6% | +4.9% | +3.3% |
| 2023-05 | +2.4% | +2.2% | +3.1% | +2.7% | +2.2% |
| 2023-06 | -1.1% | -1.2% | -0.1% | -0.3% | -1.4% |
| 2023-07 | -1.4% | -1.7% | -0.3% | -0.5% | -1.7% |
| 2023-08 | -3.4% | -3.5% | -2.1% | -2.5% | -3.8% |
| 2023-09 | -1.5% | -2.4% | -0.8% | -1.1% | -1.6% |
| 2023-10 | -3.0% | -4.4% | -2.7% | -2.9% | -3.0% |
| 2023-11 | -1.5% | -2.8% | -1.1% | -1.7% | -1.5% |
| 2023-12 | -2.9% | -4.1% | -2.4% | -3.2% | -2.8% |
| 2024-01 | -3.4% | -4.8% | -3.4% | -3.6% | -3.4% |
| 2024-02 | -5.3% | -6.8% | -5.4% | -5.1% | -5.4% |
| 2024-03 | -5.7% | -7.3% | -6.2% | -5.3% | -5.7% |
| 2024-04 | -5.0% | -6.7% | -5.4% | -4.6% | -5.1% |
| 2024-05 | -1.9% | -3.4% | -2.5% | -1.6% | -2.0% |
| 2024-06 | -0.5% | -2.0% | -1.2% | -0.4% | -0.4% |
| 2024-07 | -0.7% | -1.7% | -1.5% | -0.6% | -0.7% |
| 2024-08 | -0.8% | -1.8% | -1.7% | -0.6% | -0.7% |
| 2024-09 | -2.3% | -2.6% | -2.6% | -1.9% | -2.4% |
| 2024-10 | -2.6% | -2.6% | -2.8% | -2.1% | -2.7% |
| 2024-11 | -3.0% | -3.0% | -3.2% | -2.3% | -3.2% |
| 2024-12 | +0.6% | +1.2% | +0.5% | +1.7% | +0.2% |
| 2025-01 | +2.4% | +3.4% | +2.7% | +3.7% | +1.9% |
| 2025-02 | +2.9% | +4.1% | +3.4% | +4.2% | +2.5% |
| 2025-03 | +0.8% | -0.6% | +0.3% | +1.7% | +0.6% |
| 2025-04 | -0.9% | -1.2% | -0.6% | +0.4% | -1.3% |
| 2025-05 | -2.0% | -1.0% | -0.5% | -0.1% | -2.7% |
| 2025-06 | -0.4% | +3.3% | +3.0% | +2.4% | -1.5% |
| 2025-07 | +0.4% | +3.1% | +3.1% | +2.9% | -0.5% |
| 2025-08 | 0.0% | +2.3% | +2.8% | +2.5% | -1.0% |
| 2025-09 | -2.2% | -0.4% | +0.3% | +0.4% | -3.1% |
| 2025-10 | -3.0% | -0.8% | +0.2% | +0.1% | -4.1% |
| 2025-11 | -4.6% | -2.9% | -1.8% | -1.5% | -5.7% |
| 2025-12 | -6.9% | -5.9% | -4.3% | -4.1% | -7.9% |
| 2026-01 | -5.5% | -4.7% | -2.9% | -2.6% | -6.5% |
| 2026-02 | -2.9% | -1.8% | -0.1% | -0.2% | -3.9% |
| 2026-03 | -1.1% | +2.2% | +3.0% | +2.6% | -2.5% |
Sold House Prices in Lambeth
The average sold price across all property types in Lambeth is £554,128, which is 91.1% above the England average of £289,946 as of March 2026. Every property type carries a large premium to England, and the gaps widen from flats up to houses.
| Property Type | Lambeth Average | England Average | Difference |
|---|---|---|---|
| Detached houses | £1,183,081 | £470,492 | +151.5% |
| Semi-detached houses | £1,050,427 | £288,185 | +264.5% |
| Terraced houses | £820,993 | £243,788 | +236.8% |
| Flats and maisonettes | £454,315 | £214,563 | +111.7% |
| All property types | £554,128 | £289,946 | +91.1% |
Detached houses average £1,183,081, which is 151.5% above England's £470,492. Detached houses are 20.8% of the stock in SE21 (Dulwich), 8.4% in SE19 and 8.0% in SW16, and under 6% everywhere else. Annual growth was 2.2%.
Semi-detached houses average £1,050,427, a 264.5% premium to England's £288,185, the widest gap of any type. Semis are a quarter of the stock in SE21 (25.2%) and just under that in SW16 (23.8%). Annual growth of 3.0% is the strongest of any property type in Lambeth.
Terraced houses average £820,993, 236.8% above England's £243,788. The largest terrace shares are in SE24 (27.5%), SW16 (25.3%) and SW12 (22.8%). Annual growth was 2.6%.
Flats and maisonettes average £454,315, a 111.7% premium that is large in cash terms but the smallest of the four types relative to England's £214,563. Flats are the largest single type of home in every postcode, from 32.9% of the stock in SE21 to 88.0% in SE1. Annual change of -2.5% is the only negative reading among the types.
Price Per Square Foot in Lambeth
£273 per square foot separates Lambeth's cheapest postcode from its dearest, with SW16 (Streatham, Norbury) at £571 and SW12 (Balham) at £844. Measuring by the square foot takes property size out of the comparison, so it reads location value more cleanly than the headline averages. The southern postcodes sit at the cheaper end, while the riverside and the SW12 corner near Clapham command the most.
| Rank | Area | Price Per Sq Ft |
|---|---|---|
| 1 | SW16 (Streatham, Norbury) | £571 |
| 2 | SE26 (Sydenham) | £575 |
| 3 | SE19 (Crystal Palace, Upper Norwood) | £597 |
| 4 | SE27 (West Norwood, Tulse Hill) | £632 |
| 5 | SW2 (Brixton, Tulse Hill) | £650 |
| 6 | SE5 (Camberwell, Denmark Hill) | £663 |
| 7 | SW9 (Stockwell, Brixton) | £715 |
| 8 | SE21 (Dulwich, West Dulwich) | £724 |
| 9 | SE24 (Herne Hill, Tulse Hill) | £782 |
| 10 | SE1 (South Bank, Waterloo) | £815 |
| 11 | SW4 (Clapham) | £818 |
| 12 | SE11 (Kennington, Vauxhall) | £819 |
| 13 | SW8 (South Lambeth, Nine Elms) | £836 |
| 14 | SW12 (Balham) | £844 |
SW16 at £571 per square foot is the cheapest space in Lambeth. Streatham and Norbury sit at the southern edge of the borough, and SW16 has the second-largest house share in Lambeth at 57.1%.
SW12 at £844 per square foot is the dearest, just ahead of SW8 at £836 and SE11 at £819. SW12 straddles Lambeth and Wandsworth, and flats are 64.6% of its stock. SW8 and SE11 are 82.7% and 82.5% flats.
For Sale Asking Prices in Lambeth
SE19 at £445,881 and SW8 at £766,900 sit 72.0% apart, the widest asking-price gap in the borough. That range mirrors the geography: the southern postcodes around Crystal Palace and Sydenham are the most affordable way in, while the riverside corridor at Nine Elms and Waterloo is the dearest. The mean asking price across all fourteen Lambeth postcodes is £587,762.
| Rank | Area | Asking Price |
|---|---|---|
| 1 | SE19 (Crystal Palace, Upper Norwood) | £445,881 |
| 2 | SE26 (Sydenham) | £476,853 |
| 3 | SE5 (Camberwell, Denmark Hill) | £477,979 |
| 4 | SE27 (West Norwood, Tulse Hill) | £497,364 |
| 5 | SW16 (Streatham, Norbury) | £500,968 |
| 6 | SW9 (Stockwell, Brixton) | £513,453 |
| 7 | SW2 (Brixton, Tulse Hill) | £519,570 |
| 8 | SW4 (Clapham) | £609,116 |
| 9 | SE11 (Kennington, Vauxhall) | £642,627 |
| 10 | SE24 (Herne Hill, Tulse Hill) | £650,118 |
| 11 | SE21 (Dulwich, West Dulwich) | £704,442 |
| 12 | SW12 (Balham) | £709,363 |
| 13 | SE1 (South Bank, Waterloo) | £714,030 |
| 14 | SW8 (South Lambeth, Nine Elms) | £766,900 |
SE19 at £445,881 is the lowest asking price in Lambeth and the cheapest way into the borough. Crystal Palace and Upper Norwood sit on the southern hills, and SE19 reaches into Croydon, Southwark and Bromley as well as Lambeth.
SW8 at £766,900 is the dearest. SE1 follows at £714,030 and SW12 at £709,363. Their yields, in the rental section below, sit mid-table: 5.0% for SW8, 4.9% for SE1 and 4.8% for SW12.
House Price Growth in Lambeth
SE24 (Herne Hill, Tulse Hill) leads Lambeth on five-year growth at 20.7%, while SE1 (South Bank, Waterloo) sits at the bottom at -26.2%. Four postcodes (SE24, SE21, SE26 and SE27) posted positive growth across one, three and five years, while SE1 is down over every window and SW8 is down 34.4% over three.
| Area | 1 Year | 3 Years | 5 Years |
|---|---|---|---|
| SE24 (Herne Hill, Tulse Hill) | 14.7% | 5.7% | 20.7% |
| SE21 (Dulwich, West Dulwich) | 8.2% | 20.2% | 18.7% |
| SE11 (Kennington, Vauxhall) | 8.7% | -4.8% | 12.8% |
| SE26 (Sydenham) | 10.7% | 10.2% | 6.6% |
| SE27 (West Norwood, Tulse Hill) | 4.9% | 10.1% | 5.0% |
| SW8 (South Lambeth, Nine Elms) | 9.4% | -34.4% | 1.1% |
| SW4 (Clapham) | -1.9% | -1.5% | 0.5% |
| SW16 (Streatham, Norbury) | -1.5% | -2.2% | -0.4% |
| SE19 (Crystal Palace, Upper Norwood) | 1.2% | 7.0% | -0.8% |
| SE5 (Camberwell, Denmark Hill) | -2.3% | -2.8% | -1.4% |
| SW12 (Balham) | 0.7% | -5.8% | -2.1% |
| SW2 (Brixton, Tulse Hill) | -2.6% | -2.8% | -4.0% |
| SW9 (Stockwell, Brixton) | -2.2% | 0.4% | -5.5% |
| SE1 (South Bank, Waterloo) | -3.4% | -13.6% | -26.2% |
SE24 has the highest five-year growth at 20.7%, with positive readings over one and three years too. Flats are 52.9% of SE24's stock, so this is not a house-led postcode. SE21 sits just behind at 18.7% over five years and 20.2% over three, the strongest three-year figure in the borough, and it is one of the two postcodes, with SW16, where houses outnumber flats.
SE1 records the weakest five-year reading at -26.2%, alongside -13.6% over three years. SW8 is down 34.4% over three years and up 9.4% over one. Why either postcode moved as it did is not something the growth table can show.
Monthly Property Sales in Lambeth
Transaction volumes range from 8 sales a month in SE11 and SE21 up to 63 in SW16 (Streatham, Norbury), with turnover from 3% to 12%. Turnover here is monthly sales as a share of the homes on the market at the time.
| Area | Sales Per Month | Turnover | Asking Price |
|---|---|---|---|
| SW16 (Streatham, Norbury) | 63 | 7% | £500,968 |
| SW2 (Brixton, Tulse Hill) | 40 | 8% | £519,570 |
| SE1 (South Bank, Waterloo) | 38 | 3% | £714,030 |
| SW12 (Balham) | 27 | 9% | £709,363 |
| SW4 (Clapham) | 24 | 5% | £609,116 |
| SW9 (Stockwell, Brixton) | 22 | 5% | £513,453 |
| SE5 (Camberwell, Denmark Hill) | 21 | 6% | £477,979 |
| SE19 (Crystal Palace, Upper Norwood) | 21 | 7% | £445,881 |
| SE26 (Sydenham) | 20 | 10% | £476,853 |
| SE27 (West Norwood, Tulse Hill) | 18 | 12% | £497,364 |
| SW8 (South Lambeth, Nine Elms) | 18 | 3% | £766,900 |
| SE24 (Herne Hill, Tulse Hill) | 9 | 8% | £650,118 |
| SE11 (Kennington, Vauxhall) | 8 | 4% | £642,627 |
| SE21 (Dulwich, West Dulwich) | 8 | 6% | £704,442 |
SW16 records the most sales at 63 a month, ahead of SW2's 40 and SE1's 38, on a 7% turnover. SE27 posts the highest turnover at 12% on 18 sales a month.
SE1 and SW8 stand out for the opposite reason, with turnover of just 3% on 38 and 18 sales a month.
How Long Properties Take to Sell in Lambeth
Selling times in Lambeth run from an estimated 277 days in SE27 (West Norwood, Tulse Hill) to roughly 1,014 in SE1 and SW8. The days figure is an estimate from the current pace of sales, not a measured time from listing to completion; months of unsold stock is how many months of homes are on the market at that pace, from 9.1 in SE27 to 33.3 in SE1 and SW8. Nine of the fourteen postcodes are rated buyer's markets.
| Area | Avg Days to Sell | Months of Unsold Stock | Market |
|---|---|---|---|
| SE27 (West Norwood, Tulse Hill) | 277 | 9.1 | Balanced market |
| SE26 (Sydenham) | 304 | 10.0 | Balanced market |
| SE24 (Herne Hill, Tulse Hill) | 338 | 11.1 | Balanced market |
| SW2 (Brixton, Tulse Hill) | 338 | 11.1 | Balanced market |
| SW12 (Balham) | 338 | 11.1 | Balanced market |
| SE5 (Camberwell, Denmark Hill) | 435 | 14.3 | Buyer's market |
| SE21 (Dulwich, West Dulwich) | 435 | 14.3 | Buyer's market |
| SW16 (Streatham, Norbury) | 435 | 14.3 | Buyer's market |
| SE19 (Crystal Palace, Upper Norwood) | 507 | 16.7 | Buyer's market |
| SW4 (Clapham) | 608 | 20.0 | Buyer's market |
| SW9 (Stockwell, Brixton) | 608 | 20.0 | Buyer's market |
| SE11 (Kennington, Vauxhall) | 761 | 25.0 | Buyer's market |
| SE1 (South Bank, Waterloo) | 1014 | 33.3 | Buyer's market |
| SW8 (South Lambeth, Nine Elms) | 1014 | 33.3 | Buyer's market |
How long a property takes to sell is a cost no yield figure shows. SE27's estimate is about 277 days on nine months of unsold stock, while SE1 and SW8 each run to an estimated 1,014 days on more than 33 months, so each month's sales clear a far smaller share of the listings in the Waterloo and Nine Elms corridor than in the southern postcodes.
What Type of Property Can You Buy in Lambeth?
Flats dominate Lambeth's housing, from 32.9% of stock in SE21 (Dulwich) up to 88.0% in SE1 (South Bank, Waterloo), and houses are the exception rather than the rule. The shares quoted here and in the table are the housing-type breakdown a commercial property-data provider reports for each postcode, which it describes as Census-based. The Census release and the areas behind each figure are not specified in the data we hold, so read the percentages as the provider's reported figures rather than verified proportions of all the homes in the postcode.
| Area | Detached | Semi-detached | Terraced | Flats |
|---|---|---|---|---|
| SE1 (South Bank, Waterloo) | 0.7% | 2.3% | 8.8% | 88.0% |
| SE5 (Camberwell, Denmark Hill) | 2.6% | 5.9% | 15.8% | 75.7% |
| SE11 (Kennington, Vauxhall) | 0.8% | 2.8% | 13.7% | 82.5% |
| SE19 (Crystal Palace, Upper Norwood) | 8.4% | 14.7% | 14.3% | 62.6% |
| SE21 (Dulwich, West Dulwich) | 20.8% | 25.2% | 21.2% | 32.9% |
| SE24 (Herne Hill, Tulse Hill) | 3.4% | 16.1% | 27.5% | 52.9% |
| SE26 (Sydenham) | 5.2% | 13.9% | 22.7% | 57.8% |
| SE27 (West Norwood, Tulse Hill) | 3.3% | 18.4% | 19.5% | 58.7% |
| SW2 (Brixton, Tulse Hill) | 1.8% | 9.8% | 15.2% | 73.0% |
| SW4 (Clapham) | 1.5% | 6.0% | 17.9% | 74.5% |
| SW8 (South Lambeth, Nine Elms) | 1.4% | 3.8% | 12.0% | 82.7% |
| SW9 (Stockwell, Brixton) | 1.7% | 5.4% | 12.3% | 80.5% |
| SW12 (Balham) | 2.5% | 10.1% | 22.8% | 64.6% |
| SW16 (Streatham, Norbury) | 8.0% | 23.8% | 25.3% | 42.8% |
SE1 is the most flat-heavy postcode at 88.0%, with houses of any kind making up barely a tenth of the stock. The South Bank and Waterloo market is almost entirely flats. SW8 and SW9 sit close behind at 82.7% and 80.5%, the same flat-dominated pattern that runs along the Vauxhall and Stockwell corridor.
SE21 is the outlier at the other end, with flats at just 32.9% and detached and semi-detached houses together accounting for 46.0%. SE21 and SW16 are the two postcodes where houses outnumber flats; SE21 has the lowest private rented share at 17.9% and the highest outright ownership at 36.5%, and SW16 sits at 42.8% flats.
Flats combine purpose-built blocks and converted units, and a small share of non-standard dwellings is left out, so rows may not add up to exactly 100%.
Lambeth Rental Market Analysis
Monthly rents in Lambeth run from £1,710 in SE19 to £3,219 in SW8, with gross rental yields from 4.0% to 5.6% across the fourteen postcodes. For investors weighing up whether rental property is a worthwhile investment in inner London, the sections below break down rents, yields and tenant affordability postcode by postcode. If you are working out how to start a property business in the capital, Lambeth's private rented share runs from 17.9% to 37.8% of households by postcode. You can also browse available buy-to-let property across the country.
Average Rent & Gross Rental Yields in Lambeth
Gross rental yields in Lambeth range from 4.0% in SE24 to 5.6% in SE5. The three lowest yields are SE24, SE27 and SE21, in the south of the borough, while SE11 and SW8 on the riverside sit at 5.4% and 5.0%. SE5 (Camberwell, Denmark Hill) tops the table on a £2,212 monthly rent against a £477,979 asking price.
| Area | Average Monthly Rent | Asking Price | Gross Yield |
|---|---|---|---|
| SE5 (Camberwell, Denmark Hill) | £2,212 | £477,979 | 5.6% |
| SE11 (Kennington, Vauxhall) | £2,895 | £642,627 | 5.4% |
| SW9 (Stockwell, Brixton) | £2,326 | £513,453 | 5.4% |
| SW4 (Clapham) | £2,670 | £609,116 | 5.3% |
| SW2 (Brixton, Tulse Hill) | £2,216 | £519,570 | 5.1% |
| SW8 (South Lambeth, Nine Elms) | £3,219 | £766,900 | 5.0% |
| SE1 (South Bank, Waterloo) | £2,920 | £714,030 | 4.9% |
| SW12 (Balham) | £2,866 | £709,363 | 4.8% |
| SE26 (Sydenham) | £1,872 | £476,853 | 4.7% |
| SE19 (Crystal Palace, Upper Norwood) | £1,710 | £445,881 | 4.6% |
| SW16 (Streatham, Norbury) | £1,893 | £500,968 | 4.5% |
| SE21 (Dulwich, West Dulwich) | £2,450 | £704,442 | 4.2% |
| SE27 (West Norwood, Tulse Hill) | £1,716 | £497,364 | 4.1% |
| SE24 (Herne Hill, Tulse Hill) | £2,180 | £650,118 | 4.0% |
SE5 leads on yield at 5.6%, where a £2,212 rent on a £477,979 asking price gives the strongest income return in the borough. SE5 has the third-lowest asking price in the borough. SE11 and SW9 follow at 5.4%, on very different asking prices of £642,627 and £513,453, because SE11's rent is £569 a month higher.
SE24 sits at the bottom on yield at 4.0%, because its £650,118 asking price is the fifth-highest in Lambeth against a £2,180 rent. SE27 (4.1%) and SE21 (4.2%) sit just above it.
Is Lambeth Rent High?
Monthly rents in Lambeth take between 41.8% and 78.8% of the local median gross monthly salary, so every postcode sits above the 30% affordability benchmark. The widely cited threshold for rent affordability is 30% of gross income, and no Lambeth postcode comes close to it on a single median salary. The ratio compares a whole home's rent with one median salary; it says nothing about how many incomes go into a tenancy, and for the postcodes that cross the borough boundary the Lambeth median is a benchmark rather than a measured local wage.
The median gross weekly salary in Lambeth is £946.60, and the median annual salary is £49,034, about £4,086 a month. This is above the London regional median of £902.70 per week and the Great Britain median of £766.60 per week. Data from the Nomis Labour Market Profile (ASHE 2025).
| Rank | Area | Rent as % of Income |
|---|---|---|
| 1 | SW8 (South Lambeth, Nine Elms) | 78.8% |
| 2 | SE1 (South Bank, Waterloo) | 71.5% |
| 3 | SE11 (Kennington, Vauxhall) | 70.9% |
| 4 | SW12 (Balham) | 70.2% |
| 5 | SW4 (Clapham) | 65.3% |
| 6 | SE21 (Dulwich, West Dulwich) | 60.0% |
| 7 | SW9 (Stockwell, Brixton) | 56.9% |
| 8 | SW2 (Brixton, Tulse Hill) | 54.2% |
| 9 | SE5 (Camberwell, Denmark Hill) | 54.1% |
| 10 | SE24 (Herne Hill, Tulse Hill) | 53.4% |
| 11 | SW16 (Streatham, Norbury) | 46.3% |
| 12 | SE26 (Sydenham) | 45.8% |
| 13 | SE27 (West Norwood, Tulse Hill) | 42.0% |
| 14 | SE19 (Crystal Palace, Upper Norwood) | 41.8% |
SW8 is the least affordable on this measure at 78.8%, where a £3,219 rent takes almost four-fifths of a single median monthly salary. SE1, SE11 and SW12 follow, all above 70%.
SE19 is the most affordable at 41.8%, with a £1,710 rent against a £4,086 monthly salary. Crystal Palace and Upper Norwood still sit well above the 30% benchmark, but they are the closest Lambeth gets to it. SE27 and SE26 follow at 42.0% and 45.8%.
How Big Is Lambeth's Private Rented Sector?
The private rented sector is deepest in SW8 at 37.8% of households and shallowest in SE21 at 17.9%, with most of Lambeth sitting between a quarter and a third. The share shows how much of each postcode already rents privately. The table below shows household tenure by postcode.
| Area | Owned Outright | Owned with Mortgage | Private Rented | Social Rented |
|---|---|---|---|---|
| SW8 (South Lambeth, Nine Elms) | 13.6% | 14.7% | 37.8% | 32.2% |
| SE1 (South Bank, Waterloo) | 9.3% | 12.6% | 37.7% | 37.5% |
| SW12 (Balham) | 18.3% | 28.2% | 37.6% | 15.1% |
| SW4 (Clapham) | 13.1% | 21.9% | 37.4% | 26.1% |
| SW2 (Brixton, Tulse Hill) | 12.0% | 23.5% | 30.6% | 31.8% |
| SW16 (Streatham, Norbury) | 24.8% | 31.5% | 29.7% | 13.1% |
| SW9 (Stockwell, Brixton) | 8.3% | 16.2% | 29.5% | 43.7% |
| SE24 (Herne Hill, Tulse Hill) | 18.6% | 27.1% | 28.0% | 25.0% |
| SE27 (West Norwood, Tulse Hill) | 15.8% | 29.7% | 27.3% | 25.9% |
| SE11 (Kennington, Vauxhall) | 10.0% | 14.6% | 27.1% | 45.2% |
| SE5 (Camberwell, Denmark Hill) | 10.6% | 20.2% | 26.2% | 40.6% |
| SE19 (Crystal Palace, Upper Norwood) | 19.1% | 30.7% | 26.2% | 22.2% |
| SE26 (Sydenham) | 19.7% | 31.1% | 21.5% | 26.4% |
| SE21 (Dulwich, West Dulwich) | 36.5% | 31.7% | 17.9% | 13.2% |
SW8, SE1, SW12 and SW4 all carry private rented sectors around 37% to 38%, the deepest in Lambeth. Social renting is largest in SE11 at 45.2%, SW9 at 43.7% and SE5 at 40.6%, ahead of SE1's 37.5%.
SE21 has the smallest private rented sector at 17.9%, with owner-occupation accounting for more than two-thirds of households. It also has the borough's highest outright ownership at 36.5%.
Local Housing Allowance Rates in Lambeth
Lambeth straddles two Broad Rental Market Areas: most of the borough falls in Inner South East London, while SW8 (South Lambeth, Nine Elms) and SW12 (Balham) sit in Inner South West London, where the rates run higher. Local Housing Allowance is the maximum housing support a tenant on benefits can claim, so the award can be lower than the rate, and the tenant pays whatever rent the award does not cover. The table below shows the weekly rates for each area as of June 2026. To check the current rate for a specific address, you can use the government's official Local Housing Allowance calculator.
| Property Size | Inner South East London (weekly) | Inner South West London (weekly) |
|---|---|---|
| Shared accommodation | £149.59 | £157.64 |
| 1 bedroom | £298.15 | £326.79 |
| 2 bedrooms | £356.71 | £391.23 |
| 3 bedrooms | £448.77 | £497.10 |
| 4 bedrooms | £604.11 | £667.40 |
For most of Lambeth, the two-bedroom Inner South East London rate of £356.71 a week works out at about £1,546 a month, while the same size in the Inner South West London area covering SW8 and SW12 reaches £391.23 a week, or roughly £1,695 a month. The rent table above averages every home advertised in a postcode whatever its size, so the two are not a like-for-like pair. Both two-bed rates sit below every postcode's average rent. The Inner South East London four-bed rate of £604.11 a week, about £2,618 a month, is above nine of the twelve postcode averages it covers. The Inner South West London four-bed rate of £667.40, about £2,892, is above SW12's £2,866. Housing support will not count rent above the rate. A lower award leaves more of the rent for the tenant to pay from their own income.
Buy-to-Let Considerations
Are House Prices High in Lambeth? Price-to-Earnings Ratios
Buying a property in Lambeth takes between 9.1 and 15.6 times the median annual salary. This is based on the Nomis Labour Market Profile for Lambeth showing the median gross annual income for Lambeth residents is £49,034.
The national benchmark for price-to-earnings is 7.4x (England's average sold price of £289,946 divided by the Great Britain median annual salary of £39,125). Every Lambeth postcode sits above that benchmark.
| Rank | Area | Price-to-Earnings Ratio |
|---|---|---|
| 1 | SE19 (Crystal Palace, Upper Norwood) | 9.1x |
| 2 | SE26 (Sydenham) | 9.7x |
| 3 | SE5 (Camberwell, Denmark Hill) | 9.7x |
| 4 | SE27 (West Norwood, Tulse Hill) | 10.1x |
| 5 | SW16 (Streatham, Norbury) | 10.2x |
| 6 | SW9 (Stockwell, Brixton) | 10.5x |
| 7 | SW2 (Brixton, Tulse Hill) | 10.6x |
| 8 | SW4 (Clapham) | 12.4x |
| 9 | SE11 (Kennington, Vauxhall) | 13.1x |
| 10 | SE24 (Herne Hill, Tulse Hill) | 13.3x |
| 11 | SE21 (Dulwich, West Dulwich) | 14.4x |
| 12 | SW12 (Balham) | 14.5x |
| 13 | SE1 (South Bank, Waterloo) | 14.6x |
| 14 | SW8 (South Lambeth, Nine Elms) | 15.6x |
SE19 at 9.1x is the most affordable postcode relative to local earnings, the same Crystal Palace and Upper Norwood market that carries the lowest asking price in the borough. It is still well above the 7.4x national benchmark, but for Lambeth it is the lowest barrier on this measure.
SW8 at 15.6x sits at the top of the table. SW8 also has the joint-longest estimated selling time in the borough, 1,014 days on 33.3 months of unsold stock alongside SE1, and the weakest three-year growth at -34.4%.
Deposit Requirements in Lambeth
A 30% deposit on a buy-to-let property in Lambeth ranges from £133,764 in SE19 to £230,070 in SW8. The gap between the cheapest and dearest deposit is £96,306, a difference of nearly £100,000 before the mortgage even starts.
Beyond the deposit, the stamp duty calculation and other buy-to-let running costs add to the total capital required.
| Rank | Area | 30% Deposit Required |
|---|---|---|
| 1 | SE19 (Crystal Palace, Upper Norwood) | £133,764 |
| 2 | SE26 (Sydenham) | £143,056 |
| 3 | SE5 (Camberwell, Denmark Hill) | £143,394 |
| 4 | SE27 (West Norwood, Tulse Hill) | £149,209 |
| 5 | SW16 (Streatham, Norbury) | £150,290 |
| 6 | SW9 (Stockwell, Brixton) | £154,036 |
| 7 | SW2 (Brixton, Tulse Hill) | £155,871 |
| 8 | SW4 (Clapham) | £182,735 |
| 9 | SE11 (Kennington, Vauxhall) | £192,788 |
| 10 | SE24 (Herne Hill, Tulse Hill) | £195,036 |
| 11 | SE21 (Dulwich, West Dulwich) | £211,333 |
| 12 | SW12 (Balham) | £212,809 |
| 13 | SE1 (South Bank, Waterloo) | £214,209 |
| 14 | SW8 (South Lambeth, Nine Elms) | £230,070 |
SE19 is the cheapest way into Lambeth, at a £133,764 deposit, and it pairs that with the lowest price-to-earnings ratio and a mid-table 4.6% yield. Stepping up to SE26 or SE5 adds around £10,000 to the deposit for either Sydenham's 4.7% yield or Camberwell's borough-leading 5.6%.
At the top, SW8 needs a £230,070 deposit, the largest in Lambeth, for a 5.0% yield, the borough's highest rent at £3,219, the joint-longest estimated selling time at 1,014 days on 33.3 months of unsold stock, and the weakest three-year growth at -34.4%. Where the deposits sit close together the postcodes can still differ: SE24 and SE21 are about £16,300 apart, yet SE24 yields 4.0% and SE21 4.2%, and SE21 is one of the two postcodes, with SW16, where houses outnumber flats.
What the Lambeth Data Tells Buy-to-Let Investors
In Lambeth the top yield and the top growth sit in different postcodes. SE5 (Camberwell, Denmark Hill) tops the yield table at 5.6%, with SE11 (Kennington, Vauxhall) and SW9 (Stockwell, Brixton) at 5.4%, on asking prices of £477,979, £642,627 and £513,453. The cheapest way in is SE19 at a £445,881 asking price, the lowest price-to-earnings ratio at 9.1x and a £133,764 deposit, on a 4.6% yield. Investment properties in Lambeth at the riverside end cost the most: SW8 asks £766,900 and returns 5.0%.
The capital-growth picture runs the other way. SE24 leads on five-year growth at 20.7% and SE21 on three-year growth at 20.2%, both in the south of the borough, while SE1 is down 26.2% over five years and SW8 34.4% over three. The borough as a whole is down 5.4% over five years. Our off-market property in Lambeth and below market value properties pages cover buying below asking, and nine of the fourteen postcodes are rated buyer's markets.
One practical point sets Lambeth apart from many buy-to-let markets: the borough runs a selective licensing scheme for private landlords across most wards, rolled out in two phases with Vauxhall and Waterloo & South Bank kept outside it, on top of additional licensing for HMOs. You can check the current wards, fees and how to apply on Lambeth Council's property licensing pages. Our guide to selective licensing rules explains how these schemes work and what they mean for a landlord's costs and compliance. Two Streatham wards, Streatham Common and Vale and Streatham St Leonard's, also have an Article 4 direction in force since 11 August 2025 that removes the right to convert a house into a small HMO without planning permission (council Article 4 direction). With above-average local wages and an employment rate of 77.8%, the borough's measured yields run from 4.0% to 5.6%.
How Lambeth Compares
Lambeth's mean asking price of £587,762 sits in the middle of five South London locations compared here, and its top yield of 5.6% is second only to Lewisham's 6.0%. The comparison places Lambeth alongside four nearby boroughs, each with a different investor profile. The mean asking price and mean monthly rent are simple averages across all postcodes with data. Top gross yield is the single highest postcode yield in each location.
| Location | Mean Asking Price | Mean Monthly Rent | Mean Gross Yield | Top Yield (postcode) |
|---|---|---|---|---|
| Croydon | £466,187 | £1,771 | 4.6% | 5.4% (SE20) |
| Lewisham | £490,640 | £1,965 | 4.8% | 6.0% (SE8) |
| Lambeth | £587,762 | £2,368 | 4.8% | 5.6% (SE5) |
| Merton | £596,108 | £2,223 | 4.5% | 5.2% (CR4) |
| Wandsworth | £663,635 | £2,770 | 5.0% | 5.3% (SW11, SW4) |
Lambeth is the median-priced location in this comparison at £587,762, dearer than Croydon at £466,187 and Lewisham at £490,640, but cheaper than Wandsworth at £663,635. Its mean monthly rent of £2,368 is the second highest of the five, behind Wandsworth.
On income, Lewisham leads the group at a 6.0% top yield and Lambeth follows at 5.6%, both ahead of Merton at 5.2% and Wandsworth at 5.3%. Croydon and Lewisham are the cheaper two on mean asking price; Merton and Wandsworth the dearer two. For a data-driven comparison across the country, see our guide to the best places to invest in buy-to-let.
Frequently Asked Questions
Is Lambeth a good place to live for buy-to-let tenants?
Lambeth runs from the South Bank down through Brixton and Clapham to Streatham, with Waterloo, Vauxhall and the Victoria line terminus at Brixton inside the borough. The data does not say why tenants choose it.
Local pay is £947 a week against roughly £903 across London, the employment rate is 77.8%, and large employers such as St Thomas' Hospital and King's College London's Waterloo campus sit inside the borough. Private renting runs from 17.9% of households in SE21 to 37.8% in SW8.
What are the best areas in Lambeth for property investment?
The top yield and the top growth sit in different postcodes. For yield, SE5 (Camberwell, Denmark Hill) tops the borough at 5.6%, with SE11 (Kennington, Vauxhall) and SW9 (Stockwell, Brixton) at 5.4%; SE11 asks £642,627, so a high yield is not only found at the cheap end. For capital growth, the southern postcodes have done best, with SE24 (Herne Hill) up 20.7% over five years and SE21 (Dulwich) up 20.2% over three.
SW8 and SE1 carry the highest prices, the longest estimated selling times at 1,014 days each, and the weakest three- and five-year growth. So if income matters most, Camberwell, Kennington and Stockwell lead; on growth that has shown up in the table, Herne Hill and Dulwich lead.
How does Lambeth compare to Croydon for buy-to-let?
Croydon is the cheaper of the two on mean asking price, £466,187 against Lambeth's £587,762, around 21% lower. Top yields are close, with Croydon at 5.4% and Lambeth at 5.6%.
Lambeth's mean rent is higher, £2,368 a month against Croydon's £1,771, and its mean gross yield is 4.8% against Croydon's 4.6%.
Is there demand for student accommodation in Lambeth?
King's College London's Waterloo campus sits on Stamford Street in SE1, with its own Stamford Street Apartments housing more than 500 students, and the medical campus around King's College Hospital in Camberwell is in SE5. The rental figures do not show student numbers by postcode.
Student lets in Lambeth come with the usual trade-offs of summer voids and more hands-on management than a standard tenancy. For the purpose-built end of the market, see our guide to purpose-built student accommodation, and for shared houses our guide to how HMO investment works covers the numbers and the licensing.
Can I find buy-to-let property under £450,000 in Lambeth?
One postcode average sits below it: SE19 (Crystal Palace, Upper Norwood) at £445,881. Every other postcode averages above £450,000. By type, flats across Lambeth average £454,315 on the Land Registry index, a borough-wide type average rather than a postcode price.
Our below market value page covers buying under the open-market figure.
How will the Nine Elms regeneration affect Lambeth property prices?
The postcode figures on this page give wider local context; they do not measure the scheme's effect. SW8 covers Nine Elms and South Lambeth, SE11 covers Vauxhall, and SE1, the South Bank and Waterloo postcode, is a neighbouring comparator. More than 18,000 homes are planned across the wider area, the Northern line extension opened in 2021, and the Vauxhall station upgrade was completed in August 2017. Over five years SW8 is up 1.1% and SE1 down 26.2%; over three years SW8 is down 34.4%; over one year SW8 is up 9.4% and SE11 8.7%.
Around 50 acres of new public space and the jobs the scheme brings are still to come. Whether they move prices is not something the data here can say.
What are average house prices in Lambeth?
The average sold price across Lambeth is £554,128 on the Land Registry index, about 91.1% above the England average of £289,946 as of March 2026. Asking prices by postcode run from £445,881 in SE19 (Crystal Palace, Upper Norwood) up to £766,900 in SW8 (South Lambeth, Nine Elms), with a borough-wide mean of £587,762. By type, detached homes average £1,183,081, semi-detached £1,050,427, terraced £820,993 and flats £454,315.
Through a buy-to-let lens, SE5 carries the highest yield at 5.6% and SE24 the lowest at 4.0%, and the dearest postcode, SW8, returns 5.0%.
What are the Local Housing Allowance rates in Lambeth?
Lambeth covers two Broad Rental Market Areas. Most of the borough falls in Inner South East London, where as of June 2026 the rates run at £149.59 a week for a shared room, £298.15 for a one-bed, £356.71 for two beds, £448.77 for three and £604.11 for four. SW8 and SW12 fall in the Inner South West London area, where the rates are higher, from £157.64 for a shared room up to £667.40 for four beds. Those figures are the most a tenant on housing support can claim towards rent. The award can be lower, and the tenant pays the rest.
What type of property is most common in Lambeth?
Flats, by a wide margin and in almost every postcode. They run from 32.9% of the stock in SE21 (Dulwich), the borough's house market, up to 88.0% in SE1 (South Bank, Waterloo). Houses are scarce: detached homes reach 8% or more of the stock only in SE21, SE19 and SW16, and terraced houses are most common in SE24 and SW16. Flats are the largest single type in every postcode.
How do I buy an investment property in Lambeth?
The top yield and the top growth sit in different postcodes. SE5 carries the highest yield at 5.6%, while Herne Hill (SE24) and Dulwich (SE21) have the strongest five- and three-year growth. A 30% deposit runs from £133,764 in SE19 up to £230,070 in SW8.
Our off-market property page covers buying below asking. To see what is available now, browse investment properties or buy-to-let property for sale.
Ready to buy property?
Browse investment properties with prices and gross yields shown for each opportunity.
See the latest deals