Where to Buy Property Investments in Merton: Yields of 5.0%
Merton's gross rental yields range from 3.9% to 5.0% across all 7 postcodes, with CR4 and SW18 sharing the top returns. The borough's average sold price of £613,854 sits 111.4% above the England average of £290,437, and Merton's population grew 7.8% to 215,186 between the 2011 and 2021 censuses.
Merton is the only London borough served by tube, tram, and National Rail, and that transport connectivity is reflected in property prices that more than double the national average. Asking prices range from £418,182 in CR4 to £727,312 in SW20, creating a wide entry spectrum across 7 postcodes. Monthly rents run from £1,732 to £2,572, and the borough's yields compress into a narrow 3.9% to 5.0% band that is typical of south-west London.
This guide covers all 7 Merton postcodes: CR4, KT3, SM4, SW17, SW18, SW19, and SW20 under the London Borough of Merton (ONS code E09000024). Merton is an outer London borough in south-west London, with Wimbledon, Mitcham, Morden, Raynes Park, and Colliers Wood as its five main centres. Several postcodes straddle borough boundaries: CR4 crosses into Croydon, SW17 and SW19 cross into Wandsworth, SW18 straddles Merton and Wandsworth, and KT3 extends into Kingston upon Thames. Data shown is for the full postcode district, not clipped to the Merton boundary. Investors comparing options across the capital may also consider Wandsworth, Croydon, or Lambeth. Browse all our South London location guides or explore London buy-to-let opportunities.
Article updated: April 2026
Merton Buy-to-Let Market Overview 2026
Merton combines south-west London's transport connectivity with a wide price range across 7 postcodes, from affordable entry points in Mitcham to premium addresses in Raynes Park.
- Average sold price: £613,854 (111.4% above England's £290,437)
- Asking price range: £418,182 (CR4) to £727,312 (SW20)
- Rental yields: 3.9% (KT3, SW20) to 5.0% (CR4, SW18) across all 7 postcodes
- Rental income: Monthly rents from £1,732 (CR4) to £2,572 (SW18)
- Price per sq ft: Sold prices from £505/sq ft (CR4) to £801/sq ft (SW18)
- Market activity: Sales ranging from 21 per month (SM4) to 64 per month (SW18)
- Deposit requirements: 30% deposits range from £125,455 (CR4) to £218,194 (SW20)
- Affordability ratios: Property prices from 8.2 to 14.3 times Merton's median annual salary of £50,844
Contents

-
by Robert Jones, Founder of Property Investments UK
With two decades in UK property, Rob has been investing in buy-to-let since 2005, and uses property data to develop tools for property market analysis.

Property Data Sources
Our location guide relies on diverse, authoritative datasets including:
- HM Land Registry UK House Price Index
- Ministry of Housing, Communities and Local Government
- Ordnance Survey Data Hub
- Propertydata.co.uk
We update our property data quarterly to ensure accuracy. Last update: April 2026. All data is presented as provided by our sources without adjustments or amendments.
Why Invest in Merton?
Merton is commonly cited as the only London borough with tube, tram, and National Rail services. The Northern line serves Morden (the line's southern terminus), South Wimbledon, and Colliers Wood. The District line terminates at Wimbledon. Tramlink connects Wimbledon through Merton Park, Morden Road, and Mitcham to Croydon. And 11 National Rail stations provide overground links via Thameslink, South Western Railway, and Southern Railway. That level of connectivity across a single outer London borough is unusual, and it underpins the rental demand that drives the local property market.
Between the 2011 and 2021 censuses, Merton's population grew from 199,693 to 215,186, a rise of 7.8%. Five town centres spread that population across the borough: Wimbledon in the west, Mitcham in the east, Morden in the centre, Raynes Park in the south-west, and Colliers Wood linking the two halves. Each has a distinct character and a different price profile for investors.
Merton's median annual salary of £50,844 is well above both the London regional median of £46,415 and the Great Britain median of £39,125. Higher local earnings support higher rents, which is reflected in the borough's monthly rent range of £1,732 to £2,572. The employment rate of 80.4% is above both the London average of 75.0% and the Great Britain average of 75.6%.
Healthcare provision for Merton residents is anchored by St Helier Hospital, which sits just across the border in the London Borough of Sutton and is run by Epsom and St Helier University Hospitals NHS Trust. Within Merton, the Nelson Health Centre in Wimbledon provides community health services, and the Wilson Hospital in Mitcham offers mental health services through South West London and St George's Mental Health NHS Trust.
Merton Economic Summary
- Population: 215,186 (2021 Census). Growth of 7.8% from 2011.
- Median annual salary: £50,844 (Merton), £46,415 (London), £39,125 (Great Britain)
- Employment rate: 80.4% (Merton), 75.0% (London), 75.6% (Great Britain)
- Unemployment rate: 3.5% (Merton), 5.6% (London), 4.3% (Great Britain)
- Key employment sectors: Professional services, healthcare, retail and leisure, education, transport and logistics
Source: ONS Census 2021, Nomis Labour Market Profile (ASHE 2025, Employment Oct 2024-Sep 2025)
Merton's unemployment rate of 3.5% is well below the London average of 5.6% and the national 4.3%. Combined with an employment rate that exceeds both benchmarks, this points to a borough where the working population is securely employed.
For buy-to-let investors, low unemployment and high earnings translate directly into reliable rental income collection. Merton's rental market draws tenants from professional services, healthcare, and education, three sectors with consistent London-wide demand.
Regeneration and Investment in Merton
More than £1 billion in regeneration investment is committed across Merton, with the largest schemes concentrated in the borough's eastern half. The three main projects span Morden town centre and three housing estates in Mitcham, Colliers Wood, and Morden.
- Remaking Morden (£30 million council commitment, designs by summer 2026): Merton Council agreed £30 million in January 2026 to drive regeneration of Morden town centre, with plans for thousands of new homes, a revitalised high street, and an evening economy. A private-sector development partner is being appointed to bring additional investment. Updates at Merton Council News.
- Clarion Housing Estate Regeneration (£1 billion, 2,800 homes across three estates): Clarion Housing is replacing around 1,000 existing homes and building 1,800 new homes across Eastfields (800 homes, construction underway), High Path (1,704 homes), and Ravensbury (over 200 homes). The programme includes new retail, leisure, and community spaces alongside environmental improvements and district heat networks. Updates at Clarion Housing Merton.
- Future Wimbledon Masterplan (SPD adopted November 2020): Merton Council's long-term vision for Wimbledon town centre development, setting out guidance for public space improvements, new investment, and economic growth in the SW19 area through to the 2040s. The supplementary planning document followed extensive community consultation from 2014 to 2020. Updates at Merton Council.

Merton Property Market Analysis
When Was the Last House Price Crash in Merton?
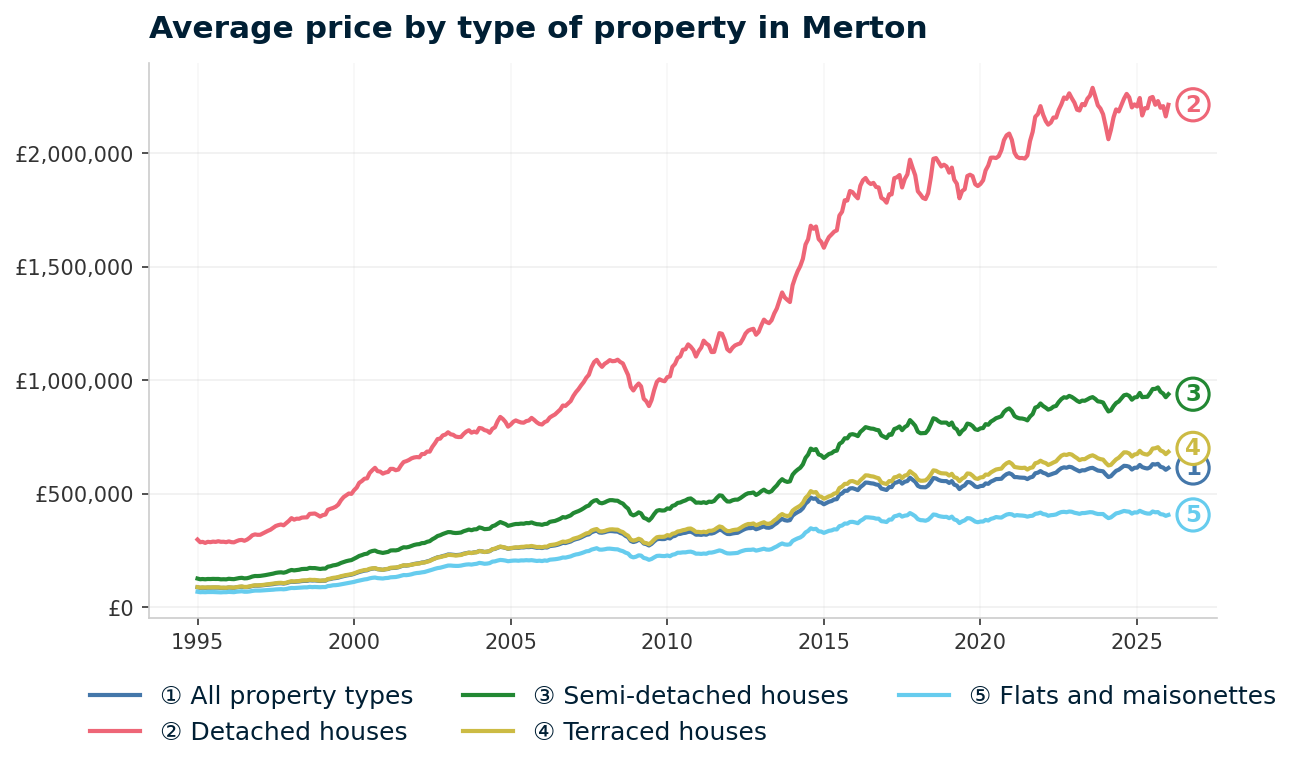
Merton's full house price history from the HM Land Registry House Price Index runs from January 1995 to January 2026. The data covers one major crash, a fast recovery, a London-wide boom, a Brexit-era stagnation, and a pandemic surge to all-time highs. For further context on how property cycles work, see our guide to the 18-year property cycle.
- 1995-2000 (Early growth): Merton started 1995 at £87,732. Prices barely moved in the first year, dipping to £86,883 by January 1996. Then the London market accelerated. By January 2000, Merton had reached £147,185, a gain of 68% in five years. Annual growth hit 26.0% in 2000 as demand spread outward from inner London into well-connected outer boroughs.
- 2000-2007 (The boom): Prices continued climbing. Merton passed £200,000 by mid-2002 and £250,000 by early 2005. The sharpest growth came in 2002-2003 at over 20% per year. By October 2007, the average reached its pre-crash peak of £337,846. The borough had nearly quadrupled from its 1995 starting point.
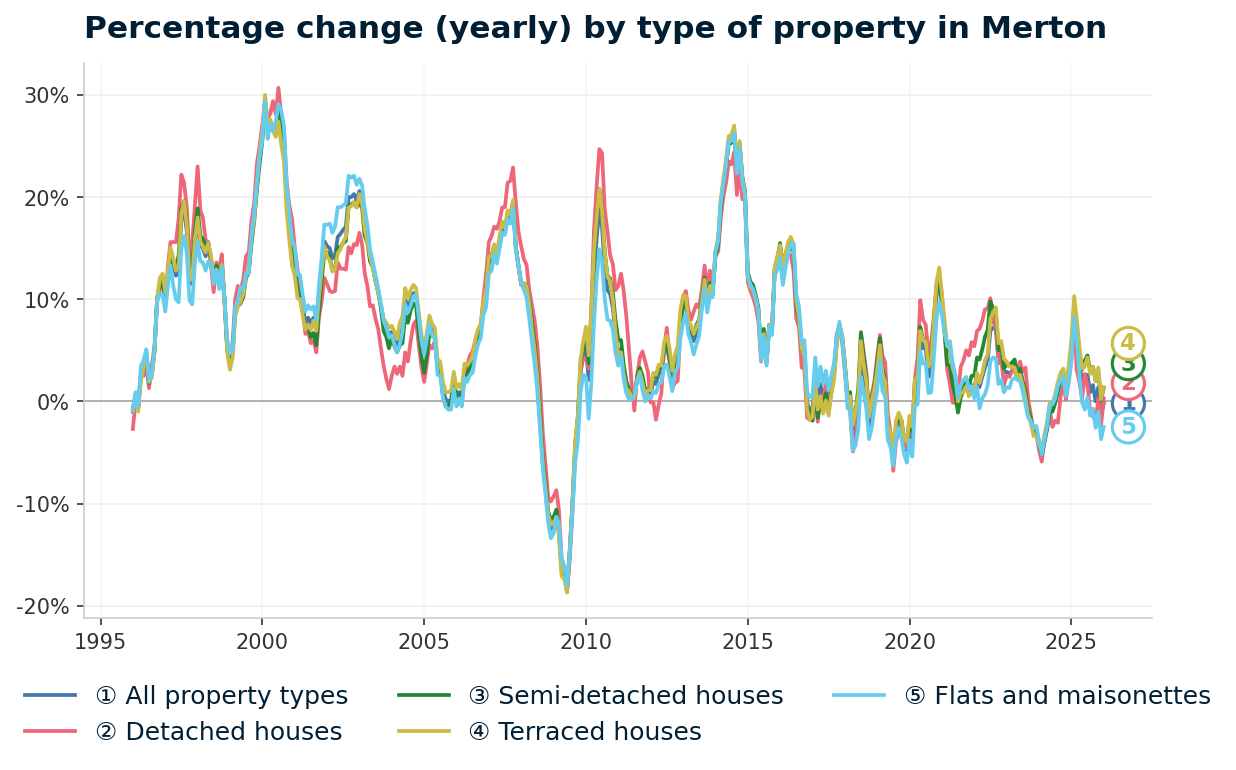
- 2007-2009 (The financial crisis): From the pre-crash peak of £337,846 in October 2007 to the trough of £272,172 in June 2009, Merton lost 19.4% of its value in 20 months. The worst annual change reading was -18.4% in June 2009. All property types fell at similar rates: detached houses -18.7%, semi-detached -19.1%, terraced houses -19.4%, and flats -19.7%. Merton's decline was steeper than both England (-12.2%) and the London regional average (-12.6%) at the same point, reflecting the sharper correction in outer London's premium markets.
Recovery, Boom, and New Highs
- 2009-2011 (Fast recovery): Merton bounced back quickly. Prices recovered to £341,783 by September 2011, surpassing the pre-crash peak just 27 months after the trough. That recovery speed was significantly faster than most UK cities outside London, where pre-crash levels took 8 to 12 years to regain.
- 2011-2015 (London boom): The capital's property surge hit Merton hard. Annual growth reached 20.2% in December 2014, and prices climbed from £320,129 in January 2011 to £513,158 by October 2015. Foreign investment, low interest rates, and constrained London supply all pushed prices well beyond pre-crash levels.
- 2016-2019 (Brexit stagnation): The London market cooled while the rest of the UK continued rising. Merton recorded -0.8% annual growth in January 2017 and ended 2019 at £529,125 with annual change of -4.8%. Four years of flat to negative returns marked this as the weakest period for London boroughs since the crash itself.
- 2020-2022 (Pandemic surge): The stamp duty holiday and demand for space reignited Merton's market. Prices jumped from £545,738 in March 2020 to £590,786 by December 2020, a single-year gain of 11.7%. Growth continued through 2022, reaching £616,849 by December. The borough's combination of green space, transport links, and relative affordability within London attracted pandemic-era buyers.
- 2023-2026 (Rate correction and new highs): Higher interest rates produced a modest correction. Prices dipped to £599,041 by December 2023, a decline of 2.9% from the previous year. Recovery followed: December 2024 hit £614,666 (+2.6%). The all-time high of £632,076 came in September 2025. The latest reading of £613,854 in January 2026 sits 81.7% above the pre-crash peak. For broader context on where UK house prices may head next, see our analysis of where next for UK house prices.
Long-Term Property Value Growth in Merton
- 5 years (2021-2026): +4.8% (£585,559 to £613,854)
- 10 years (2016-2026): +17.8% (£520,952 to £613,854)
- 15 years (2011-2026): +91.8% (£320,129 to £613,854)
- 20 years (2006-2026): +135.3% (£260,921 to £613,854)
- 30 years (1996-2026): +606.5% (£86,883 to £613,854)
The 2008 crash is the reference point for Merton investors assessing downside risk. A 19.4% decline took just 27 months to recover, far faster than the national average. The five-year growth figure of 4.8% reflects the flat-to-negative period of 2016-2019 still weighing on the rolling calculation. Over longer timeframes, Merton's growth of 606.5% over 30 years shows the compounding effect of London property ownership.
Source: HM Land Registry House Price Index for Merton
Source: HM Land Registry House Price Index for Merton, January 1995 to January 2026.
Thinking of Buying?
We have off-market investment properties averaging 8%+ annual yield.
View Property DealsSold House Prices in Merton
The average sold price in Merton of £613,854 is 111.4% above the England average of £290,437. That premium runs across every property type, but the gap varies enormously. Detached houses in Merton average £2,214,502, which is 372.6% above the England average for detached properties. Flats show the smallest gap at 86.2% above England, reflecting the borough's large stock of period conversions and purpose-built apartments.
| Property Type | Merton Average | England Average | Difference |
|---|---|---|---|
| Detached houses | £2,214,502 | £468,546 | +£1,745,956 (+372.6%) |
| Semi-detached houses | £938,910 | £288,046 | +£650,864 (+226.0%) |
| Terraced houses | £684,969 | £243,580 | +£441,389 (+181.2%) |
| Flats and maisonettes | £406,861 | £218,449 | +£188,412 (+86.2%) |
| All property types | £613,854 | £290,437 | +£323,417 (+111.4%) |
Detached houses in Merton carry a premium that reflects scarcity rather than size alone. Detached stock in south-west London is limited, and large family homes in areas like Wimbledon Village and Raynes Park attract buyers from across the capital. The £2.2 million average is driven by a handful of high-value streets where prices routinely exceed £3 million.
Semi-detached houses at £938,910 represent the second-largest premium at 226.0% above England. These are the traditional family homes of Merton's residential streets, concentrated in SW19, SW20, and KT3. The gap narrows as you move down the property ladder, reflecting the broader London pattern where larger homes carry disproportionate premiums.
Terraced houses at £684,969 sit 181.2% above England. The terraced stock varies widely across Merton, from Victorian terraces in Colliers Wood and Mitcham to larger Edwardian properties in Wimbledon. This property type offers the most practical entry point for investors seeking houses rather than flats.
Flats and maisonettes at £406,861 show the smallest premium at 86.2%. This is the most accessible entry to Merton's property market and the property type most likely to generate competitive yields. Flat values are sustained by rental demand from professionals commuting into central London via Wimbledon's District line or Morden's Northern line.
Property Data Sources
Our location guide relies on diverse, authoritative datasets including:
- HM Land Registry UK House Price Index
- Ministry of Housing, Communities and Local Government
- Ordnance Survey Data Hub
- Propertydata.co.uk
We update our property data quarterly to ensure accuracy. Last update: April 2026. All data is presented as provided by our sources without adjustments or amendments.
Price Per Square Foot in Merton
Sold prices per square foot in Merton range from £505 in CR4 to £801 in SW18, a spread of £296 per square foot across the borough. This table ranks postcodes by transaction-based sold price data, showing what buyers actually pay per square foot rather than listing estimates.
| Rank | Area | Price Per Sq Ft |
|---|---|---|
| 1 | CR4 (Mitcham) | £505 |
| 2 | SM4 (Morden) | £575 |
| 3 | KT3 (New Malden) | £620 |
| 4 | SW20 (Raynes Park, Wimbledon Chase) | £700 |
| 5 | SW17 (Tooting) | £731 |
| 6 | SW19 (Wimbledon, Colliers Wood) | £747 |
| 7 | SW18 (Wandsworth, Earlsfield) | £801 |
The price-per-square-foot ranking creates a clear east-west divide. CR4 and SM4, which cover Mitcham and Morden in the borough's eastern half, offer the lowest per-square-foot costs. The SW postcodes, which include Wimbledon, Tooting, and Earlsfield, all exceed £700. For investors calculating refurbishment costs or assessing value for money, a flat in CR4 at £505 per square foot delivers 37% more space per pound than the same spend in SW18 at £801. Investors looking for properties to add value through renovation can browse our renovation property finder.
For Sale Asking Prices in Merton
The mean asking price across Merton's 7 postcodes is £590,480. CR4 at £418,182 is the only postcode below £500,000, making Mitcham the clear entry point for investors looking at below market value properties in south-west London.
| Rank | Area | Asking Price |
|---|---|---|
| 1 | CR4 (Mitcham) | £418,182 |
| 2 | SM4 (Morden) | £505,651 |
| 3 | SW17 (Tooting) | £580,828 |
| 4 | SW19 (Wimbledon, Colliers Wood) | £609,068 |
| 5 | SW18 (Wandsworth, Earlsfield) | £613,105 |
| 6 | KT3 (New Malden) | £679,216 |
| 7 | SW20 (Raynes Park, Wimbledon Chase) | £727,312 |
The £309,130 gap between CR4 and SW20 is the widest spread in Merton's data. That gap buys an entirely different investment proposition. CR4's £418,182 entry point with a 5.0% yield is a different asset class from SW20's £727,312 with 3.9%. Investors looking to compare Merton's prices with the cheapest areas of London will find that CR4 sits below several inner London postcode averages. Those exploring lower-deposit routes into the market can see our guide on investment property with no deposit.

House Price Growth in Merton
Five-year growth in Merton ranges from -2.0% in SW19 to 15.6% in KT3. The growth data tells a different story from the yield data. KT3, which has the lowest yield at 3.9%, delivers the strongest capital growth. SW18, which ties for the top yield at 5.0%, also posts solid five-year growth of 7.0%. That combination is unusual in London.
| Area | 1 Year | 3 Years | 5 Years |
|---|---|---|---|
| KT3 (New Malden) | 2.8% | 21.3% | 15.6% |
| SM4 (Morden) | -2.3% | 3.4% | 9.8% |
| SW18 (Wandsworth, Earlsfield) | 8.5% | 5.2% | 7.0% |
| SW20 (Raynes Park, Wimbledon Chase) | 7.2% | 6.4% | 5.4% |
| CR4 (Mitcham) | -1.5% | -0.1% | 4.8% |
| SW17 (Tooting) | 2.3% | 3.9% | 1.7% |
| SW19 (Wimbledon, Colliers Wood) | 0.3% | -2.6% | -2.0% |
KT3's three-year growth of 21.3% is the standout figure in this table. New Malden has benefited from strong demand for family housing in an area that borders Kingston and offers good rail links. SW18 at 8.5% one-year growth is the fastest-moving postcode right now, recovering from the negative returns of 2019-2022 that affected Wandsworth and Earlsfield.
SW19's negative five-year growth of -2.0% reflects the post-2020 correction in Wimbledon's premium market. Prices in SW19 peaked before the pandemic and have not recovered to those levels. For investors focused on capital growth, KT3 and SW18 have outperformed. For investors focused on yield, the growth data is secondary to the income calculations in the sections that follow.
Monthly Property Sales in Merton
SW18 leads Merton's sales activity with 64 transactions per month, followed closely by SW19 at 63. These two postcodes account for nearly half of all monthly sales in the borough, reflecting the density of flats and the turnover of professional tenants in the Earlsfield and Wimbledon corridors.
| Area | Sales Per Month | Turnover | Asking Price |
|---|---|---|---|
| SW18 (Wandsworth, Earlsfield) | 64 | 8% | £613,105 |
| SW19 (Wimbledon, Colliers Wood) | 63 | 7% | £609,068 |
| SW17 (Tooting) | 46 | 7% | £580,828 |
| KT3 (New Malden) | 32 | 10% | £679,216 |
| CR4 (Mitcham) | 22 | 6% | £418,182 |
| SW20 (Raynes Park, Wimbledon Chase) | 22 | 6% | £727,312 |
| SM4 (Morden) | 21 | 14% | £505,651 |
SM4's turnover rate of 14% is the highest in the borough despite having the lowest sales volume. Morden's smaller housing stock means that 21 sales per month represents a proportionally high churn rate. For investors, high turnover can indicate strong demand and quicker sales when exiting a position. CR4 and SW20 share the lowest turnover at 6%, but for different reasons: CR4's lower price point attracts longer-term holders, while SW20's premium pricing slows transaction frequency.
Property Data Sources
Our location guide relies on diverse, authoritative datasets including:
- HM Land Registry UK House Price Index
- Ministry of Housing, Communities and Local Government
- Ordnance Survey Data Hub
- Propertydata.co.uk
We update our property data quarterly to ensure accuracy. Last update: April 2026. All data is presented as provided by our sources without adjustments or amendments.

Merton Rental Market Analysis
For investors weighing up whether rental property is a worthwhile investment in Merton, the data below breaks down average monthly rents and gross rental yields across the borough's 7 postcodes.
Monthly rents range from £1,732 in CR4 to £2,572 in SW18, and all 7 postcodes have rental data available. Flats to rent in Merton make up a large share of the rental market, particularly in SW19 (Wimbledon and Colliers Wood) and SW18 (Earlsfield), where purpose-built apartments and period conversions dominate the lettings stock. If you are looking to build a property portfolio in London, Merton's combination of reliable transport links and above-average local earnings supports consistent tenant demand across multiple price points.
Average Rent & Gross Rental Yields in Merton
Gross rental yields in Merton range from 3.9% to 5.0%, with CR4 and SW18 tied at the top. That 5.0% ceiling is modest by national standards but competitive for an outer London borough. To understand how these yields are calculated, see our guide on how to work out rental yield. For broader context on London yields, see which areas of London deliver the highest rental yields.
| Area | Monthly Rent | Asking Price | Gross Yield |
|---|---|---|---|
| CR4 (Mitcham) | £1,732 | £418,182 | 5.0% |
| SW18 (Wandsworth, Earlsfield) | £2,572 | £613,105 | 5.0% |
| SW17 (Tooting) | £2,381 | £580,828 | 4.9% |
| SM4 (Morden) | £1,971 | £505,651 | 4.7% |
| SW19 (Wimbledon, Colliers Wood) | £2,262 | £609,068 | 4.5% |
| KT3 (New Malden) | £2,198 | £679,216 | 3.9% |
| SW20 (Raynes Park, Wimbledon Chase) | £2,347 | £727,312 | 3.9% |
SW18 stands out as the postcode delivering London-level rents at a borough-level yield. Monthly rents of £2,572 are the highest in Merton, yet the yield still matches CR4's 5.0% because prices remain proportionate. For investors who want both income and a prime location, SW18 achieves what SW19 and SW20 cannot: top-tier rents without compressing the yield below 5%.
CR4 takes a different route to the same 5.0% yield. Rents of £1,732 are the lowest in the borough, but so is the asking price at £418,182. The maths works because the lower entry cost offsets the lower rent. CR4's yield story is about affordability, not premium rents.
Is Merton Rent High?
The median gross weekly salary in Merton is £977.80, which equates to £4,237 per month or £50,844 per year. This is above the London regional median of £892.60 per week and the Great Britain median of £752.40 per week. Data from the Nomis Labour Market Profile (ASHE 2025).
Monthly rents as a percentage of Merton's gross median salary range from 40.9% in CR4 to 60.7% in SW18. The table below shows how much of a single median earner's gross monthly income each postcode's average rent would absorb.
| Rank | Area | Rent as % of Income |
|---|---|---|
| 1 | SW18 (Wandsworth, Earlsfield) | 60.7% |
| 2 | SW17 (Tooting) | 56.2% |
| 3 | SW20 (Raynes Park, Wimbledon Chase) | 55.4% |
| 4 | SW19 (Wimbledon, Colliers Wood) | 53.4% |
| 5 | KT3 (New Malden) | 51.9% |
| 6 | SM4 (Morden) | 46.5% |
| 7 | CR4 (Mitcham) | 40.9% |
Every Merton postcode exceeds the 30% rent-to-income ratio commonly used as an affordability benchmark. This is a London-wide pattern, not a Merton-specific issue. The figure is based on a single median earner's gross salary. In practice, most Merton tenancies involve couples or sharers, which reduces the effective ratio. CR4 at 40.9% and SM4 at 46.5% are the most affordable for single earners, while SW18's 60.7% figure reflects the premium that tenants in the Earlsfield and Wandsworth corridors pay for the commute advantage.
Thinking of Buying?
We have off-market investment properties averaging 8%+ annual yield.
View Property DealsBuy-to-Let Considerations
Are House Prices High? Price-to-Earnings Ratios
Purchasing a property in Merton requires between 8.2 and 14.3 times the median annual salary. This is based on the Nomis Labour Market Profile for Merton showing the median gross annual income for Merton residents is £50,844.
| Rank | Area | Price-to-Earnings Ratio |
|---|---|---|
| 1 | CR4 (Mitcham) | 8.2x |
| 2 | SM4 (Morden) | 9.9x |
| 3 | SW17 (Tooting) | 11.4x |
| 4 | SW19 (Wimbledon, Colliers Wood) | 12.0x |
| 5 | SW18 (Wandsworth, Earlsfield) | 12.1x |
| 6 | KT3 (New Malden) | 13.4x |
| 7 | SW20 (Raynes Park, Wimbledon Chase) | 14.3x |
CR4's ratio of 8.2x is the only postcode in single digits. The typical mortgage lending limit of 4.5x income means a single median earner in Merton could borrow around £228,798. That covers 55% of CR4's average asking price and 31% of SW20's. These ratios illustrate why most buyers in Merton require either dual incomes or significant deposits.
The wide spread from 8.2x to 14.3x also reflects the diversity within the borough. CR4 at 8.2x is more typical of an outer London postcode. SW20 at 14.3x is pricing territory associated with prime London locations. Investors can use these ratios alongside the stamp duty calculator to model total acquisition costs.
Deposit Requirements in Merton
A 30% deposit on a buy-to-let property in Merton ranges from £125,455 in CR4 to £218,194 in SW20. Most buy-to-let mortgage lenders require a minimum 25% deposit, but 30% is the standard for accessing competitive rates. The table below shows the 30% deposit requirement for each postcode.
| Rank | Area | 30% Deposit Required |
|---|---|---|
| 1 | CR4 (Mitcham) | £125,455 |
| 2 | SM4 (Morden) | £151,695 |
| 3 | SW17 (Tooting) | £174,248 |
| 4 | SW19 (Wimbledon, Colliers Wood) | £182,721 |
| 5 | SW18 (Wandsworth, Earlsfield) | £183,931 |
| 6 | KT3 (New Malden) | £203,765 |
| 7 | SW20 (Raynes Park, Wimbledon Chase) | £218,194 |
The £26,240 step from CR4 to SM4 is the smallest gap in the table. For £26,240 more in deposit, an investor moves from Mitcham to Morden, picking up the Remaking Morden regeneration potential and a Northern line terminus connection. The £58,476 gap between the cheapest (CR4) and SW18 represents the cost of moving from the borough's most affordable postcode to one of its highest-yielding premium areas. Investors exploring buy-to-let property for sale in London can use these deposit figures to narrow their search.
What the Merton Data Tells Buy-to-Let Investors
Merton's top yield postcodes are CR4 and SW18, both at 5.0%, but they represent entirely different investment profiles. CR4 offers the lowest entry at £418,182 with a 30% deposit of £125,455 and rents of £1,732. SW18 requires £613,105 and a deposit of £183,931 but delivers the borough's highest rents at £2,572 per month. The yield is identical. The capital required and the tenant profile are not.
KT3 and SW18 are the two postcodes where both yield and growth data are positive across all timeframes. KT3 posts the strongest five-year growth at 15.6% alongside a 3.9% yield. SW18 combines 5.0% yield with 7.0% five-year growth and 8.5% one-year growth. These are the postcodes where the numbers point in the same direction on both income and capital.
SW19's data shows negative three-year (-2.6%) and five-year (-2.0%) growth alongside a mid-range yield of 4.5%. Wimbledon and Colliers Wood have not recovered from the 2020 correction in the same way other Merton postcodes have. The area has the second-highest sales volume at 63 per month, so there is liquidity. The growth figures are the concern.
Merton does not currently appear on the selective licensing register. Investors should verify the latest position with Merton Council before purchasing. For those considering alternative sourcing methods, off-market property and investment property listings may surface opportunities not visible on the open market. Merton also has bank and building society stock that periodically enters the market through repossessed houses for sale.
How Merton Compares
Merton's mean asking price of £590,480 sits between Lambeth's £582,904 and Wandsworth's £665,694. The comparison table below shows how Merton's headline figures stack up against four neighbouring London boroughs. Use our best buy-to-let locations guide for a wider view across the UK.
| Location | Mean Asking Price | Mean Monthly Rent | Top Gross Yield |
|---|---|---|---|
| Croydon | £464,760 | £1,717 | 5.4% |
| Bromley | £539,178 | £1,796 | 5.2% |
| Lambeth | £582,904 | £2,257 | 5.4% |
| Merton | £590,480 | £2,209 | 5.0% |
| Wandsworth | £665,694 | £2,651 | 5.1% |
Croydon offers the lowest mean asking price at £464,760, which is £125,720 below Merton, and the joint-highest top yield at 5.4%. Mean rents of £1,717 are substantially lower than Merton's £2,209. For investors prioritising yield and low entry cost over location prestige, Croydon's numbers are more aggressive.
Bromley at £539,178 sits between Croydon and Merton on price and delivers a 5.2% top yield with rents of £1,796. It covers a large geographic area with wide postcode variation.
Lambeth is the closest match to Merton on price (£582,904 vs £590,480) but outperforms on yield at 5.4% and rents at £2,257. Lambeth's proximity to central London and strong tenant demand from professionals gives it higher yields despite similar average prices.
Wandsworth is the most expensive comparison at £665,694 but commands the highest mean rent at £2,651. Its 5.1% top yield edge over Merton's 5.0% is marginal. SW18 straddles both boroughs, which means investors comparing these two are often looking at the same streets.
Frequently Asked Questions
Where is Merton in London?
Merton is an outer London borough in the south-west of the capital, classified by the ONS under code E09000024 and covering approximately 14.7 square miles. It borders Wandsworth to the north, Lambeth to the north-east, Croydon to the east, Sutton to the south, and Kingston upon Thames to the west. The borough's five main centres are Wimbledon, Mitcham, Morden, Raynes Park, and Colliers Wood.
Is Wimbledon in Merton?
Wimbledon is in the London Borough of Merton. Wimbledon town centre, Wimbledon Village, and the All England Lawn Tennis Club all fall within Merton's boundaries. Wimbledon station provides interchange between the District line (Wimbledon is the western terminus of the Wimbledon branch), National Rail services via South Western Railway and Thameslink, and Tramlink services to Croydon. The SW19 postcode covers both Wimbledon and Colliers Wood within Merton.
Is Merton a county?
No. Merton is a London borough, formally the London Borough of Merton, and one of 32 London boroughs plus the City of London that make up Greater London. The name sometimes causes confusion because the historic parish of Merton predates the 1965 creation of the London boroughs, and Merton Priory was a significant medieval religious house. The current borough was formed from the merger of the former Municipal Borough of Wimbledon, the Municipal Borough of Mitcham, and the Merton and Morden Urban District.
Is Merton a good place to live?
Merton's employment rate of 80.4% is above both the London (75.0%) and Great Britain (75.6%) averages. Median earnings of £50,844 per year are above the London regional median. The borough has tube, tram, and National Rail services. Population grew 7.8% between the 2011 and 2021 censuses to 215,186. Average property prices of £613,854 are 111.4% above the England average, which reflects sustained demand for housing in the area. Rents range from £1,732 to £2,572 per month across the borough's 7 postcodes.
How does Merton compare to Wandsworth for buy-to-let?
Merton's mean asking price of £590,480 is £75,214 below Wandsworth's £665,694, with lower mean monthly rents (£2,209 vs £2,651). Wandsworth's top gross yield of 5.1% is marginally above Merton's 5.0%. The two boroughs share the SW18 postcode, which covers Earlsfield and parts of Wandsworth town. SW18 is one of Merton's two highest-yielding postcodes at 5.0% with monthly rents of £2,572 and also records the borough's highest sales volume at 64 per month. For investors comparing the two boroughs, SW18 effectively spans both.
What are average house prices in Wimbledon?
SW19's current average asking price is £609,068, covering Wimbledon and Colliers Wood. The sold price per square foot is £747. SW19's gross rental yield is 4.5% with average monthly rents of £2,262. Five-year price growth in SW19 is -2.0%, making it the only Merton postcode with negative growth over that period. SW20, which covers Raynes Park and Wimbledon Chase, has a higher average asking price of £727,312 with a gross yield of 3.9%.