Where to Buy Property Investments in Carlisle: Yields of 5.7%
Carlisle's gross rental yields reach 5.7% in CA1 and 5.6% in CA2, the two postcodes with sufficient rental market data. Average sold prices across Cumberland sit 40.3% below the England average, and the city's population grew 2.33% to 110,024 between the 2011 and 2021 censuses.
Cumberland's average sold price of £174,281 places it among the most affordable local authority areas in England for buy-to-let investors. That is 19.8% below the North West regional average and 40.3% below the England figure of £291,865. Asking prices for houses for sale in Carlisle start from £163,551 in CA1, and rental data is available for 2 of the city's 8 postcodes. Carlisle features in our guide to the best buy-to-let locations in the UK. Browse current investment property opportunities.
This guide covers all 8 postcodes in the CA postcode area from CA1 to CA8 under the Cumberland unitary authority (ONS code E14001152). Cumberland was formed in April 2023 from the former Carlisle, Copeland, and Allerdale council districts. The postcodes in this guide cover the Carlisle portion of the authority, spanning the city centre, its suburbs, and the surrounding market towns. Investors comparing options in the North West may also consider Durham, Lancaster, Sunderland, or Blackpool. Browse all our North West location guides.
Article updated: March 2026
Carlisle Buy-to-Let Market Overview 2026
Carlisle combines some of the lowest property prices in England with local earnings above the national median, creating price-to-earnings ratios from 3.9x in the urban core.
- Average sold price: £174,281 (40.3% below England's £291,865)
- Asking price range: £163,551 (CA1) to £393,711 (CA8)
- Rental yields: 5.6% (CA2) to 5.7% (CA1) across the 2 postcodes with rental data
- Rental income: Monthly rents of £779 (CA1) to £780 (CA2)
- Price per sq ft: House prices from £154/sq ft (CA1) to £235/sq ft (CA4)
- Market activity: Sales ranging from 7 per month (CA5, CA6, CA8) to 48 per month (CA2)
- Deposit requirements: 30% deposits range from £49,065 (CA1) to £118,113 (CA8)
- Affordability ratios: Property prices from 3.9 to 9.3 times Cumberland's median annual salary of £42,461
Contents

-
by Robert Jones, Founder of Property Investments UK
With two decades in UK property, Rob has been investing in buy-to-let since 2005, and uses property data to develop tools for property market analysis.

Property Data Sources
Our location guide relies on diverse, authoritative datasets including:
- HM Land Registry UK House Price Index
- Ministry of Housing, Communities and Local Government
- Ordnance Survey Data Hub
- Propertydata.co.uk
We update our property data quarterly to ensure accuracy. Last update: March 2026. All data is presented as provided by our sources without adjustments or amendments. Learn more about Property Investments UK.
Why Invest in Carlisle?
Cumberland's median annual salary of £42,461 sits 8.5% above the Great Britain median of £39,125, while average sold prices of £174,281 are 40.3% below England's average. That creates price-to-earnings ratios among the lowest in England. CA1's ratio of 3.9x is roughly half the national benchmark of 7.5x.
Carlisle is the main city in Cumbria and the administrative centre for Cumberland Council. It sits at the junction of the M6 and A69, making it a strategic hub for distribution and logistics across the North of England and the Scottish Borders. Kingmoor Park, one of the largest commercial estates in the region, houses distribution, manufacturing, and food processing operations.
The University of Cumbria has its main campus in Carlisle, with a new centralised city centre campus under construction at the Citadels site. Cumberland Infirmary is the main acute hospital for the region, providing a stable base of NHS employment. Proximity to the Lake District and the Scottish Borders also supports a holiday let market in the surrounding rural postcodes.
Between the 2011 and 2021 censuses, Carlisle's population grew from 107,524 to 110,024, a rise of 2.33%. That is modest growth, but it reflects a stable population base rather than speculative expansion.
The employment rate of 78.8% is above both the North West (74.2%) and Great Britain (75.6%). Unemployment at 2.7% is well below the regional 4.1% and national 4.3%. That combination of above-average earnings and low unemployment is unusual for a location this affordable.
Carlisle Economic Summary
- Population: 110,024 (2021 Census). Growth of 2.33% from 2011.
- Median annual salary: £42,461 (Cumberland), £37,445 (North West), £39,125 (Great Britain)
- Employment rate: 78.8% (Cumberland), 74.2% (North West), 75.6% (Great Britain)
- Unemployment rate: 2.7% (Cumberland), 4.1% (North West), 4.3% (Great Britain)
- Key employment sectors: Distribution and logistics, public administration, manufacturing, healthcare, food processing, education
Source: ONS Census 2021, Nomis Labour Market Profile (ASHE 2025, Employment Oct 2024-Sep 2025)
For buy-to-let investors, the economic data creates a specific opportunity. Low property prices relative to local earnings mean tenants can afford rents comfortably. Both CA1 and CA2 show rent at just 22.0% of the local median gross monthly salary. That is well below the 30% threshold where affordability becomes stretched.
Regeneration and Investment in Carlisle
Cumberland Council's regeneration programme is concentrated on three projects that collectively represent over £340 million of investment into Carlisle and its immediate transport network.
- Carlisle Southern Link Road and St Cuthbert's Garden Village (under construction, £225.4m): The £225.4m CSLR opens in Spring 2026, providing direct road access to land allocated for St Cuthbert's Garden Village. The garden village will deliver up to 10,000 homes over the long term, making it one of the largest housing developments in the North of England. Updates at Cumberland Council CSLR Project.
- University of Cumbria Citadels Campus (under construction, £78.7m): A new centralised university campus in the city centre, bringing together the University of Cumbria's presence in the historic Citadels buildings. This creates permanent student population in the city centre and increases demand for student accommodation. Updates at University of Cumbria.
- Carlisle Station Gateway (under construction, £40.5m): Part of the Borderlands Inclusive Growth Deal, transforming Carlisle Station and its surroundings with £27m from the Borderlands Deal and £13.5m from the Department for Transport. Works begin Spring 2026 with completion expected February 2027. Updates at Cumberland Council.

Carlisle Property Market Analysis
When Was the Last House Price Crash in Carlisle?
Cumberland prices peaked at £132,667 in October 2007, fell 15.7% to £111,800 by May 2009, and took 13 years to recover the pre-crash level. That recovery timeline is one of the longest in England. Cumberland is the unitary authority covering Carlisle, along with the former Copeland and Allerdale council areas. All sold property prices from the HM Land Registry House Price Index are recorded at this level, not for Carlisle alone.
- 1995-2000 (Slow start): Cumberland began 1995 at £40,294. Prices dipped in 1996, falling to £39,252 with an annual change of -2.6%. By January 2000, the average had only reached £45,187. Five years of near-stagnation while southern England accelerated.
- 2000-2007 (The boom): Prices nearly tripled from £45,187 in January 2000 to a peak of £132,667 in October 2007. The sharpest growth came in 2003-2005, with annual changes exceeding 21% in January 2003 and 27% in January 2005. Cheap credit and strong demand from owner-occupiers pushed prices well beyond what local wages had historically supported.
- 2007-2009 (The financial crisis): From the peak of £132,667 in October 2007 to the trough of £111,800 in May 2009, Cumberland lost 15.7% of its value in 19 months. The worst annual change reading was -12.2% in May 2009. Cumberland's decline of 15.7% was less severe than both the North West region (18.2%) and England overall (18.2%).
- 2009-2013 (Stagnation): Prices bounced quickly off the trough. By January 2010, the average recovered to £119,797. But then growth stalled. Prices traded sideways between £114,000 and £120,000 for four years. By December 2013, the average was £114,598. Still 13.6% below the pre-crash peak.
- 2014-2019 (The long recovery): Growth returned but at a glacial pace. Annual changes of 2-4% gradually closed the gap. By January 2016, prices reached £122,370. By December 2019, £128,605. Still 3.1% below the October 2007 peak after more than a decade. Cumberland's recovery was significantly slower than most of England, where prices passed pre-crash levels by 2014-2016.
From November 2020 onward, the trajectory changed.
- 2020-2022 (Pandemic surge): Prices finally passed the pre-crash peak in November 2020 at £134,710, a recovery that took 13 years from the October 2007 peak. The stamp duty holiday accelerated growth. By December 2022, prices reached £158,097 with annual growth of 11.9%. That is 17.4% growth in just over two years.
- 2023 (Rate shock): Growth slowed sharply but prices held. December 2023 recorded £159,694, an annual increase of just 1.0%. No crash, but a clear pause.
- 2024-2025 (Resumed growth): Prices picked up again. December 2024 reached £165,028 (+3.3%) and December 2025 hit £174,281 (+5.6%). Cumberland now sits 31.4% above its pre-crash peak.
Long-Term Property Value Growth in Cumberland
- 5 years (2020-2025): +27.4% (£136,807 to £174,281)
- 10 years (2015-2025): +42.0% (£122,775 to £174,281)
- 15 years (2010-2025): +41.8% (£122,877 to £174,281)
- 20 years (2005-2025): +55.6% (£111,984 to £174,281)
- 30 years (1995-2025): +332.5% (£40,294 to £174,281)
The 15-year and 10-year figures are nearly identical (41.8% vs 42.0%) because prices between December 2010 (£122,877) and December 2015 (£122,775) were essentially flat. Five years of zero growth. That stagnation is the defining feature of Cumberland's post-crash market. The recovery did not begin in earnest until the pandemic-era surge in 2020.
The 13-year gap between the pre-crash peak and recovery is one of the longest in England. For current investors, that timeline is the reference point for assessing downside duration. The property market here recovers, but it does so slowly.
Source: HM Land Registry House Price Index for Cumberland
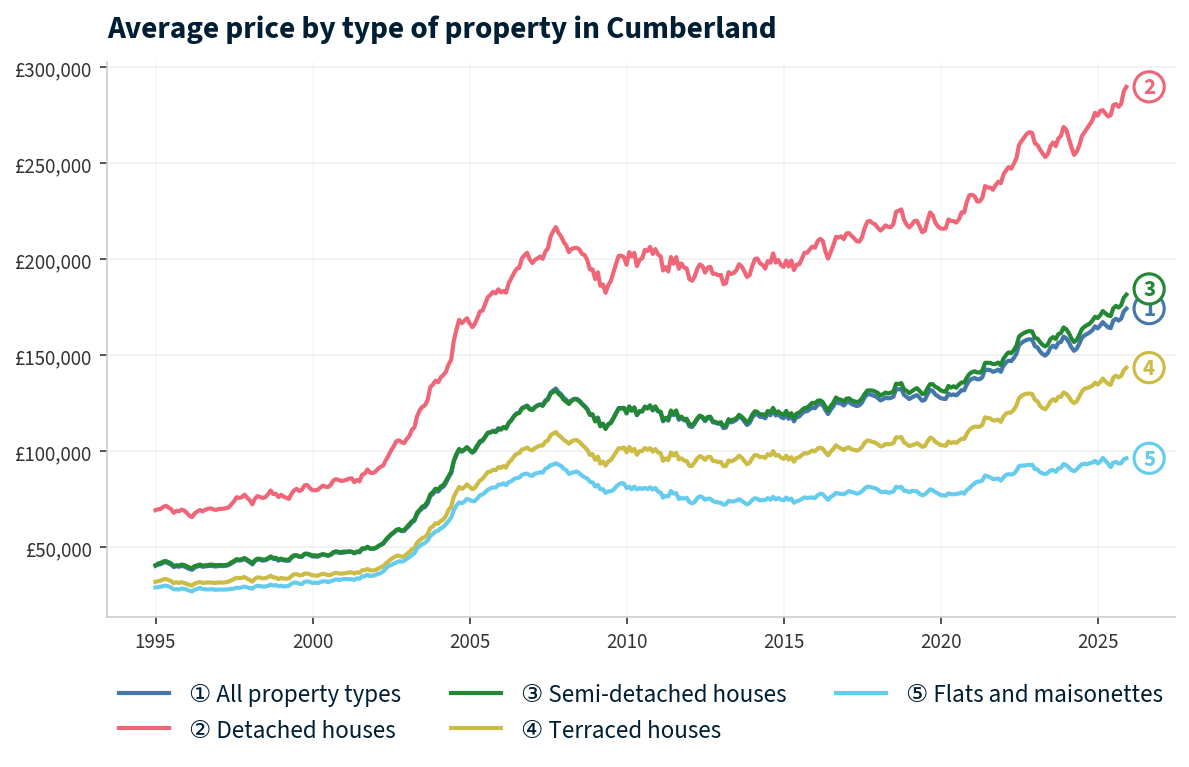
Source: HM Land Registry House Price Index for Cumberland, January 1995 to December 2025.
Thinking of Buying?
We have off-market investment properties averaging 8%+ annual yield.
View Property DealsSold House Prices in Carlisle
The latest sold house price index by the Land Registry confirms how far Cumberland sits below the national market. The headline figure of £174,281 is 40.3% below England's £291,865 and 19.8% below the North West's £217,428. That is one of the largest discounts to the national average in the country. But the scale of the gap varies sharply by property type.
Flats in Cumberland average £96,304. That is 56.1% below the England average of £219,340. No other property type comes close to that discount. It is the widest gap in Cumberland's market and reflects a housing stock dominated by converted terraces and smaller blocks rather than the high-value new-build apartment market seen in larger cities.
| Property Type | Cumberland Average | England Average | Difference |
|---|---|---|---|
| Detached houses | £289,818 | £471,667 | -38.6% |
| Semi-detached houses | £181,552 | £289,135 | -37.2% |
| Terraced houses | £143,534 | £244,830 | -41.4% |
| Flats and maisonettes | £96,304 | £219,340 | -56.1% |
| All property types | £174,281 | £291,865 | -40.3% |
Detached houses show a 38.6% discount at £289,818. Cumberland is a largely rural authority where detached properties make up a significant share of housing stock. The volume of detached homes keeps the average lower than in areas where detached houses are scarce and command a premium.
Semi-detached houses at £181,552 sit 37.2% below England's £289,135. Semis are the core family housing stock across Carlisle's suburbs in CA2 and CA3. For buy-to-let investors, this is the price point where most standard rental properties sit.
Terraced houses average £143,534, a 41.4% discount. The Victorian and Edwardian terraces in CA1 (City Centre, Botcherby) form the backbone of Carlisle's traditional rental stock. At this price point, even modest rents produce meaningful yield numbers.
Flats at £96,304 represent the deepest discount at 56.1%. Sub-£100,000 average flat prices create entry points that few locations in England can match. A 30% deposit on the average flat would be under £29,000. Investors looking for below market value properties will find that houses for sale in Carlisle sit well below national benchmarks across every property type.
Price Per Square Foot in Carlisle
Carlisle's price per square foot ranges from £154 in CA1 to £235 in CA4, a spread of 53% across eight postcodes. Price per square foot strips out property size bias and shows what you are actually paying for space. The urban core (CA1 and CA2) is the cheapest space in the area. The rural postcodes command more per square foot despite having larger properties, reflecting the premium on land and period homes in the countryside.
| Rank | Area | Price Per Sq Ft |
|---|---|---|
| 1 | CA1 (City Centre, Botcherby) | £154 |
| 2 | CA2 (Carlisle West, Morton) | £162 |
| 3 | CA7 (Wigton) | £196 |
| 4 | CA6 (Longtown, Brampton) | £209 |
| 5 | CA3 (Stanwix, Kingstown) | £218 |
| 6 | CA8 (Brampton) | £218 |
| 7 | CA5 (Dalston, Burgh by Sands) | £230 |
| 8 | CA4 (Wetheral, Armathwaite) | £235 |
CA1 at £154 per square foot is the cheapest space in Carlisle. This is the city centre and Botcherby area where terraced housing stock dominates. CA2 at £162 sits close behind. Together, these two postcodes offer the lowest cost per square foot and the only rental market data in the area. For investors, that combination of cheap space and proven rental demand is where the buy-to-let case is strongest.
CA3 and CA8 share the same price per square foot at £218 but represent very different markets. CA3 (Stanwix, Kingstown) is Carlisle's premium suburban postcode, a short walk from the city centre. CA8 (Brampton) is a market town 10 miles east. The per-foot cost is the same, but CA3 has 17 monthly sales and CA8 has 7. Liquidity matters alongside price.
CA4 (Wetheral, Armathwaite) tops the table at £235 per square foot. This is rural and village stock between Carlisle and the North Pennines. High per-foot costs in low-volume rural postcodes reflect period properties and larger plots rather than underlying market strength.
For Sale House Prices in Carlisle
Carlisle's asking prices range from £163,551 in CA1 to £393,711 in CA8, a 2.4x spread from cheapest to most expensive. The gap between CA2 (£168,064) and CA3 (£232,042) is where the market splits. Below that line sits the affordable urban core. Above it sits the rural and suburban hinterland where prices are 40-140% higher.
| Rank | Area | Average Asking Price |
|---|---|---|
| 1 | CA1 (City Centre, Botcherby) | £163,551 |
| 2 | CA2 (Carlisle West, Morton) | £168,064 |
| 3 | CA3 (Stanwix, Kingstown) | £232,042 |
| 4 | CA7 (Wigton) | £252,745 |
| 5 | CA6 (Longtown, Brampton) | £296,490 |
| 6 | CA4 (Wetheral, Armathwaite) | £347,446 |
| 7 | CA5 (Dalston, Burgh by Sands) | £356,471 |
| 8 | CA8 (Brampton) | £393,711 |
CA1 and CA2 cluster within £5,000 of each other. For investors, the entry price is essentially the same across both postcodes. The decision between them comes down to tenant profile and growth trajectory rather than affordability. CA2 has stronger five-year growth at 18.8% compared to CA1's 9.1%, but CA1 delivers the higher yield at 5.7%.
CA3 Stanwix at £232,042 is the most accessible of the non-urban postcodes. It is Carlisle's premium residential area, favoured by owner-occupiers and families. There is no rental data for CA3, which limits its appeal for income-focused investors. But it has the strongest one-year growth in the area at 7.5%.
The mean asking price across all eight Carlisle postcodes is £276,315. That figure appears in the comparison section later, where Carlisle is measured against Durham, Sunderland, Blackpool, and Lancaster. The mean is skewed upward by the rural postcodes. The two investable postcodes (CA1 and CA2) sit at roughly 60% of the mean.

House Price Growth in Carlisle
Five-year growth ranges from -1.6% in CA5 to 32.9% in CA6, with seven of eight postcodes in positive territory. That 34.5 percentage-point spread is driven by the rural postcodes, where low transaction volumes create volatile figures. The two urban postcodes (CA1 and CA2) delivered 9.1% and 18.8% respectively. One-year growth can swing on a handful of transactions, particularly in postcodes with fewer than 10 sales per month.
| Area | 1 Year | 3 Years | 5 Years |
|---|---|---|---|
| CA6 (Longtown, Brampton) | 5.2% | 26.2% | 32.9% |
| CA8 (Brampton) | 6.6% | 2.5% | 21.4% |
| CA2 (Carlisle West, Morton) | 4.6% | 8.6% | 18.8% |
| CA3 (Stanwix, Kingstown) | 7.5% | 9.5% | 16.5% |
| CA1 (City Centre, Botcherby) | 5.4% | 0.9% | 9.1% |
| CA4 (Wetheral, Armathwaite) | -0.5% | -10.4% | 7.0% |
| CA7 (Wigton) | -4.6% | -0.3% | 3.7% |
| CA5 (Dalston, Burgh by Sands) | -9.7% | -6.6% | -1.6% |
CA6 Longtown's 32.9% five-year growth is the headline figure, but it requires context. CA6 averages 7 sales per month. At that volume, a small number of higher-value transactions can move the average significantly. The 26.2% three-year figure and 5.2% one-year growth suggest the momentum is genuine, but the thin market means the numbers carry more noise than in CA1 or CA2.
CA2 is the standout among the investable postcodes. At 18.8% five-year growth with 48 monthly sales, this is a liquid market with consistent appreciation. CA1 at 9.1% over five years has grown more slowly, but the one-year figure of 5.4% suggests acceleration. CA1's three-year growth of just 0.9% tells you that most of the five-year gain came early in the window, likely during the pandemic-era stamp duty holiday.
Three postcodes show negative one-year growth. CA4 (-0.5%), CA7 (-4.6%), and CA5 (-9.7%) are all rural or semi-rural areas with low transaction volumes. CA5 is the only postcode negative across all three time periods. At 7 sales per month and 12% turnover, this is a thin, slow-moving market where the average can shift on a few transactions.
Monthly Property Sales in Carlisle
Carlisle records 153 property transactions per month across all eight postcodes, with CA2 (48 sales) and CA1 (35 sales) accounting for more than half. The remaining six postcodes range from 7 to 21 monthly sales. For buy-to-let investors, transaction volume is an exit strategy question. A liquid market means you can sell when you need to.
| Area | Sales Per Month | Turnover | Asking Price |
|---|---|---|---|
| CA2 (Carlisle West, Morton) | 48 | 47% | £168,064 |
| CA1 (City Centre, Botcherby) | 35 | 60% | £163,551 |
| CA7 (Wigton) | 21 | 31% | £252,745 |
| CA3 (Stanwix, Kingstown) | 17 | 39% | £232,042 |
| CA4 (Wetheral, Armathwaite) | 11 | 69% | £347,446 |
| CA6 (Longtown, Brampton) | 7 | 18% | £296,490 |
| CA5 (Dalston, Burgh by Sands) | 7 | 12% | £356,471 |
| CA8 (Brampton) | 7 | 9% | £393,711 |
CA1 has the highest turnover at 60% despite fewer sales than CA2. That tells you properties change hands relatively quickly in the city centre. CA4 (Wetheral) also shows high turnover at 69%, but with only 11 sales per month the percentage is driven by a small pool of listed properties rather than deep demand.
CA8 Brampton at 9% turnover is the least liquid postcode. Seven sales per month in a market town east of Carlisle means stock rarely comes to market and sells slowly when it does. For exit strategy planning, CA2 and CA1 are the only postcodes where an investor could expect to sell within a reasonable timeframe.

Carlisle Rental Market Analysis
For investors weighing up whether rental property is a worthwhile investment in Carlisle, the data below breaks down average monthly rents and gross rental yields across the city's postcodes.
Rental data is available for 2 of 8 postcodes. CA1 (City Centre, Botcherby) and CA2 (Carlisle West, Morton) have sufficient current listings for reliable figures, covering houses and flats to rent in Carlisle's urban core. The remaining six postcodes do not have enough rental market activity to generate statistically meaningful data. Monthly rents in the two active postcodes are £779 and £780 with gross yields of 5.7% and 5.6%. If you are looking to build a property portfolio in the North West, Carlisle's combination of low entry prices and above-average local earnings creates a tight affordability profile for tenants.
Average Rent & Gross Rental Yields in Carlisle
CA1 delivers Carlisle's highest gross yield at 5.7%, where monthly rents of £779 meet asking prices of £163,551. CA2 sits close at 5.6% with near-identical rents of £780 against a slightly higher asking price of £168,064. The yield spread between the two investable postcodes is just 0.1 percentage points. Six of eight postcodes have no rental data. Gross rental yield is calculated from average asking price and average monthly rent. It does not account for void periods, maintenance, management fees, or mortgage costs.
| Area | Average Monthly Rent | Average Asking Price | Gross Yield |
|---|---|---|---|
| CA1 (City Centre, Botcherby) | £779 | £163,551 | 5.7% |
| CA2 (Carlisle West, Morton) | £780 | £168,064 | 5.6% |
| CA3 (Stanwix, Kingstown) | Not enough data | £232,042 | Not enough data |
| CA4 (Wetheral, Armathwaite) | Not enough data | £347,446 | Not enough data |
| CA5 (Dalston, Burgh by Sands) | Not enough data | £356,471 | Not enough data |
| CA6 (Longtown, Brampton) | Not enough data | £296,490 | Not enough data |
| CA7 (Wigton) | Not enough data | £252,745 | Not enough data |
| CA8 (Brampton) | Not enough data | £393,711 | Not enough data |
The absence of rental data in six postcodes is itself a data point. It tells you that the lettings market outside the city centre and western Carlisle is too thin to produce reliable averages. CA3 through CA8 are predominantly owner-occupier markets. Properties in these postcodes are bought by families, retirees, and rural lifestyle buyers rather than landlords.
The near-identical rents in CA1 (£779) and CA2 (£780) reflect a single rental market. Both postcodes draw from the same tenant pool: working professionals, key workers, and smaller households priced out of CA3's suburban stock. The 0.1% yield difference is driven entirely by the £4,500 gap in asking prices, not by any meaningful difference in rental demand.
Is Carlisle Rent High?
Both Carlisle postcodes with rental data show rent at just 22.0% of the local median gross monthly salary. That is well below the 30% threshold where affordability is generally considered stretched. For tenants, it means sustainable payments. For landlords, lower affordability pressure tends to produce more reliable tenants and fewer arrears.
The median gross weekly salary in Cumberland is £816.60, which equates to £3,539 per month or £42,461 per year. This is above the North West regional median of £720.10 per week and the Great Britain median of £752.40 per week. Data from the Nomis Labour Market Profile (ASHE 2025).
| Rank | Area | Rent as % of Income |
|---|---|---|
| 1 | CA1 (City Centre, Botcherby) | 22.0% |
| 2 | CA2 (Carlisle West, Morton) | 22.0% |
| — | CA3 (Stanwix, Kingstown) | Not enough data |
| — | CA4 (Wetheral, Armathwaite) | Not enough data |
| — | CA5 (Dalston, Burgh by Sands) | Not enough data |
| — | CA6 (Longtown, Brampton) | Not enough data |
| — | CA7 (Wigton) | Not enough data |
| — | CA8 (Brampton) | Not enough data |
22.0% is one of the lowest rent-to-income ratios in any PIUK location guide. Most cities in the North show rent consuming 25-35% of gross income. Carlisle's figure is suppressed by the unusual combination of modest rents (£779-£780) and above-average local earnings (£42,461). The result is a market where tenants have significant financial headroom.
That headroom has a practical implication for landlords. Tenants paying 22% of their gross income on rent have a larger buffer against income shocks than tenants paying 35%. This does not eliminate void periods or arrears, but it reduces the probability. For investors running cash flow projections, a low rent-to-income ratio provides a margin of safety that higher-yielding but higher-risk locations do not.
Thinking of Buying?
We have off-market investment properties averaging 8%+ annual yield.
View Property DealsBuy-to-Let Considerations
Are Carlisle House Prices High? Price-to-Earnings Ratios
Purchasing a property in Carlisle requires between 3.9 and 9.3 times the local median annual salary of £42,461. The price-to-earnings ratio compares a postcode's average asking price to the Nomis Labour Market Profile for Cumberland median salary. The national benchmark is 7.5x, calculated from England's average sold price of £291,865 against Great Britain's median of £39,125.
Five of Carlisle's eight postcodes sit below the national benchmark of 7.5x. CA1 at 3.9x and CA2 at 4.0x are roughly half the national figure. Even CA3 (5.5x) and CA7 (6.0x) sit comfortably below. CA4 (8.2x), CA5 (8.4x) and CA8 (9.3x) exceed the benchmark, all three rural postcodes with low transaction volumes.
| Rank | Area | Price-to-Earnings Ratio |
|---|---|---|
| 1 | CA1 (City Centre, Botcherby) | 3.9x |
| 2 | CA2 (Carlisle West, Morton) | 4.0x |
| 3 | CA3 (Stanwix, Kingstown) | 5.5x |
| 4 | CA7 (Wigton) | 6.0x |
| 5 | CA6 (Longtown, Brampton) | 7.0x |
| 6 | CA4 (Wetheral, Armathwaite) | 8.2x |
| 7 | CA5 (Dalston, Burgh by Sands) | 8.4x |
| 8 | CA8 (Brampton) | 9.3x |
CA1 at 3.9x is driven by the combination of low asking prices and high local earnings. A median earner in Cumberland could buy the average CA1 property for less than four years' gross salary. That level of affordability is rare in England. It reflects a market where property prices have not kept pace with earnings, which is exactly the dynamic that supports sustainable rental demand.
CA6 at 7.0x sits just below the benchmark, while CA4 (8.2x), CA5 (8.4x) and CA8 (9.3x) exceed it. All four are rural or market town postcodes where prices are set by lifestyle demand rather than local wages. Buyers in these areas tend to be relocators from higher-priced regions or rural lifestyle purchasers, not local workers.
For investors comparing Carlisle's affordability against other Northern cities, the 3.9x ratio in CA1 is lower than most. Investors buying their first rental property may find Carlisle's entry-level ratios particularly accessible.
Deposit Requirements in Carlisle
Carlisle's 30% deposit requirements range from £49,065 in CA1 to £118,113 in CA8. The two investable postcodes both require deposits under £51,000, substantially lower than most locations in this series. The table below uses 30% rather than the minimum 25% to reflect the rates and products available at higher loan-to-value ratios.
| Rank | Area | 30% Deposit Required |
|---|---|---|
| 1 | CA1 (City Centre, Botcherby) | £49,065 |
| 2 | CA2 (Carlisle West, Morton) | £50,419 |
| 3 | CA3 (Stanwix, Kingstown) | £69,613 |
| 4 | CA7 (Wigton) | £75,824 |
| 5 | CA6 (Longtown, Brampton) | £88,947 |
| 6 | CA4 (Wetheral, Armathwaite) | £104,234 |
| 7 | CA5 (Dalston, Burgh by Sands) | £106,941 |
| 8 | CA8 (Brampton) | £118,113 |
The £1,354 gap between CA1 (£49,065) and CA2 (£50,419) is negligible. Both postcodes deliver yields above 5.5% and sit at sub-4x price-to-earnings ratios. The deposit difference is a rounding error. The choice between them is about growth trajectory (CA2 at 18.8% five-year) versus current yield (CA1 at 5.7%).
A clear step up separates the urban pair from the rest. CA3 at £69,613 is 42% more than CA1, and it comes without any rental data. The further you move from Carlisle's core, the higher the capital requirement and the thinner the evidence of rental demand.
Deposit is only part of the upfront cost. Budget for stamp duty (use our stamp duty calculator for an accurate figure), legal fees, and survey costs. For a full breakdown, see our guide to buy-to-let costs.

What the Carlisle Data Tells Buy-to-Let Investors
For yield and rental evidence, the data points to CA1 (5.7%) and CA2 (5.6%). These are the only postcodes with rental market data. Both require 30% deposits under £51,000 and sit at sub-4x price-to-earnings ratios.
CA1 has higher turnover (60%) and the cheapest space at £154 per square foot. CA2 has stronger five-year growth (18.8% vs 9.1%) and higher monthly sales volume (48 vs 35). The rents are essentially identical.
For capital growth, CA2 leads the investable postcodes at 18.8% over five years. CA6 (32.9%) and CA8 (21.4%) show stronger headline growth, but neither has rental data, both average just 7 sales per month, and deposits exceed £88,000. The growth figures in low-volume postcodes carry more statistical noise than in CA1 and CA2 where the transaction base is deeper.
Six of eight postcodes have no rental data. CA3 through CA8 cover Carlisle's suburbs, rural villages, and surrounding market towns. These are owner-occupier markets with limited letting activity. The data does not support a buy-to-let case in these postcodes.
CA5 (Dalston, Burgh by Sands) is negative across all three growth periods and has the lowest turnover at 12%. CA4 (Wetheral, Armathwaite) shows -10.4% three-year growth. The numbers in these postcodes reflect rural market conditions, not Carlisle's urban rental market.
Carlisle does not currently appear on the selective licensing register. Investors considering HMO conversions in the CA1 student corridor should check Cumberland Council's latest licensing requirements directly.
How Carlisle Buy-to-Let Compares to Nearby Areas
Carlisle's top yield of 5.7% matches Durham and sits behind Sunderland (10.2%) and Blackpool (6.3%), but its rent-to-income ratio of 22.0% is the lowest in this group. The table below compares Carlisle against four nearby alternatives using the same methodology: mean asking price across all postcodes, mean monthly rent across postcodes with data, and top single-postcode gross yield. Explore all locations on the Property Investments UK homepage.
| Location | Mean Asking Price | Mean Monthly Rent | Top Gross Yield |
|---|---|---|---|
| Sunderland | £163,545 | £695 | 10.2% |
| Durham | £183,073 | £765 | 5.7% |
| Blackpool | £198,183 | £750 | 6.3% |
| Carlisle | £276,315 | £779 | 5.7% |
| Lancaster | £278,238 | £906 | 5.5% |
Carlisle's mean asking price of £276,315 looks expensive in this group, but the figure is misleading. The mean is pulled upward by six rural postcodes with asking prices from £232,042 to £393,711. The two investable postcodes (CA1 at £163,551 and CA2 at £168,064) sit in line with Sunderland's mean and below Durham. The actual entry cost for a Carlisle buy-to-let is closer to the bottom of this table than the middle.
Blackpool and Sunderland show higher top yields (6.3% and 10.2%), but Carlisle's rent-to-income ratio of 22.0% is lower than both. Higher yields in those locations come alongside higher affordability pressure on tenants. Lancaster is the closest comparison in character: a similar-sized northern city with a university, strong local employment, and near-identical mean asking prices. Lancaster's higher rents (£906 vs £779) but lower top yield (5.5% vs 5.7%) tell you its price-to-rent ratio is less favourable despite the premium rents.
Carlisle's distinctive advantage is affordability relative to local earnings. A price-to-earnings ratio of 3.9x in CA1 is lower than the entry-level postcode in any of these four comparison locations. That is the product of above-average local wages meeting below-average property prices. For investors comparing buy-to-let property investments for sale across the North, Carlisle's affordability metrics stand out.
Frequently Asked Questions
Is Carlisle a good place to live for renters?
Rents in Carlisle take just 22.0% of the local median gross monthly salary, well below the 30% affordability threshold. CA1 and CA2 postcodes average £779-£780 per month, making Carlisle one of the more affordable rental markets in England relative to local earnings.
The city has direct rail connections to London (3.5 hours), Edinburgh, Manchester, and Newcastle. Access to the Lake District and the Scottish Borders adds a quality-of-life factor that larger northern cities cannot match. Employment is anchored by public sector, logistics, manufacturing, and NHS roles, with the university adding to the mix.
What are the best areas of Carlisle for buy-to-let?
CA1 (City Centre, Botcherby) and CA2 (Carlisle West, Morton) are the two postcodes with rental market data in Carlisle. CA1 offers the higher gross yield at 5.7% with a 30% deposit of £49,065 and the lowest price per square foot at £154. CA2 has stronger five-year capital growth at 18.8% and higher monthly sales volume at 48 transactions.
Both postcodes sit at sub-4x price-to-earnings ratios. The remaining six postcodes are predominantly owner-occupier markets without sufficient letting activity to generate reliable rental data.
Is there an HMO market in Carlisle?
There is a small HMO market, driven primarily by the University of Cumbria's city centre campus and demand for shared accommodation in CA1. The new Citadels campus (£78.7m) will centralise the university's Carlisle presence, which may increase demand for student lets in CA1 and CA2.
Carlisle's HMO market is smaller than in major university cities. For a broader view of the student accommodation sector, see our guide to purpose-built student accommodation. Check Cumberland Council's current HMO licensing requirements before converting.
How does Carlisle compare to Lancaster for buy-to-let?
Carlisle and Lancaster have near-identical mean asking prices (£276,315 vs £278,238). Lancaster commands higher average rents (£906 vs £779) driven by its larger university and stronger student market. Carlisle's top yield (5.7%) edges Lancaster's (5.5%) because the entry-level postcodes are cheaper: CA1 at £163,551 versus Lancaster's lowest postcodes above £180,000. Carlisle's standout advantage is local earnings. Cumberland's median annual salary of £42,461 is significantly higher than Lancaster's, which creates a price-to-earnings ratio of 3.9x in CA1. That level of affordability relative to local wages is difficult to find in Lancaster or most other northern cities.
Will the Citadels Campus and CSLR affect Carlisle property prices?
Both projects are under construction and represent £304m of combined investment. The Citadels Campus (£78.7m) centralises the University of Cumbria's Carlisle presence in the city centre, creating permanent student footfall and accommodation demand in the CA1 area.
The Carlisle Southern Link Road (£225.4m) opens Spring 2026 and unlocks land for St Cuthbert's Garden Village, planned for up to 10,000 homes. The CSLR is a long-term infrastructure play. The garden village will take decades to build out fully. For investors, the Citadels campus is the nearer-term catalyst. The CSLR and garden village represent generational supply that may moderate price growth in the medium term even as it adds new tenant populations.