North London Buy-to-Let Investment: Hotspots and Opportunities
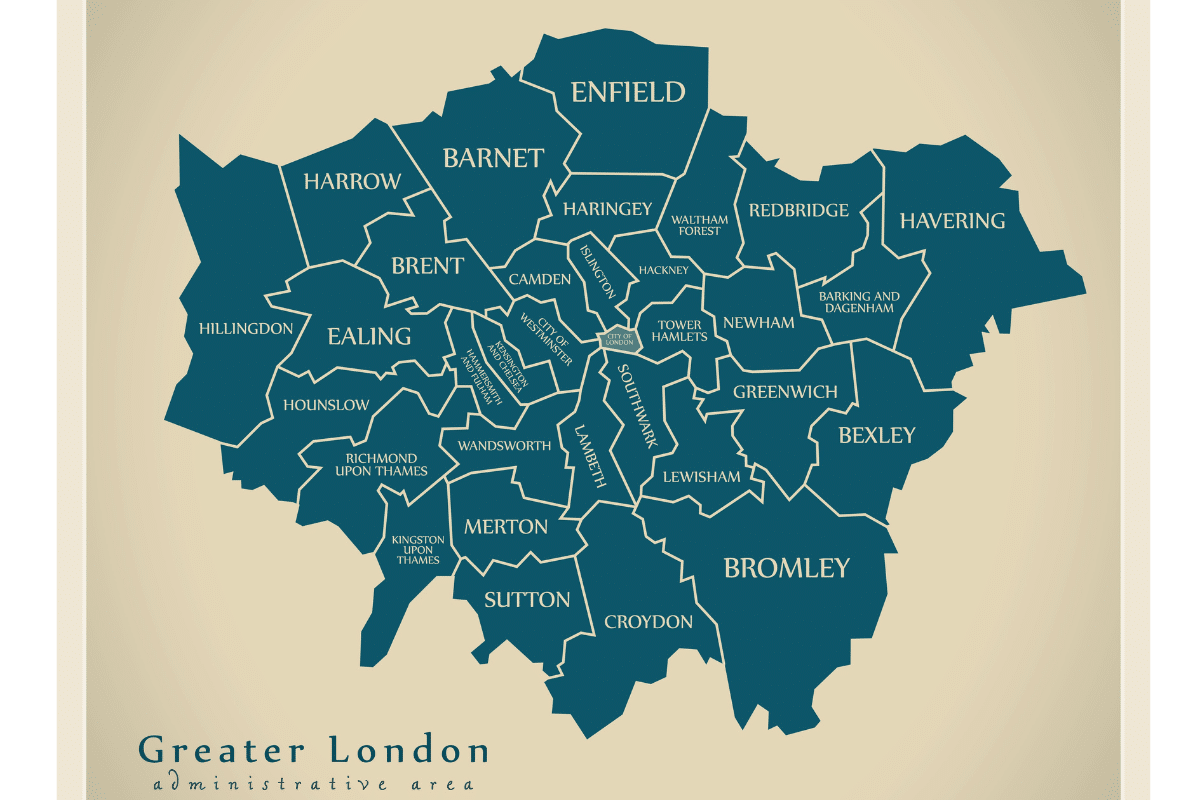
North London’s buy-to-let market presents a wide range of opportunities for investors, from affordable properties with high rental yields to premium locations with strong tenant demand.
In areas like EN3 (Enfield), where the population reaches 55,687, investors can find affordable entry points with house prices around £382,000 and impressive yields of up to 5.8%. These figures make it a prime location for those looking to maximise returns in more suburban settings. Meanwhile, NW5 (Camden) offers a balanced investment opportunity, appealing to professionals with house prices averaging £653,000 and rental yields of 5.6%, driven by its mid-range population of 30,948 and convenient city access.
For those looking to invest in more premium areas, N1 (Islington), with a high population of 89,861, provides long-term growth potential. Property prices average £749,000, with solid yields of 4.6% and a high price per square foot of £963, making it popular among city professionals. On the other hand, N18 (Enfield) offers a different appeal with lower house prices of around £398,000 and yields of 5.6%, attracting investors looking for strong returns on a budget. Areas like E2 (Hackney), known for their creative vibrancy, boast high prices per square foot at £779, with rental yields of 5.3%, making them ideal for investors interested in short-term tenants from the professional and creative sectors. For a detailed breakdown of property prices, rental yields, and population statistics by postcode, continue reading below to explore the full datasets.

-
by Robert Jones, Founder of Property Investments UK
With two decades in UK property, Rob has been investing in buy-to-let since 2005, and uses property data to develop tools for property market analysis.

Property Data Sources
Our location guide relies on diverse, authoritative datasets including:
- HM Land Registry UK House Price Index
- Ministry of Housing, Communities and Local Government
- Ordnance Survey Data Hub
- Propertydata.co.uk
We update our property data quarterly to ensure accuracy. Last update: September 2024. Next update: December 2024. All data is presented as provided by our sources without adjustments or amendments.
Top Buy-to-Let Hotspots in North London
Barnet
Barnet is known for its family-friendly neighbourhoods, excellent schools, and green spaces. Key areas within Barnet include Finchley (N3, N12), High Barnet (EN5), and Golders Green (NW11). These areas boast suburban charm and urban convenience, with easy access to central London via the Northern Line. The presence of good schools and parks like Victoria Park makes Barnet particularly attractive to families.
Barnet postcode districts include: EN4, EN5, N2, N3, N10, N12, N20, NW4, NW7, NW11
Discover more about Barnet buy-to-let.
Barnet Property Prices
| Postcode | Average House Price £ | Average £ per sq ft | Average Rental Yield % |
|---|---|---|---|
| NW11 | £1,048,918 | £770 | 2.8% |
| N2 | £957,626 | £754 | 3.1% |
| N20 | £816,572 | £645 | 3.0% |
| EN4 | £763,837 | £633 | 3.7% |
| N10 | £717,908 | £755 | 3.3% |
| NW7 | £703,933 | £634 | 3.8% |
| N3 | £691,359 | £642 | 3.6% |
| EN5 | £666,502 | £605 | 3.3% |
| NW4 | £597,802 | £585 | 4.0% |
| N12 | £530,920 | £612 | 4.6% |
Barnet Housing Market
| Postcode | Population | Density per square mile | Average Property Sales per Month |
|---|---|---|---|
| EN5 | 37,084 | 3,960 | 22 |
| NW11 | 32,495 | 15,558 | 14 |
| NW4 | 31,690 | 17,404 | 13 |
| N12 | 28,741 | 13,525 | 15 |
| N10 | 27,532 | 16,779 | 10 |
| N3 | 26,584 | 17,080 | 10 |
| EN4 | 25,751 | 5,612 | 16 |
| NW7 | 25,131 | 6,040 | 15 |
| N2 | 23,878 | 12,448 | 13 |
| N20 | 18,967 | 5,282 | 13 |
Camden
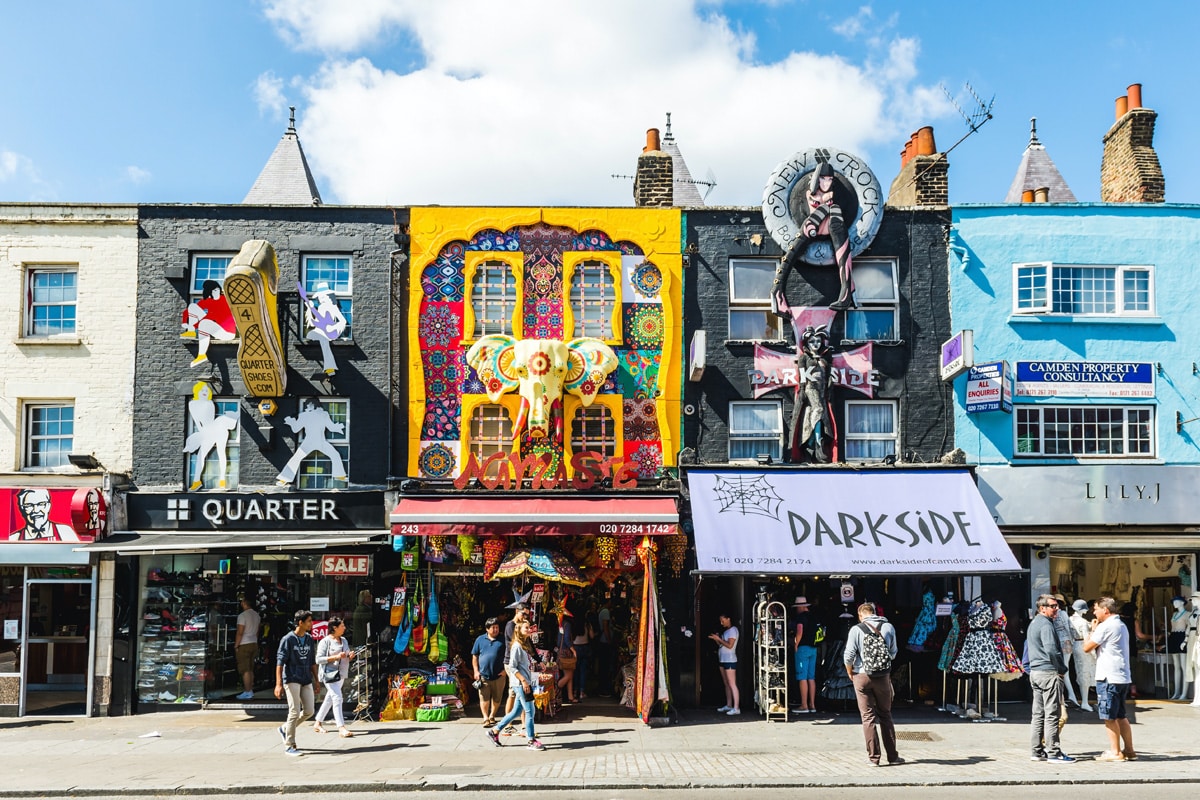
Camden is famous for its vibrant markets, music scene, and cultural attractions. Key areas include Camden Town (NW1), Hampstead (NW3), and Kentish Town (NW5). These areas are popular among young professionals and artists, offering a lively atmosphere and excellent transport links, including the Northern and Jubilee Lines.
Camden postcode districts include: NW1, NW3, NW5
Discover more about Camden buy-to-let.
Camden Property Prices
| Postcode | Average House Price £ | Average £ per sq ft | Average Rental Yield % |
|---|---|---|---|
| NW3 | £1,249,217 | £1,104 | 4.0% |
| NW1 | £867,794 | £1,016 | 4.5% |
| NW5 | £653,686 | £903 | 5.6% |
Camden Housing Market
| Postcode | Population | Density per square mile | Average Property Sales per Month |
|---|---|---|---|
| NW1 | 60,317 | 25,197 | 20 |
| NW3 | 51,574 | 20,358 | 27 |
| NW5 | 30,948 | 26,092 | 14 |

Enfield
Enfield offers more affordable housing options with a suburban feel. Key-areas include Enfield Town (EN1, EN2) and Edmonton (N9, N18). These areas are ideal for investors looking for higher rental yields and properties with growth potential. The borough benefits from overground rail services and proximity to the M25 motorway.
Enfield postcode districts include: EN1, EN2, EN3, N9, N13, N18, N21
Discover more about Enfield buy-to-let.
Enfield Property Prices
| Postcode | Average House Price £ | Average £ per sq ft | Average Rental Yield % |
|---|---|---|---|
| N21 | £709,650 | £581 | 3.5% |
| N13 | £583,699 | £542 | 3.5% |
| EN2 | £552,494 | £552 | 4.2% |
| EN1 | £487,024 | £511 | 4.5% |
| N17 | £461,603 | £557 | 5.6% |
| N18 | £398,891 | £454 | 5.6% |
| N9 | £384,739 | £461 | 5.0% |
| EN3 | £382,827 | £454 | 5.8% |
Enfield Housing Market
| Postcode | Population | Density per square mile | Average Property Sales per Month |
|---|---|---|---|
| N17 | 62,844 | 24,944 | 21 |
| EN3 | 55,687 | 12,739 | 26 |
| N9 | 51,422 | 16,456 | 11 |
| EN1 | 45,600 | 14,576 | 24 |
| N13 | 31,681 | 20,159 | 12 |
| N18 | 31,598 | 16,492 | 10 |
| EN2 | 29,591 | 3,667 | 14 |
| N21 | 23,535 | 10,194 | 11 |

Hackney
Hackney has transformed, into one of London's trendiest areas, known for its creative scene and nightlife. Key neighbourhoods include Shoreditch (E2), Clapton (E5), and Dalston (E8). With excellent transport links via the Overground and multiple bus routes, Hackney is popular among young professionals.
Hackney postcode districts include: E2, E5, E8, E9, N1, N16
Discover more about Hackney buy-to-let.
Hackney Property Prices
Hackney Housing Market
| Postcode | Population | Density per square mile | Average Property Sales per Month |
|---|---|---|---|
| N1 | 89,861 | 40,921 | 47 |
| N16 | 68,441 | 38,238 | 28 |
| E5 | 47,536 | 28,473 | 17 |
| E2 | 46,179 | 45,999 | 23 |
| E8 | 38,942 | 39,400 | 17 |
| E9 | 38,405 | 20,209 | 14 |
Haringey
Haringey offers a mix of urban and suburban living, with key areas like Finsbury Park (N4), Crouch End (N8), and Tottenham (N17). The area is well-connected via the Piccadilly and Victoria Lines, making it attractive for commuters. Haringey is undergoing regeneration, especially around Tottenham, offering interesting buy-to-let investment opportunities.
Haringey postcode districts include: N4, N6, N8, N15, N17, N22
Discover more about Haringey buy-to-let.
Haringey Property Prices
| Postcode | Average House Price £ | Average £ per sq ft | Average Rental Yield % |
|---|---|---|---|
| N6 | £827,319 | £903 | 3.4% |
| N4 | £641,153 | £803 | 4.3% |
| N8 | £588,186 | £754 | 4.3% |
| N22 | £536,830 | £634 | 4.2% |
| N15 | £511,689 | £625 | 4.4% |
| N17 | £461,603 | £557 | 5.6% |
Haringey Housing Market
| Postcode | Population | Density per square mile | Average Property Sales per Month |
|---|---|---|---|
| N17 | 62,844 | 24,944 | 21 |
| N4 | 46,376 | 32,948 | 25 |
| N15 | 44,449 | 34,557 | 12 |
| N22 | 42,995 | 22,152 | 12 |
| N8 | 39,660 | 27,629 | 23 |
| N6 | 19,402 | 9,631 | 11 |
Islington
Islington is a sought-after area with a lively social scene. Key areas include Angel (N1), Highbury (N5), and Holloway (N7). With excellent transport links via the Victoria and Piccadilly Lines, Islington appeals to professionals working in the City and West End.
Islington postcode districts include: EC1, N5, N7, N19
Islington Property Prices
| Postcode | Average House Price £ | Average £ per sq ft | Average Rental Yield % |
|---|---|---|---|
| EC1 | £783,057 | £1,070 | 4.9% |
| N5 | £669,661 | £923 | 4.5% |
| N19 | £585,197 | £796 | 4.9% |
| N7 | £579,418 | £773 | 5.2% |
Islington Housing Market
| Postcode | Population | Density per square mile | Average Property Sales per Month |
|---|---|---|---|
| N7 | 46,791 | 37,617 | 15 |
| N19 | 33,858 | 37,325 | 14 |
| EC1 | 32,679 | 33,836 | 18 |
| N5 | 24,716 | 37,237 | 15 |

Westminster
Westminster is at the heart of London, encompassing iconic areas like Pimlico (SW1), Mayfair (W1), and Paddington (W2). This borough is ideal for investors seeking high-end properties with strong capital growth. Transport links are exceptional, with numerous Underground lines and national rail services.
Westminster postcode districts include: SW1, W1, W2, W9, WC1, WC2
Westminster Property Prices
| Outcode | Average House Price £ | Average £ per sq ft | Average Rental Yield % |
|---|---|---|---|
| W1 | £2,131,417 | £1,777 | 2.5% |
| SW1 | £1,685,481 | £1,423 | 3.2% |
| WC2 | £1,482,907 | £1,610 | 3.2% |
| W2 | £1,079,833 | £1,257 | 4.7% |
| W9 | £850,161 | £991 | 3.7% |
| WC1 | £831,333 | £1,131 | 4.3% |
Westminster Housing Market
| Outcode | Population | Density per square mile | Average Property Sales per Month |
|---|---|---|---|
| SW1 | 52,638 | 22,222 | 28 |
| W2 | 47,620 | 24,645 | 25 |
| W9 | 37,728 | 51,355 | 23 |
| W1 | 31,832 | 18,497 | 19 |
| WC1 | 29,274 | 30,221 | 11 |
| WC2 | 7,297 | 11,691 | 7 |
The City of London
The City of London is the historic and financial heart of the capital. Key areas include Barbican (EC2) and Fleet Street (EC4). While primarily a business district, there are residential opportunities that offer unique investment prospects, especially for corporate rentals.
The City of London postcode districts include: EC2, EC3, EC4
The City of London Property Prices
| Outcode | Average House Price £ | Average £ per sq ft | Average Rental Yield % |
|---|---|---|---|
| EC2 | £1,245,750 | £1,377 | 3.3% |
| EC3 | £1,016,369 | £1,254 | N/A |
| EC4 | £726,379 | £1,096 | 4.6% |
The City of London Housing Market
| Outcode | Population | Density per square mile | Average Property Sales per Month |
|---|---|---|---|
| EC2 | 5,064 | 9,198 | 9 |
| EC4 | 1,221 | 3,924 | 3 |
| EC3 | 921 | 5,201 | 3 |
Conclusion
North London stands out as a compelling destination for buy-to-let investors. Whether you are seeking high rental yields in more affordable areas like Enfield or aiming for capital growth in affluent boroughs like Islington and Camden, North London has something to offer.
Landlords and investors shouldn't focus on simply one metric alone when considering the options around Greater London. They should instead consider all the regional and local housing market trends across boroughs, the differing transport links, and wide-ranging demographic factors when selecting a location.
With careful research and due diligence, North London can provide lucrative opportunities for property investment. If you look carefully you will also find some of the cheapest and most affordable postcodes across Greater London in this region.
To get a comprehensive view of London's buy-to-let market, be sure to explore our companion guides on East London, South London, and West London investment opportunities, which offer insights into the unique characteristics and potential of each region
