Bath is a city in Somerset, in south-west England. Average sold prices across Bath and North East Somerset sit at £405,568 on the HM Land Registry House Price Index, 39.9% above the England average of £289,946 and one of the higher local-authority prices in the South West. Over the five years to March 2026 prices rose 15.0%, from £352,792 to £405,568. The local authority's population grew 9.9% between the 2011 and 2021 censuses, from 176,016 to 193,409 residents.
Bath is a capital-value market before it is an income one. The same heritage premium that puts prices well above England also pushes gross rental yields down into a 3.5% to 4.4% band, lower than almost anywhere in the North or the Midlands. The spread runs from BA3 (Radstock, Midsomer Norton) at a £396,927 asking price up to BS40 (Chew Magna, Chew Stoke) at £610,832, a 53.9% gap that separates the former Somerset coalfield towns from the prime Chew Valley villages. For an investor, Bath is where the return comes mostly from the value of the asset rather than the monthly rent.
This guide covers the unitary authority of Bath and North East Somerset (ONS code E06000022) across postcodes BA1, BA2, BA3, BS31, BS39, and BS40. Bath sits in the South West, 11 minutes by rail from Bristol and around 90 minutes from London Paddington. The wider area runs out to Keynsham and Saltford in the north, the Chew Valley to the west, and the old coalfield towns of Radstock and Midsomer Norton to the south. Neighbouring markets include Bristol buy-to-let and the rest of Somerset.
Article updated: July 2026
Why Invest in Bath?
Bath is one of only two complete cities in the world inscribed as a UNESCO World Heritage Site, a designation held since 1987 that has underpinned its property premium for decades. Across Bath and North East Somerset, the population grew 9.9% between the 2011 and 2021 censuses, from 176,016 to 193,409 residents. That outpaced the England and Wales average of 6.3% and reflects both the city's pull on relocating professionals and the steady expansion of surrounding towns like Keynsham and Midsomer Norton.
Two universities anchor the rental market. The University of Bath sits in BA2 (City Centre South, Oldfield Park, Combe Down) and Bath Spa University to the west of the city, and between them they bring a student population that keeps demand firm in the cheaper city-centre stock year-round. The Royal United Hospitals Bath NHS Foundation Trust is the largest single employer, serving a catchment of over half a million people, so a large slice of local housing demand is tied to healthcare jobs that do not move with the economic cycle.
Median gross annual earnings across Bath and North East Somerset are £41,096, which is 7.7% above the South West regional median of £38,168 and 3.1% above the Great Britain median of £39,863. Higher local wages are part of why the premium holds. The other part is supply: a World Heritage City cannot build its way out of demand the way a newer city can, so prices that local wages alone would not support are sustained by buyers moving in from Bristol, London and the wider South East. Bath Spa station is 11 minutes from Bristol Temple Meads, which widens the tenant pool well beyond people who work in Bath itself.
Bath Economic Summary
- Population (Bath and North East Somerset): 193,409 (2021 Census). Growth of 9.9% from 2011.
- Median annual salary: £41,096 (local), £38,168 (South West), £39,863 (Great Britain)
- Employment rate: 76.3% (local)
- Unemployment rate: 3.6% (local)
- Key employment sectors: Higher education, healthcare, tourism and hospitality, professional and technical services, retail
Source: ONS Census 2021, Nomis Labour Market Profile (ASHE 2025, Employment Oct 2024-Sep 2025)
Regeneration and Investment in Bath
Bath has more than 1,360 new homes in its current pipeline, concentrated along the Western Riverside corridor where former industrial land is being turned over to housing at a scale the city has not seen in decades. In a World Heritage City where new supply is tightly constrained, these brownfield sites are most of what new building looks like.
- One Waterside, Bath Western Riverside (Under construction, 662 homes): Berkeley Homes is delivering 662 low-carbon homes on a 12.4-acre former gasworks site, the largest residential development in central Bath. The first apartments are expected from late 2027, with a new riverside park and public river walk included. Updates at Berkeley Group.
- Bath Press, Lower Bristol Road (Under construction, 250 homes): Heritage developer City and Country is transforming the 5.3-acre former Pitman Press site into 250 homes, retaining the original facade. Backed by £32.5 million in finance from Paragon Bank, the first phase includes 134 apartments and 12 houses, with completion expected from winter 2026. Updates at Paragon Banking Group.
- Pines Way, Bath Western Riverside (Planning approved, 454 homes): HUB and Bridges Fund Management received planning consent in May 2025 for 275 build-to-rent homes and 179 co-living units on the former Homebase site. The 4.5-acre brownfield scheme targets zero-carbon operation and completes the western riverside regeneration corridor. Updates at HUB Living.
Source: Office for National Statistics - Population for Bath and North East Somerset

Bath Property Market Analysis
Average property prices in Bath and North East Somerset have risen 535.8% since January 1995, from £63,789 to £405,568. The sections below break that journey down cycle by cycle, then drill into current postcode-level data for sold prices, price per square foot, asking prices, growth trends, and monthly transaction volumes.
When was the last house price crash in Bath?
Bath sits within the unitary authority of Bath and North East Somerset, so all sold prices from HM Land Registry are recorded at that level, taking in Keynsham, Midsomer Norton and the Chew Valley as well as the city itself. The index runs from January 1995 to March 2026, covering 31 years of market cycles.
The 1995 to 2007 boom: Bath and North East Somerset started at £63,789 in January 1995. By December 2000 the average had reached £117,285, up 83.9% in six years as Georgian stock drew buyers priced out of London. The run accelerated through the early 2000s, passing £208,787 by December 2005, and the market peaked at £244,257 in September 2007.
2008 to 2009, the financial crisis: Prices fell from the September 2007 peak of £244,257 to a trough of £197,021 in May 2009, a decline of 19.3% over 20 months. The worst year-on-year reading was -16.1% in February 2009. That correction was in line with the South West and slightly deeper than England's 18.2% fall, because a high-priced heritage market had further to drop when credit dried up.
Recovery, 2009 to 2013: Bath came back faster than much of the country. From the May 2009 trough the market climbed steadily, and by May 2013 the average reached £245,103, the first time prices passed the September 2007 peak. That recovery took about five and a half years from peak to peak. Constrained heritage supply and demand from Bristol and London commuters pulled Bath back ahead of the national timeline.
The 2014 to 2019 expansion: Growth ran hot through the mid-2010s. Prices rose from £269,602 in December 2014 to £300,818 by April 2016 and £326,468 by December 2018, with annual readings touching 15.4% in early 2016. The market then cooled into 2019, ending the year at £321,040 with annual growth of -1.7% as stamp duty surcharges and Brexit uncertainty weighed on the top of the market.
2020 to 2022, the pandemic surge: The stamp duty holiday and the shift to remote working repriced Bath sharply upward. From £333,214 in June 2020 the average ran to £378,445 by December 2021 (8.3% annual) and £410,065 by December 2022 (8.4% annual). Georgian architecture, green space and a fast line to London made Bath a prime beneficiary of the relocation wave.
The 2023 rate shock: Higher mortgage rates cooled demand. Prices eased to £404,473 by June 2023 and £403,418 by December 2023, a -1.6% annual reading. The correction was mild by historical standards, far shallower than 2008.
2024 to present: Prices recovered to an all-time high of £423,566 in October 2024, then eased back to £405,568 by the latest reading in March 2026, down 4.2% from that high. The current price is 66.0% above the pre-crash peak of £244,257, and Bath is now trading a little below its 2024 top rather than pushing on from it.
Long-term growth summary:
- 5 years (March 2021 to March 2026): 15.0% growth (£352,792 to £405,568)
- 10 years (March 2016 to March 2026): 32.5% growth (£306,160 to £405,568)
- 15 years (March 2011 to March 2026): 78.9% growth (£226,716 to £405,568)
- 20 years (March 2006 to March 2026): 100.8% growth (£201,927 to £405,568)
- 30 years (January 1995 to March 2026): 535.8% growth (£63,789 to £405,568)
Bath's 19.3% crash was slightly deeper than England's, but the 30-year return of 535.8% is among the stronger long-run records of any South West local authority. An investor who bought at the exact peak in September 2007 would now be 66.0% ahead on the Land Registry average. The recent story is the easing from the October 2024 high rather than fresh growth, with prices down 4.2% from that point.
- All property types
- Detached
- Semi-detached
- Terraced
- Flats
- All property types
- Detached
- Semi-detached
- Terraced
- Flats
Sold House Prices in Bath
The average sold price across all property types in Bath and North East Somerset is £405,568, which is 39.9% above the England average of £289,946 as of March 2026. Every property type carries a premium to England, but the premium is heaviest at the cheaper end. Terraced houses sit 58.3% above the England terraced average, while flats are only 11.4% above. The pattern tells you Bath's value is built into its everyday housing, not just its grand detached homes.
| Property Type | Bath and North East Somerset Average | England Average | Difference |
|---|---|---|---|
| Detached houses | £705,371 | £470,492 | +49.9% |
| Semi-detached houses | £441,488 | £288,185 | +53.2% |
| Terraced houses | £385,834 | £243,788 | +58.3% |
| Flats and maisonettes | £239,054 | £214,563 | +11.4% |
| All property types | £405,568 | £289,946 | +39.9% |
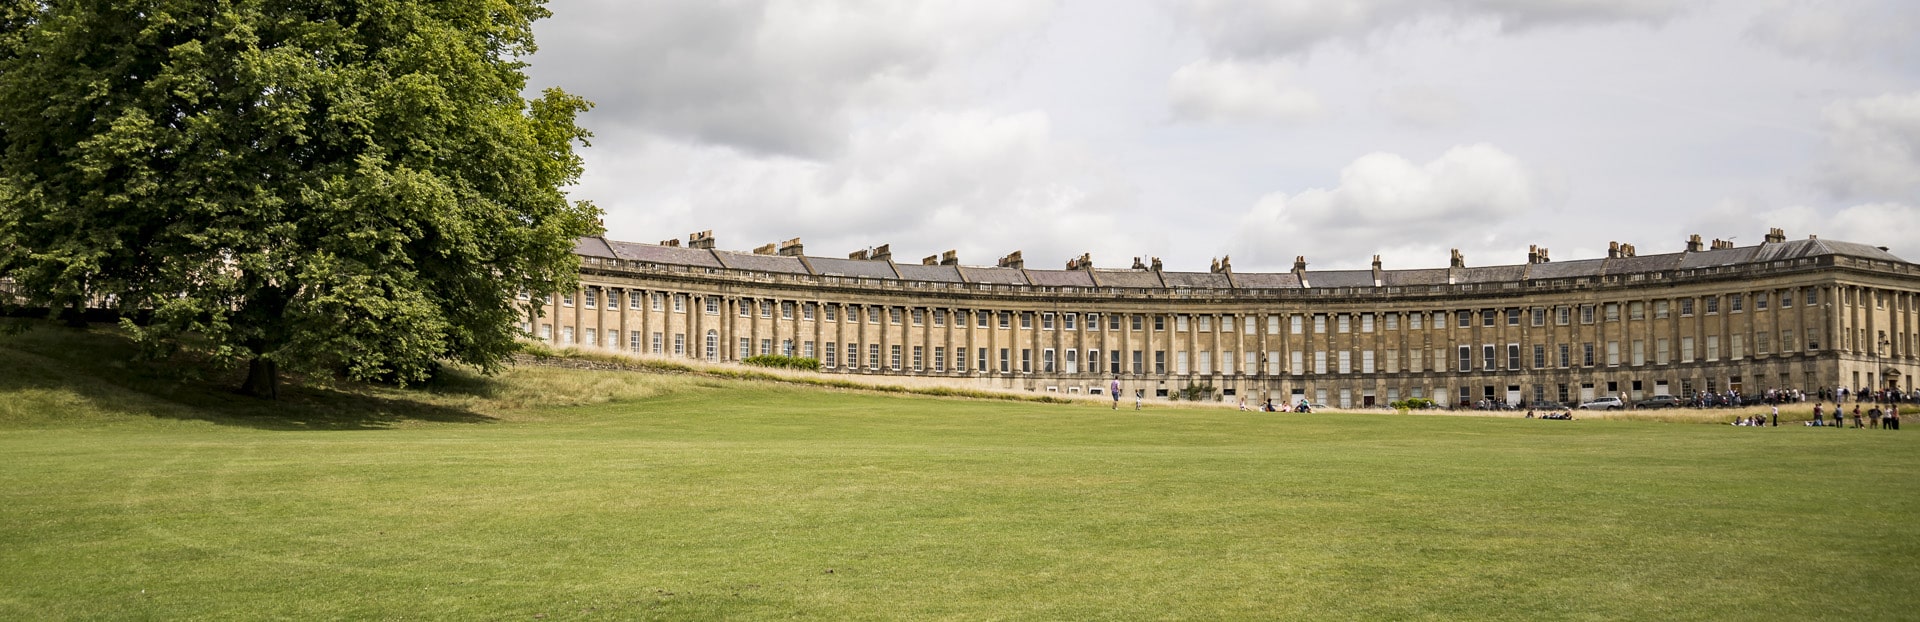
Detached houses at £705,371 carry a 49.9% premium over England's £470,492. This is the Bath of the Royal Crescent, the Georgian terraces of the city's set pieces and the larger family homes in BS40 and the Chew Valley. Annual change of -1.0% shows the top of the market drifting slightly off its 2024 high rather than falling away.
Semi-detached houses at £441,488 sit 53.2% above England's £288,185, the widest premium of any house type here. Semis form much of the suburban stock in BA1 (City Centre North, Weston, Larkhall) and BA2, and their figure has held flat over the year at +0.1% annual change while the rest of the market eased.
Terraced houses at £385,834 show the heaviest premium of all at 58.3% above England's £243,788. Bath's terraces are not the low-cost workhorse stock they are in most cities; here they are the period townhouses and artisan cottages that define whole streets, and they command prices that would buy a detached house elsewhere. Annual change was -0.2%.
Flats and maisonettes at £239,054 carry the smallest premium at 11.4% above England's £214,563, and they are the only stock that comes close to the national level. The smaller apartment market reflects city-centre conversions and the student-facing stock around the universities. Annual change of -4.7% is the steepest fall of any type, so flats have softened most as the market has cooled from its high.
Price Per Square Foot in Bath
£136 per square foot separates Bath's cheapest postcode from its most expensive, with BA3 at £327 and BA1 at £463. Price per square foot strips out the effect of property size and gives a cleaner read on location value. BA1 (City Centre North, Weston, Larkhall) commands the highest rate, reflecting the prime Georgian streets and the pull of the city-centre setting.
| Rank | Area | Price Per Sq Ft |
|---|---|---|
| 1 | BA3 (Radstock, Midsomer Norton) | £327 |
| 2 | BS39 (Paulton, Clutton) | £347 |
| 3 | BS31 (Keynsham, Saltford) | £393 |
| 4 | BS40 (Chew Magna, Chew Stoke) | £393 |
| 5 | BA2 (City Centre South, Oldfield Park) | £426 |
| 6 | BA1 (City Centre North, Weston, Larkhall) | £463 |
BA3 at £327 per square foot is the cheapest bricks-and-mortar value in the area. Radstock and Midsomer Norton are the former Somerset coalfield towns south of the city, where prices have always sat below the Bath premium. Based on 663 transactions analysed, BA3's rate is 29% below BA1's.
BA1 at £463 per square foot tops the table. When buyers pay this much per square foot they are paying for the heart of the World Heritage City: the Georgian terraces, the walkable centre and the streets that carry Bath's name. All 739 transactions analysed show a consistent premium over the rest of the area.
For Sale Asking Prices in Bath
BA3 at £396,927 and BS40 at £610,832 sit 53.9% apart, the widest asking-price gap across Bath's six postcodes. That hierarchy roughly tracks price per square foot, but the very top is the rural Chew Valley rather than the city centre. The mean asking price across all six Bath postcodes is £478,576.
| Rank | Area | Asking Price |
|---|---|---|
| 1 | BA3 (Radstock, Midsomer Norton) | £396,927 |
| 2 | BS39 (Paulton, Clutton) | £417,534 |
| 3 | BS31 (Keynsham, Saltford) | £437,853 |
| 4 | BA2 (City Centre South, Oldfield Park) | £501,544 |
| 5 | BA1 (City Centre North, Weston, Larkhall) | £506,766 |
| 6 | BS40 (Chew Magna, Chew Stoke) | £610,832 |
BA3 at £396,927 is the lowest entry point and the only postcode below the area-wide Land Registry average of £405,568. Radstock and Midsomer Norton sit far enough south of Bath to break the price premium, which is why a fixed budget stretches furthest here. The step up from BA3 to the next postcode, BS39, is £20,607.
BS40 at £610,832 is the outlier, 22.4% above the next postcode and 53.9% above BA3. The Chew Valley villages of Chew Magna and Chew Stoke are rural, low-density and dominated by large detached homes, so this is the most expensive ground in the area despite being well outside the city. The yield data below shows what that price does to the income return.

House Price Growth in Bath
BS31 (Keynsham, Saltford) leads on five-year growth at 19.2%, and is one of three Bath postcodes that grew across all three timeframes alongside BA1 and BS39. All six postcodes delivered positive five-year returns, but the medium-term picture splits the area. BS40 (Chew Magna, Chew Stoke) sits at the other end with a -5.3% three-year reading despite an 11.4% five-year return.
| Area | 1 Year | 3 Years | 5 Years |
|---|---|---|---|
| BS31 (Keynsham, Saltford) | 6.8% | 4.2% | 19.2% |
| BA3 (Radstock, Midsomer Norton) | 1.5% | -1.8% | 16.5% |
| BS39 (Paulton, Clutton) | 2.8% | 3.8% | 15.1% |
| BS40 (Chew Magna, Chew Stoke) | 5.1% | -5.3% | 11.4% |
| BA1 (City Centre North, Weston, Larkhall) | 2.5% | 3.3% | 10.8% |
| BA2 (City Centre South, Oldfield Park) | -0.2% | -1.8% | 7.2% |
BS31 at 19.2% has the highest five-year return in the area, and reads positive across one, three and five years along with BA1 and BS39. Keynsham and Saltford sit between Bath and Bristol with fast links to both, and that commuter position has pulled in steady demand from buyers working in either city.
BS40 now reads +5.1% over one year but -5.3% over three, the weakest medium-term figure here. The Chew Valley's small, high-value rural market moves in larger jumps on thinner volumes, so a recent rebound sits on top of an earlier dip. The five-year return of 11.4% is still positive.
BA2's -0.2% one-year reading is the softest in Bath. The city-centre south and student-facing stock around Oldfield Park saw the flattest recent year, though the five-year return of 7.2% remains positive.
Monthly Property Sales in Bath
Exit liquidity varies sharply across Bath, with monthly sales running from 10 transactions in BS40 to 55 in BA2. The city postcodes turn over far more stock than the rural ones. Turnover rates sit in a tight 7% to 15% band, with BS31 the most liquid and BS40 the least.
| Area | Sales Per Month | Turnover | Asking Price |
|---|---|---|---|
| BA2 (City Centre South, Oldfield Park) | 55 | 11% | £501,544 |
| BA1 (City Centre North, Weston, Larkhall) | 40 | 10% | £506,766 |
| BA3 (Radstock, Midsomer Norton) | 33 | 10% | £396,927 |
| BS31 (Keynsham, Saltford) | 23 | 15% | £437,853 |
| BS39 (Paulton, Clutton) | 15 | 11% | £417,534 |
| BS40 (Chew Magna, Chew Stoke) | 10 | 7% | £610,832 |
BA2 records the most transactions at 55 a month, with BA1 next at 40. The two city postcodes hold the largest, most varied housing stock, so they generate the deepest pool of sales and the easiest route to a buyer when you come to sell. BS31 shows the highest turnover at 15%, meaning a larger share of its homes change hands each year even though its absolute volume is lower.
BS40 sits at the bottom on both counts, 10 sales a month and 7% turnover. The Chew Valley's small rural stock simply does not come to market often, so an investor buying there should expect a thinner exit, fewer comparable sales and a longer wait for the right buyer.
How Long Properties Take to Sell in Bath
Selling speed runs from about 203 days in BS31 (Keynsham, Saltford) to roughly 435 days in BS40 (Chew Magna, Chew Stoke). Days on market is the typical number of days a home is up for sale before it sells; the months of unsold stock shows how much for-sale supply is sitting there at the current rate of sales.
| Area | Avg Days to Sell | Months of Unsold Stock | Market |
|---|---|---|---|
| BS31 (Keynsham, Saltford) | 203 | 6.7 | Balanced market |
| BA2 (City Centre South, Oldfield Park) | 277 | 9.1 | Balanced market |
| BS39 (Paulton, Clutton) | 277 | 9.1 | Balanced market |
| BA1 (City Centre North, Weston, Larkhall) | 304 | 10.0 | Balanced market |
| BA3 (Radstock, Midsomer Norton) | 304 | 10.0 | Balanced market |
| BS40 (Chew Magna, Chew Stoke) | 435 | 14.3 | Buyer's market |
The number that rarely reaches the spreadsheet is how long a sale takes, and across Bath and North East Somerset it swings sharply by postcode. BS31's 6.7 months of unsold stock means a home there finds a buyer roughly twice as fast as one in BS40, where 14.3 months of supply makes it the only postcode currently weighted towards buyers. A high-value rural home that takes well over a year to sell is a real holding cost if your plans change, and it is the trade-off that comes with BS40's price tag.
What Type of Property Can You Buy in Bath?
Detached homes are the largest single category in every Bath postcode, from 38.2% of stock in BS31 to 65.9% in BS40, while terraced houses and flats are most concentrated in the city postcodes. The mix of housing stock shapes which strategies fit each area. The figures below are drawn from 2021 Census records for each postcode.
| Area | Detached | Semi-detached | Terraced | Flats |
|---|---|---|---|---|
| BA1 (City Centre North, Weston) | 52.4% | 23.4% | 12.8% | 11.1% |
| BA2 (City Centre South, Oldfield Park) | 48.0% | 26.7% | 17.4% | 6.8% |
| BA3 (Radstock, Midsomer Norton) | 45.1% | 30.6% | 19.3% | 4.8% |
| BS31 (Keynsham, Saltford) | 38.2% | 34.2% | 16.0% | 10.1% |
| BS39 (Paulton, Clutton) | 56.1% | 27.8% | 11.7% | 4.1% |
| BS40 (Chew Magna, Chew Stoke) | 65.9% | 24.0% | 5.7% | 3.2% |
BA1 holds the largest share of flats at 11.1%, just ahead of BS31 at 10.1%. Those are the smaller units that usually carry the buy-to-let market, and in BA1 they sit alongside the highest terraced concentration of the city postcodes. The flats around the centre and the universities suit single lets and student sharers, while the terraces are the period townhouses that let to professional households.
BS40 is the most detached-dominated postcode at 65.9%, with the smallest flat share at 3.2%. Detached and semi-detached houses together make up close to 90% of the Chew Valley's stock, which matches its top asking price and its position as family-home and owner-occupier territory rather than a rental market.
Flats combine purpose-built, converted and commercial units. A small share of mobile and temporary dwellings is not shown, so rows may not total 100%.

Bath Rental Market Analysis
Monthly rents across Bath's measured postcodes range from £1,313 in BS31 to £1,830 in BA2, with gross rental yields from 3.5% to 4.4%. For investors asking is buy-to-let worth it in Bath, the sections below break down rents, yields and tenant affordability postcode by postcode. The yield band sits low because prices are high; if you are looking at how do I build a property portfolio, Bath rewards the patient capital-growth investor more than the cash-flow one. Browse current buy-to-let property for sale across the region.
Average Rent & Gross Rental Yields in Bath
Gross rental yields in Bath range from 3.5% in BS40 to 4.4% in BA2. BA2 (City Centre South, Oldfield Park) tops the table because its strong student and professional rents land on an asking price that is not the highest in the area. BS40 sits last despite the highest rent at £1,760, because its £610,832 asking price is the steepest in Bath. Rent and yield figures are available for the four postcodes with enough rental-listing volume to read; BA3 and BS39 carry too few rental listings to publish a reliable figure.
| Area | Average Monthly Rent | Asking Price | Gross Yield |
|---|---|---|---|
| BA2 (City Centre South, Oldfield Park) | £1,830 | £501,544 | 4.4% |
| BA1 (City Centre North, Weston, Larkhall) | £1,663 | £506,766 | 3.9% |
| BS31 (Keynsham, Saltford) | £1,313 | £437,853 | 3.6% |
| BS40 (Chew Magna, Chew Stoke) | £1,760 | £610,832 | 3.5% |
| BA3 (Radstock, Midsomer Norton) | Not enough data | £396,927 | Not enough data |
| BS39 (Paulton, Clutton) | Not enough data | £417,534 | Not enough data |
BA2 at 4.4% is the top yield in Bath. The combination of two universities, the Oldfield Park student belt and a £1,830 average rent lifts the income return above the rest, even on a £501,544 asking price. A 30% deposit there is £150,463, so the highest-yielding postcode still demands a substantial entry.
BS40 at 3.5% sits at the bottom. The £1,760 rent is the second-highest in the area, but a £610,832 asking price compresses the return. In the Chew Valley the premium price does far more for the capital value of the home than for its monthly income.
Gross Rental Yield by Postcode
Is Bath Rent High?
Monthly rents in Bath take between 38.3% and 53.4% of the local median gross salary, well above the level seen in most of the country. The widely cited threshold for rent affordability is 30% of gross income, and every measured Bath postcode sits above it. That gap is a direct read on a high-cost market: rents are high in absolute terms even though yields are low, because prices are higher still.
The median gross weekly salary across Bath and North East Somerset is £790.30, which equates to £3,425 per month or £41,096 per year. This is above the South West regional median of £734.00 per week and the Great Britain median of £766.60 per week. Data from the Nomis Labour Market Profile (ASHE 2025).
| Rank | Area | Rent as % of Income |
|---|---|---|
| 1 | BA2 (City Centre South, Oldfield Park) | 53.4% |
| 2 | BS40 (Chew Magna, Chew Stoke) | 51.4% |
| 3 | BA1 (City Centre North, Weston, Larkhall) | 48.5% |
| 4 | BS31 (Keynsham, Saltford) | 38.3% |
| — | BA3 (Radstock, Midsomer Norton) | Not enough data |
| — | BS39 (Paulton, Clutton) | Not enough data |
BS31 at 38.3% is the most affordable of the measured postcodes for tenants, and the only one that comes close to a sustainable share of a single median salary. Keynsham and Saltford draw commuters who often work in Bath or Bristol and may earn above the area median, which is part of why rents there still get paid.
BA2 at 53.4% is the least affordable on a single median salary, but context matters. Much of BA2's rental demand comes from students sharing a house and from dual-income professional households, so the rent is spread across more than one earner rather than carried by a single median wage.
How Big Is Bath's Private Rented Sector?
The private rented sector runs from 8.7% of households in BS31 up to 17.9% in BA2, with the city and student-facing postcodes holding the deepest rental markets. The share of homes already rented privately is a guide to the size of the established tenant pool and the local lettings market. The table below shows household tenure by postcode.
| Area | Owned Outright | Owned with Mortgage | Private Rented | Social Rented |
|---|---|---|---|---|
| BA2 (City Centre South, Oldfield Park) | 44.5% | 29.8% | 17.9% | 6.9% |
| BS40 (Chew Magna, Chew Stoke) | 45.2% | 32.2% | 17.4% | 4.6% |
| BA3 (Radstock, Midsomer Norton) | 40.6% | 32.6% | 16.5% | 9.5% |
| BA1 (City Centre North, Weston) | 49.1% | 30.9% | 15.4% | 4.2% |
| BS39 (Paulton, Clutton) | 49.9% | 33.2% | 10.4% | 5.9% |
| BS31 (Keynsham, Saltford) | 45.7% | 34.9% | 8.7% | 9.4% |
BA2 has the deepest private rented sector at 17.9%, driven by the student belt around Oldfield Park and the University of Bath. A larger rented sector points to an active lettings market and a wider pool of existing tenants, which sits behind BA2 also carrying the area's top yield at 4.4%. BS31 holds the smallest rented sector at 8.7%, with the highest mortgaged-ownership share at 34.9%, so Keynsham and Saltford are first and foremost owner-occupier commuter towns.
Among the city postcodes, BA1 and BA2 both have enough homes advertised to rent to read the lettings market with confidence, and in both the balance currently sits with landlords rather than tenants. In BA1 around 93 homes were on the rental market and let in about 45 days on average; in BA2 around 179 were listed and let in about 58 days. Both point to firm demand against a limited supply of rental homes.
Local Housing Allowance Rates in Bath
Bath's six postcodes are split across three Broad Rental Market Areas, so Local Housing Allowance is not a single set of rates here. BA1, BA2, BA3 and BS39 fall in the Bath BRMA, BS31 in the Bristol BRMA and BS40 in the Weston-super-Mare BRMA. Local Housing Allowance sets the maximum housing support a tenant on benefits can receive, so it acts as a rent floor for landlords letting to that part of the market. The table below shows the June 2026 weekly rates for each area.
| Property Size | Bath BRMA (BA1, BA2, BA3, BS39) | Bristol BRMA (BS31) | Weston-super-Mare BRMA (BS40) |
|---|---|---|---|
| Shared accommodation | £124.27 | £117.68 | £103.87 |
| 1 bedroom | £187.56 | £207.12 | £133.48 |
| 2 bedrooms | £225.53 | £252.00 | £172.60 |
| 3 bedrooms | £276.16 | £299.18 | £212.88 |
| 4 bedrooms | £447.62 | £425.75 | £287.67 |
The three rate sets matter because the same property size is worth a different amount of benefit-backed rent depending on which postcode it sits in. A two-bedroom home draws £252.00 a week in BS31 under the Bristol rates, £225.53 in the Bath postcodes and £172.60 out in BS40. All of those sit well below Bath's open-market rents of £1,313 to £1,830 a month, so a benefit-backed tenancy comes in under the open market across the board, and the gap is widest in the high-value postcodes. To check the current rate for a specific address, you can use the government's official Local Housing Allowance calculator.
Buy-to-Let Considerations
Are House Prices High in Bath? Price-to-Earnings Ratios
Buying a property in Bath takes between 9.7 and 14.9 times the median annual salary, and every postcode sits above the national benchmark. This is based on the Nomis Labour Market Profile for Bath showing the median gross annual income for local residents is £41,096.
The national benchmark for price-to-earnings is 7.3x (England's average sold price of £289,946 divided by the Great Britain median annual salary of £39,863). None of Bath's six postcodes comes close to that line. Even the cheapest, BA3 at 9.7x, is well above the national figure, which is the clearest single measure of how stretched prices are against local wages across the whole area.
| Rank | Area | Price-to-Earnings Ratio |
|---|---|---|
| 1 | BA3 (Radstock, Midsomer Norton) | 9.7x |
| 2 | BS39 (Paulton, Clutton) | 10.2x |
| 3 | BS31 (Keynsham, Saltford) | 10.7x |
| 4 | BA2 (City Centre South, Oldfield Park) | 12.2x |
| 5 | BA1 (City Centre North, Weston, Larkhall) | 12.3x |
| 6 | BS40 (Chew Magna, Chew Stoke) | 14.9x |
BA3 at 9.7x is the most affordable entry in Bath relative to local earnings, but it still sits a third above the national 7.3x benchmark. The former coalfield towns of Radstock and Midsomer Norton are where local wages stretch furthest, which is part of why they hold the area's lowest prices.
BS40 at 14.9x is more than twice the national benchmark and the most stretched ratio in the area. At nearly fifteen times the local median salary, the Chew Valley is bought by high earners and equity-rich movers rather than first-time investors. For a landlord, a ratio that high goes hand in hand with the area's lowest yield at 3.5%.
Deposit Requirements in Bath
A 30% deposit on a buy-to-let property in Bath runs from £119,078 in BA3 to £183,250 in BS40. The gap between the cheapest and most expensive deposit is £64,172. These are large numbers by national standards, a direct consequence of a market where the lowest-priced postcode still asks close to £400,000. For investors comparing Bath with other South West locations, the entry cost sits above Bristol's cheaper postcodes and well above the Somerset coast.
Beyond the deposit, the stamp duty calculator buy to let and other buy to let costs affect the total capital required.
| Rank | Area | 30% Deposit Required |
|---|---|---|
| 1 | BA3 (Radstock, Midsomer Norton) | £119,078 |
| 2 | BS39 (Paulton, Clutton) | £125,260 |
| 3 | BS31 (Keynsham, Saltford) | £131,356 |
| 4 | BA2 (City Centre South, Oldfield Park) | £150,463 |
| 5 | BA1 (City Centre North, Weston, Larkhall) | £152,030 |
| 6 | BS40 (Chew Magna, Chew Stoke) | £183,250 |
BA3 is the cheapest way into the area at a £119,078 deposit, and it pairs that with the most affordable price-to-earnings ratio and a respectable 16.5% five-year growth figure. The trade-off is that Radstock and Midsomer Norton sit outside the city and outside the Bath BA1 and BA2 rental markets, so the tenant pool is more local and the rental data thinner.
BS31 and BA2 frame the choice most investors actually face. The deposit gap between them is £19,107, and that money buys two different propositions. BS31 (Keynsham, Saltford) has delivered the strongest five-year growth in the area at 19.2% and the most affordable rents against income, while BA2 (City Centre South, Oldfield Park) brings the top yield at 4.4% and the deepest rental sector through its student and professional demand. Growth-led commuter town against income-led student city, for roughly £19,000 of deposit difference.

What the Bath Data Tells Buy-to-Let Investors
In Bath the return is built into the value of the asset rather than the rent. Sold prices average £405,568, which is 39.9% above England, while gross yields top out at 4.4% in BA2 and bottom out at 3.5% in BS40. No postcode here is a high-cash-flow play. What Bath has delivered instead is long-run capital growth: 535.8% over 30 years and 15.0% over the most recent five, on the back of a heritage premium that has survived every cycle since 1995. For investment properties in UK in Bath, the case rests on the value of the home over time, not the monthly income.
BS31 (Keynsham, Saltford) has the strongest five-year growth in the area at 19.2%, and grew across one, three and five years (6.8%, 4.2% and 19.2%) along with BA1 and BS39. It also carries the most affordable rents against local income at 38.3%. The yield is modest at 3.6% and the deposit is £131,356, so BS31 reads as the area's growth-and-stability postcode rather than an income one. BA2 (City Centre South, Oldfield Park) is the income counterpoint, with the top yield at 4.4% and the deepest rental sector at 17.9%, fed by two universities.
BS40 (Chew Magna, Chew Stoke) is the prime outlier, the most expensive ground in the area at £610,832 with the lowest yield at 3.5% and the slowest exit at around 435 days to sell. BA3 (Radstock, Midsomer Norton) is the affordable end, the cheapest entry at a £119,078 deposit and the only postcode below the area average sold price. Investors who want to buy below asking in a high-value market often look through off-market properties and below market value channels.
Bath has no selective licensing for private landlords, though HMO landlords should still check the council's property licensing pages. With a World Heritage premium, two universities, a major NHS trust and fast links to Bristol and London, it reads as a low-yield, high-value market with unusually durable demand underneath it: the income return is thin, but the asset has held and grown its value through every cycle on record.
How Bath Compares
Bath's mean asking price of £478,576 is the highest of five South West and nearby locations compared here, and its top yield of 4.4% is the lowest in the table. The comparison below places Bath alongside four nearby markets, each with a different investor profile. The mean asking price and mean monthly rent are simple averages across all postcodes with data. Top gross yield is the single highest postcode yield in each location.
| Location | Mean Asking Price | Mean Monthly Rent | Mean Gross Yield | Top Yield (postcode) |
|---|---|---|---|---|
| Stoke-on-Trent | £245,606 | £859 | 4.2% | 6.9% (ST1) |
| Bristol | £373,692 | £1,655 | 5.3% | 6.9% (BS7) |
| Somerset | £387,446 | £1,124 | 3.5% | 5.4% (TA6) |
| Warrington | £307,783 | £1,001 | 3.9% | 4.8% (WA1, WA5) |
| Bath | £478,576 | £1,642 | 4.1% | 4.4% (BA2) |
Bath is the most expensive location in this comparison at £478,576 mean asking price, and its top yield of 4.4% is the lowest in the table. That is the heritage-city pattern in one line: the highest entry cost paired with the thinnest income return, on the back of demand that prices everyday homes well above the national average.
For investors prioritising income, Stoke-on-Trent and Bristol both reach 6.9% at the top of their yield tables, with Stoke much the cheaper entry at a £245,606 mean against Bath's £478,576. The rest of Somerset at 5.4% sits a full point above Bath on yield at a lower price point, so it offers a cheaper South West entry without the heritage premium, while Warrington at 4.8% is the closest match to Bath's income profile. For investors who specifically want a World Heritage City with durable capital growth and a wealthy tenant base, Bath stands apart on price and prestige rather than income. For a data-driven comparison across the whole country, see our best buy-to-let areas guide.
Frequently Asked Questions
How do property prices, yields and growth compare in Bath?
Bath is a capital-value market, not a cash-flow one. Sold prices average £405,568, about 39.9% above the England average, and gross yields run between 3.5% and 4.4%, which is low by national standards. What Bath has delivered is long-run growth: 535.8% over 30 years and 15.0% over the last five.
So if you are after monthly income, the numbers here are thin, and most of the North and Midlands will out-yield Bath comfortably. If you are after a heritage-city asset that has held and grown its value through every cycle since 1995, with two universities and a major NHS trust underpinning demand, that is the case Bath makes.
What are the best areas in Bath for property investment?
The six postcodes split fairly cleanly by what they are good at. For income, BA2 (City Centre South, Oldfield Park) leads on yield at 4.4% and has the deepest rental sector at 17.9%, fed by the University of Bath and the student belt. For growth, BS31 (Keynsham, Saltford) leads on the five-year figure at 19.2% and grew across one, three and five years (6.8%, 4.2% and 19.2%) alongside BA1 and BS39, with the most affordable rents against income.
At the other end, BS40 (Chew Magna, Chew Stoke) is the prime rural spot, the most expensive at £610,832 and the lowest-yielding at 3.5%, while BA3 (Radstock, Midsomer Norton) is the cheapest entry at a £119,078 deposit. So income points you at BA2, growth at BS31, and budget at BA3.
What are average house prices in Bath?
The average sold price across Bath and North East Somerset is £405,568 on the Land Registry index, about 39.9% above the England average of £289,946 as of March 2026. Asking prices by postcode run from £396,927 in BA3 (Radstock, Midsomer Norton) up to £610,832 in BS40 (Chew Magna, Chew Stoke), with an area-wide mean of £478,576. By type, detached homes average £705,371, semi-detached £441,488, terraced £385,834 and flats £239,054.
Worth noting how heavy the premium is on everyday stock: Bath's terraced houses sit 58.3% above the England terraced average, while flats are only 11.4% above. The value here is in the ordinary streets, not just the grand homes.
What type of property is most common in Bath, and where are the flats?
Detached houses are the most common type in every Bath postcode, from 38.2% of stock in BS31 up to 65.9% in the Chew Valley's BS40. Flats, the type that usually carries the buy-to-let market, are concentrated in the city: they make up 11.1% of stock in BA1 (City Centre North, Weston) and 10.1% in BS31 (Keynsham, Saltford), against just 3.2% out in BS40. Across the area, flats average £239,054 on the Land Registry index, the only property type that comes close to the national level, so they are the cheapest way to own in Bath.
The student and professional rental demand around BA2 and the universities is what makes city-centre flats workable as lets. For the purpose-built end of the student market, see our guide to student accommodation for sale.
What rental yields can you get in Bath?
Gross yields run from 3.5% in BS40 (Chew Magna, Chew Stoke) up to 4.4% in BA2 (City Centre South, Oldfield Park), with BA1 at 3.9% and BS31 at 3.6% in between. That is a low band, and it is low for one reason: prices are high. A £1,830 monthly rent in BA2 is a strong figure, but it lands on a £501,544 asking price, so the income return stays modest.
Two of the six postcodes, BA3 and BS39, do not have enough rental listings to publish a reliable yield, so the figures above cover the four measured postcodes. Across all of them, Bath rewards capital growth over cash flow.
Is there strong tenant demand in Bath?
Yes, particularly in the city. BA1 and BA2 both have enough rental listings to read the market with confidence, and in both the balance currently sits with landlords: homes in BA1 let in around 45 days on average and in BA2 in around 58 days, against firm demand from students, university staff and NHS workers at the Royal United Hospitals. The University of Bath and Bath Spa University together keep that demand running year-round.
The fast rail link to Bristol, 11 minutes to Temple Meads, widens the pool further to people who work in Bristol but want to live in Bath. The flip side is supply: a World Heritage City cannot easily build more homes, so the tenant pool is competing for a limited stock.
How do student and HMO demand, rents and room rates compare in Bath?
The University of Bath and Bath Spa University provide student-demand context, with student housing concentrated around BA2 and the city centre where smaller flats and terraces are more common. The live room-advert sample below records similar weekly room rates in BA1 and BA2; it does not establish occupancy or a net HMO return. Student lets can also involve seasonal voids and more management than a standard tenancy.
On the HMO side, a sample of current room adverts puts a double room with a shared bathroom at around £176 a week in BA1 (26 adverts, with the middle 80% between £137 and £219) and £177 a week in BA2 (57 adverts, between £145 and £220). Those were the only room types with enough live adverts for a reliable figure. For how the numbers work on a shared house, see our complete guide to investing in HMOs.
How do I buy an investment property in Bath?
Start by deciding whether you are buying for growth or income, because in Bath that points you at a very different postcode. BS31 (Keynsham, Saltford) has delivered the strongest five-year growth at 19.2%, while BA2 (City Centre South, Oldfield Park) carries the top yield at 4.4% and the deepest student-led rental market. Budget for a 30% deposit, which runs from £119,078 in BA3 to £183,250 in BS40, larger numbers than most of the country because the cheapest postcode still asks close to £400,000.
Beyond what is listed openly, plenty of experienced investors buy below asking through off market properties and BMV property. To see what is available now, browse investment property in bath or buy-to-let homes for sale.
Ready to buy property?
Browse investment properties with prices and gross yields shown for each opportunity.
Get property alerts