
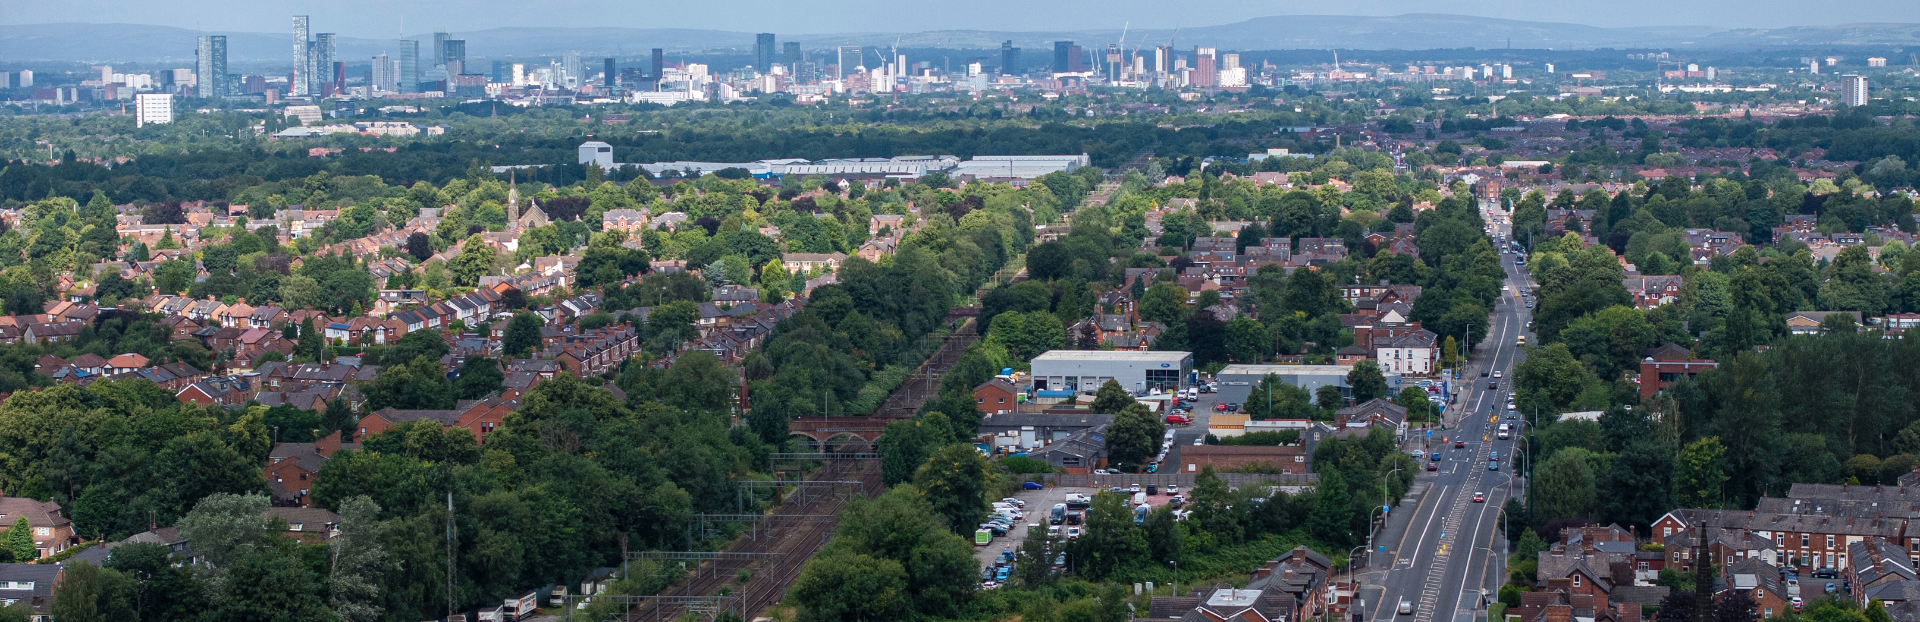
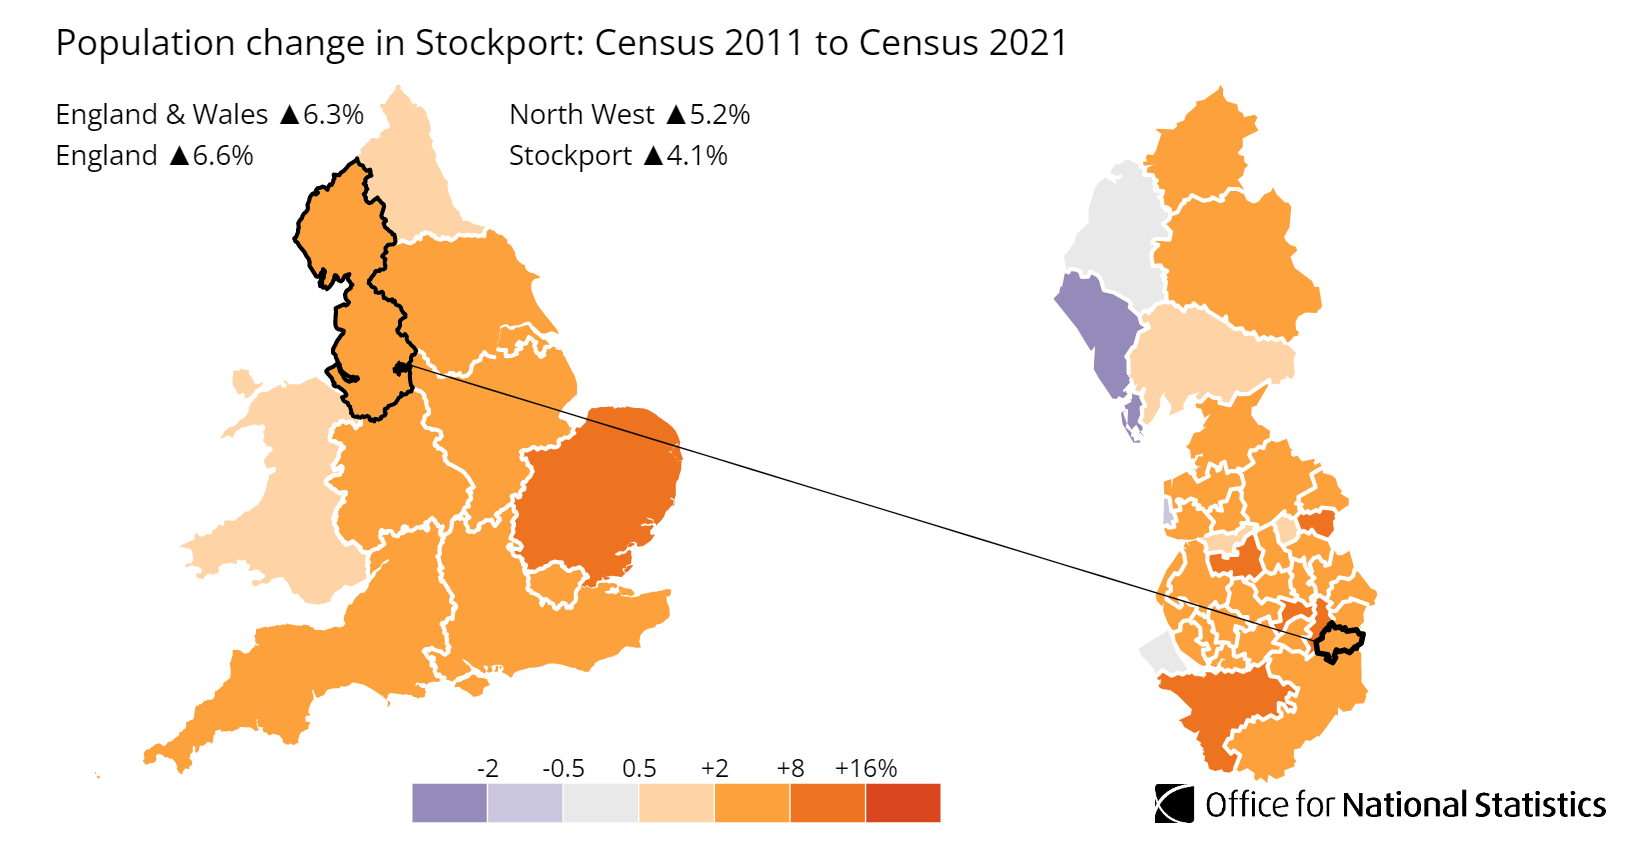
Stockport is a metropolitan borough of Greater Manchester, in north-west England. Average sold prices in Stockport sit at £313,101 on the HM Land Registry House Price Index, 8.0% above the England average of £289,946 and 45.8% above the North West regional figure of £214,678. Stockport is one of the few North West boroughs that trades above the national average, and that premium is the headline fact for any investor here. It comes from being an affluent Greater Manchester commuter borough, with leafy southern suburbs that compete with Cheshire on price and a town centre seven miles from Manchester city centre. The borough's population grew 4.06% between the 2011 and 2021 censuses, from 283,275 to 294,773 residents.
That borough-wide premium hides one of the widest internal spreads in Greater Manchester. Asking prices run from £205,216 in SK1 around the town centre up to £638,191 in WA15 Hale, a gap of nearly £433,000 between the cheapest and dearest postcode. For an investor, that spread is a two-tier market inside one borough: SK1, SK5, M19 and SK3 deliver yields above 5%, while the premium southern suburbs carry thinner income returns.
This guide covers the Metropolitan Borough of Stockport (ONS code E08000007) across postcodes SK1 to SK8, SK12, plus M19 and WA15. Stockport sits on Greater Manchester's southern edge, bordering Cheshire and the Peak District, with the M60 ringing its northern side. Investors weighing up the wider region often compare it with neighbouring Manchester buy-to-let, Tameside and Trafford.
Article updated: July 2026

Why Invest in Stockport?
Stockport's population grew 4.06% between the 2011 and 2021 censuses, from 283,275 to 294,773 residents. The pull is geography as much as anything: Stockport station runs direct trains into Manchester Piccadilly in under ten minutes, and the M60 rings the northern edge of the borough. That connectivity draws both Manchester commuters and tenants who want suburban living without leaving Greater Manchester, and it underpins demand right across the price range.
The local employment rate of 75.3% sits just above the North West average of 74.5% and 0.3 percentage points below Great Britain's 75.6%, while unemployment of 4.2% is marginally below the regional and national 4.3%. Stockport's economy is diversified rather than dependent on one sector, spread across health and social work, retail, professional services and manufacturing. Stockport NHS Foundation Trust, which runs Stepping Hill Hospital, is one of the borough's largest single employers, and proximity to Manchester Airport pulls professional tenants towards the southern suburbs.
Median gross annual earnings in Stockport are £39,318, which is 5.0% above the North West regional median of £37,445 and broadly level with the Great Britain median of £39,125. Higher local wages let tenants absorb higher rents, but they also push asking prices beyond what most North West towns can command. That trade-off is the through-line of this guide: stronger fundamentals, a premium to pay for them, and yields that compress as you move south into the more affluent postcodes.
Stockport Economic Summary
- Population: 294,773 (2021 Census). Growth of 4.06% from 2011.
- Median annual salary: £39,318 (Stockport), £37,445 (North West), £39,125 (Great Britain)
- Employment rate: 75.3% (Stockport), 74.5% (North West), 75.6% (Great Britain)
- Unemployment rate: 4.2% (Stockport), 4.3% (North West), 4.3% (Great Britain)
- Key employment sectors: Health and social work, retail, professional services, manufacturing, education
Source: ONS Census 2021, Nomis Labour Market Profile (ASHE 2025, Employment Oct 2024-Sep 2025)
Regeneration and Investment in Stockport
More than £1.4 billion of investment is reshaping Stockport's town centre through three connected regeneration programmes, run through a Mayoral Development Corporation model previously used only at London's Olympic Park. The investment is concentrated on the western and eastern sides of the town centre, where it adds thousands of new homes to a market that has long pushed its growth out into the suburbs.
- Stockport Mayoral Development Corporation, Town Centre West (under construction, around £1 billion): The MDC covers 130 acres on the western side of the town centre, anchored by the completed Stockport Exchange office and the Interchange transport hub with its rooftop park and 196 new homes. Thousands more homes, commercial space and public realm improvements are in the pipeline. Updates at Stockport Mayoral Development Corporation.
- Stockport 8 (Phase 1 on site 2026, around £350 million): A partnership between the MDC, Homes England, Muse and Legal & General to deliver up to 1,300 homes across eight sites on the western edge of the town centre, with the first phase starting on site in 2026. Updates at Stockport 8.
- Town Centre East Mayoral Development Area (designated late 2025, masterplanning): The Greater Manchester Combined Authority designated the eastern side of the town centre as a new Mayoral Development Area in late 2025, extending the corporation's remit towards a long-term plan for new homes, a school, a health hub and a riverside park. Updates at GMCA.
Source: Office for National Statistics - Population for Stockport
Stockport Property Market Analysis
Average property prices in Stockport have risen 481.6% since January 1995, from £53,838 to £313,101. The sections below trace that climb cycle by cycle, then drill into current postcode-level data for sold prices, price per square foot, asking prices, growth, transaction volumes and selling times.
When was the last house price crash in Stockport?
All sold property prices for Stockport are recorded by HM Land Registry at borough level under the Metropolitan Borough of Stockport. The Land Registry House Price Index tracks average prices from January 1995 to March 2026, covering 31 years of market cycles.
The 1995 to 2007 climb: Stockport started at £53,838 in January 1995. Growth was steady through the late 1990s, reaching £67,795 by January 2000 and £78,421 by December that year. The early 2000s ran hot, with prices more than doubling to £158,914 by December 2005 on cheap credit and the spread of buy-to-let. The market peaked at £180,209 in December 2007.
2008 to 2009, the financial crisis: Prices fell from the December 2007 peak of £180,209 to a trough of £150,765 in April 2009, a decline of 16.3% over 16 months. The worst year-on-year reading was -15.3% in March 2009. Stockport's fall was shallower than both England's 18.2% and the North West's 18.3%. The borough's mix of established owner-occupier housing and settled suburbs gave it a floor that more speculative, new-build-heavy markets did not have.
The 2009 to 2013 stagnation: Prices bounced off the April 2009 trough to £159,932 by December 2009, then went sideways. The average traded between roughly £156,000 and £165,000 for four years, reaching £165,118 by December 2013, still 8.4% below the pre-crash peak. Stockport spent the early 2010s unable to push past where it had been in 2007.
Recovery, 2014 to 2016: Growth returned at 5% to 7% a year. Prices first passed the December 2007 peak in June 2015, at £181,877. That recovery took seven and a half years. By December 2016 the average had reached £199,118.
The 2017 to 2019 pre-pandemic growth: Steady mid-single-digit growth continued as Manchester's rising city centre prices pushed more buyers out to the suburbs. Prices moved from £211,115 in December 2017 to £231,993 by December 2019.
2020 to 2022, the pandemic surge: The stamp duty holiday and the shift towards space and home-working turbocharged a commuter borough like Stockport. Prices rose from £233,727 in June 2020 to £249,769 by December 2020 (7.7% annual), then £267,088 by December 2021 (6.9%), and reached £295,553 by December 2022 (10.7% annual growth).
The 2023 rate shock: Higher mortgage rates cooled the market. Prices eased to £287,889 by December 2023, recording -2.6% annual growth. The correction was mild and short by the standards of more debt-exposed markets.
2024 to present: Prices recovered to £300,923 by December 2024 (4.5% annual) and have kept climbing to £313,101 by the latest reading in March 2026, an all-time high. The current price is 73.7% above the pre-crash peak of £180,209.
Long-term growth summary:
- 5 years (March 2021 to March 2026): 24.1% growth (£252,217 to £313,101)
- 10 years (December 2015 to March 2026): 67.8% growth (£186,557 to £313,101)
- 15 years (December 2010 to March 2026): 95.4% growth (£160,247 to £313,101)
- 20 years (December 2005 to March 2026): 97.0% growth (£158,914 to £313,101)
- 30 years (January 1995 to March 2026): 481.6% growth (£53,838 to £313,101)
Stockport's 16.3% crash was shallower than both the regional and national averages, and the 30-year return of 481.6% reflects sustained long-term capital growth driven by Manchester's overflow demand. The seven-and-a-half-year recovery was in line with most North West markets. An investor who bought at the exact peak in December 2007 would now be sitting on a 73.7% gain on the Land Registry average, though that height also means today's buyer carries more in absolute terms if the cycle turns again.
- All property types
- Detached
- Semi-detached
- Terraced
- Flats
Source: HM Land Registry House Price Index
| Year | All property types | Detached | Semi-detached | Terraced | Flats |
|---|---|---|---|---|---|
| 1995-01 | £53,838 | £98,953 | £56,800 | £40,693 | £37,751 |
| 1995-02 | £52,759 | £96,072 | £55,911 | £39,838 | £37,075 |
| 1995-03 | £52,960 | £96,256 | £56,096 | £40,093 | £37,130 |
| 1995-04 | £53,226 | £96,396 | £56,418 | £40,325 | £37,391 |
| 1995-05 | £53,404 | £96,703 | £56,554 | £40,537 | £37,449 |
| 1995-06 | £53,399 | £96,664 | £56,634 | £40,416 | £37,592 |
| 1995-07 | £53,190 | £96,519 | £56,454 | £40,192 | £37,272 |
| 1995-08 | £53,669 | £97,963 | £56,938 | £40,465 | £37,432 |
| 1995-09 | £54,195 | £99,243 | £57,437 | £40,893 | £37,564 |
| 1995-10 | £54,079 | £99,087 | £57,379 | £40,695 | £37,588 |
| 1995-11 | £54,008 | £98,797 | £57,359 | £40,560 | £37,804 |
| 1995-12 | £52,772 | £96,301 | £56,124 | £39,585 | £37,059 |
| 1996-01 | £52,008 | £95,116 | £55,310 | £39,000 | £36,352 |
| 1996-02 | £51,605 | £94,324 | £54,930 | £38,734 | £35,817 |
| 1996-03 | £52,365 | £95,913 | £55,792 | £39,237 | £36,217 |
| 1996-04 | £53,019 | £96,697 | £56,458 | £39,850 | £36,797 |
| 1996-05 | £53,467 | £97,273 | £56,844 | £40,334 | £37,187 |
| 1996-06 | £53,481 | £97,142 | £56,775 | £40,425 | £37,417 |
| 1996-07 | £53,755 | £98,034 | £57,098 | £40,533 | £37,398 |
| 1996-08 | £54,304 | £99,705 | £57,697 | £40,768 | £37,627 |
| 1996-09 | £54,887 | £101,334 | £58,316 | £41,120 | £37,712 |
| 1996-10 | £55,484 | £102,534 | £58,978 | £41,521 | £38,068 |
| 1996-11 | £55,137 | £101,592 | £58,633 | £41,297 | £37,949 |
| 1996-12 | £54,932 | £100,800 | £58,502 | £41,170 | £37,836 |
| 1997-01 | £54,425 | £99,853 | £57,968 | £40,796 | £37,462 |
| 1997-02 | £54,712 | £100,723 | £58,254 | £40,942 | £37,592 |
| 1997-03 | £55,003 | £101,481 | £58,417 | £41,222 | £37,870 |
| 1997-04 | £56,022 | £103,127 | £59,487 | £42,068 | £38,557 |
| 1997-05 | £57,073 | £104,825 | £60,700 | £42,889 | £39,052 |
| 1997-06 | £57,760 | £106,305 | £61,507 | £43,352 | £39,179 |
| 1997-07 | £57,985 | £107,084 | £61,753 | £43,489 | £39,023 |
| 1997-08 | £57,987 | £107,611 | £61,725 | £43,404 | £38,887 |
| 1997-09 | £57,722 | £107,280 | £61,490 | £43,128 | £38,644 |
| 1997-10 | £57,496 | £106,986 | £61,303 | £42,843 | £38,601 |
| 1997-11 | £57,749 | £107,454 | £61,581 | £43,015 | £38,803 |
| 1997-12 | £58,174 | £108,006 | £62,126 | £43,294 | £39,148 |
| 1998-01 | £58,900 | £109,700 | £62,807 | £43,841 | £39,594 |
| 1998-02 | £57,938 | £107,655 | £61,815 | £43,096 | £39,215 |
| 1998-03 | £57,620 | £107,160 | £61,448 | £42,877 | £38,922 |
| 1998-04 | £57,488 | £106,390 | £61,426 | £42,815 | £38,813 |
| 1998-05 | £58,711 | £108,407 | £62,708 | £43,878 | £39,405 |
| 1998-06 | £60,052 | £110,816 | £64,127 | £44,854 | £40,539 |
| 1998-07 | £60,928 | £112,639 | £65,064 | £45,462 | £41,069 |
| 1998-08 | £61,043 | £113,580 | £65,148 | £45,411 | £41,036 |
| 1998-09 | £61,383 | £114,679 | £65,461 | £45,644 | £41,005 |
| 1998-10 | £61,696 | £115,461 | £65,781 | £45,791 | £41,399 |
| 1998-11 | £61,800 | £115,590 | £65,967 | £45,766 | £41,664 |
| 1998-12 | £61,025 | £113,596 | £65,227 | £45,179 | £41,469 |
| 1999-01 | £60,652 | £112,870 | £64,828 | £44,912 | £41,216 |
| 1999-02 | £60,813 | £113,086 | £65,024 | £45,022 | £41,342 |
| 1999-03 | £61,701 | £115,073 | £65,927 | £45,635 | £41,917 |
| 1999-04 | £62,207 | £115,567 | £66,452 | £46,152 | £42,275 |
| 1999-05 | £63,389 | £117,377 | £67,704 | £47,164 | £43,040 |
| 1999-06 | £63,597 | £117,707 | £67,911 | £47,369 | £43,116 |
| 1999-07 | £64,754 | £120,369 | £69,120 | £48,142 | £43,780 |
| 1999-08 | £65,490 | £122,259 | £69,812 | £48,672 | £44,156 |
| 1999-09 | £65,800 | £123,390 | £70,058 | £48,855 | £44,287 |
| 1999-10 | £66,101 | £124,006 | £70,453 | £48,902 | £44,770 |
| 1999-11 | £66,274 | £124,274 | £70,673 | £48,966 | £45,033 |
| 1999-12 | £67,903 | £126,620 | £72,487 | £50,197 | £46,481 |
| 2000-01 | £67,795 | £126,691 | £72,357 | £50,136 | £46,125 |
| 2000-02 | £68,466 | £128,054 | £73,062 | £50,589 | £46,578 |
| 2000-03 | £69,469 | £130,284 | £74,176 | £51,250 | £46,886 |
| 2000-04 | £71,227 | £133,083 | £75,996 | £52,622 | £48,398 |
| 2000-05 | £72,452 | £135,174 | £77,412 | £53,424 | £49,367 |
| 2000-06 | £73,147 | £136,195 | £78,208 | £53,854 | £50,159 |
| 2000-07 | £74,038 | £138,737 | £79,278 | £54,288 | £50,454 |
| 2000-08 | £75,214 | £141,717 | £80,612 | £54,868 | £51,404 |
| 2000-09 | £76,904 | £146,081 | £82,331 | £55,955 | £52,479 |
| 2000-10 | £77,596 | £147,475 | £83,180 | £56,255 | £53,239 |
| 2000-11 | £78,102 | £148,597 | £83,633 | £56,648 | £53,684 |
| 2000-12 | £78,421 | £148,421 | £84,048 | £56,847 | £54,376 |
| 2001-01 | £78,643 | £148,615 | £84,168 | £57,123 | £54,707 |
| 2001-02 | £78,059 | £147,059 | £83,576 | £56,766 | £54,274 |
| 2001-03 | £78,172 | £147,481 | £83,733 | £56,865 | £53,970 |
| 2001-04 | £78,829 | £148,411 | £84,320 | £57,521 | £54,415 |
| 2001-05 | £80,434 | £150,942 | £86,023 | £58,812 | £55,509 |
| 2001-06 | £81,555 | £152,580 | £87,153 | £59,664 | £56,699 |
| 2001-07 | £83,078 | £155,818 | £88,885 | £60,620 | £57,684 |
| 2001-08 | £84,721 | £159,701 | £90,518 | £61,731 | £58,974 |
| 2001-09 | £85,167 | £161,461 | £90,845 | £62,035 | £59,223 |
| 2001-10 | £86,658 | £164,002 | £92,438 | £63,103 | £60,490 |
| 2001-11 | £86,995 | £164,209 | £92,956 | £63,225 | £60,910 |
| 2001-12 | £88,587 | £166,035 | £94,858 | £64,211 | £62,738 |
| 2002-01 | £88,910 | £166,651 | £95,235 | £64,327 | £63,245 |
| 2002-02 | £89,363 | £167,170 | £95,572 | £64,781 | £63,842 |
| 2002-03 | £90,081 | £168,729 | £96,297 | £65,398 | £64,025 |
| 2002-04 | £91,560 | £170,622 | £97,778 | £66,602 | £65,556 |
| 2002-05 | £93,815 | £174,248 | £100,339 | £68,217 | £67,153 |
| 2002-06 | £95,945 | £177,898 | £102,511 | £69,823 | £69,040 |
| 2002-07 | £98,027 | £182,345 | £104,753 | £71,348 | £70,053 |
| 2002-08 | £100,616 | £187,386 | £107,464 | £73,232 | £71,935 |
| 2002-09 | £102,309 | £190,851 | £109,465 | £74,366 | £72,635 |
| 2002-10 | £103,544 | £192,665 | £110,992 | £75,108 | £73,693 |
| 2002-11 | £103,923 | £193,659 | £111,373 | £75,341 | £73,988 |
| 2002-12 | £104,873 | £194,468 | £112,474 | £76,033 | £75,046 |
| 2003-01 | £107,108 | £198,442 | £114,614 | £77,918 | £76,710 |
| 2003-02 | £108,137 | £199,119 | £115,894 | £78,698 | £77,611 |
| 2003-03 | £110,000 | £202,799 | £117,786 | £80,071 | £79,057 |
| 2003-04 | £111,502 | £204,574 | £119,709 | £80,952 | £80,503 |
| 2003-05 | £115,007 | £210,862 | £123,502 | £83,539 | £82,900 |
| 2003-06 | £117,683 | £214,658 | £126,322 | £85,680 | £85,130 |
| 2003-07 | £120,278 | £218,837 | £129,098 | £87,789 | £86,681 |
| 2003-08 | £121,943 | £221,237 | £130,826 | £89,186 | £87,907 |
| 2003-09 | £122,975 | £223,084 | £131,991 | £90,104 | £87,948 |
| 2003-10 | £124,217 | £224,816 | £133,189 | £91,219 | £88,953 |
| 2003-11 | £125,654 | £226,906 | £134,734 | £92,399 | £89,920 |
| 2003-12 | £128,432 | £229,747 | £137,603 | £94,821 | £92,575 |
| 2004-01 | £129,655 | £231,785 | £138,730 | £95,951 | £93,404 |
| 2004-02 | £132,219 | £235,451 | £141,215 | £98,236 | £95,513 |
| 2004-03 | £132,083 | £235,703 | £140,870 | £98,312 | £95,175 |
| 2004-04 | £134,512 | £237,627 | £143,425 | £100,719 | £96,907 |
| 2004-05 | £136,531 | £238,713 | £145,422 | £102,917 | £98,551 |
| 2004-06 | £141,755 | £245,892 | £150,950 | £107,272 | £102,590 |
| 2004-07 | £144,936 | £250,834 | £154,381 | £109,822 | £104,733 |
| 2004-08 | £148,868 | £258,482 | £158,506 | £112,745 | £107,291 |
| 2004-09 | £150,559 | £262,104 | £160,211 | £114,071 | £108,129 |
| 2004-10 | £152,666 | £266,022 | £162,201 | £115,696 | £110,190 |
| 2004-11 | £152,094 | £264,533 | £161,495 | £115,379 | £110,114 |
| 2004-12 | £152,447 | £264,065 | £161,639 | £115,962 | £110,966 |
| 2005-01 | £153,686 | £266,447 | £162,670 | £117,145 | £111,828 |
| 2005-02 | £154,613 | £268,136 | £163,763 | £117,770 | £112,334 |
| 2005-03 | £154,612 | £268,275 | £163,862 | £117,729 | £111,916 |
| 2005-04 | £152,802 | £263,445 | £162,113 | £116,575 | £110,506 |
| 2005-05 | £152,865 | £262,869 | £161,847 | £117,008 | £110,742 |
| 2005-06 | £155,321 | £265,383 | £164,286 | £119,379 | £112,571 |
| 2005-07 | £157,799 | £269,824 | £166,918 | £121,296 | £114,195 |
| 2005-08 | £161,131 | £275,629 | £170,268 | £124,122 | £116,289 |
| 2005-09 | £160,096 | £274,880 | £168,991 | £123,405 | £115,236 |
| 2005-10 | £160,235 | £274,888 | £168,758 | £123,821 | £115,611 |
| 2005-11 | £158,403 | £271,083 | £166,869 | £122,453 | £114,423 |
| 2005-12 | £158,914 | £270,525 | £167,202 | £123,061 | £115,550 |
| 2006-01 | £158,506 | £270,039 | £166,726 | £122,908 | £114,833 |
| 2006-02 | £159,324 | £270,760 | £167,338 | £123,827 | £115,728 |
| 2006-03 | £159,511 | £271,931 | £167,722 | £123,907 | £115,118 |
| 2006-04 | £161,486 | £274,042 | £169,835 | £125,676 | £116,609 |
| 2006-05 | £162,026 | £275,014 | £170,568 | £126,055 | £116,673 |
| 2006-06 | £164,379 | £278,215 | £173,021 | £128,098 | £118,359 |
| 2006-07 | £164,787 | £279,302 | £173,363 | £128,624 | £118,091 |
| 2006-08 | £166,632 | £282,822 | £175,289 | £130,284 | £118,652 |
| 2006-09 | £166,920 | £284,390 | £175,597 | £130,479 | £118,270 |
| 2006-10 | £168,236 | £286,953 | £176,990 | £131,308 | £119,497 |
| 2006-11 | £167,851 | £286,284 | £176,648 | £130,991 | £119,119 |
| 2006-12 | £168,329 | £285,746 | £176,948 | £131,724 | £119,855 |
| 2007-01 | £169,398 | £287,559 | £177,991 | £132,758 | £120,310 |
| 2007-02 | £169,803 | £288,235 | £178,251 | £133,024 | £121,151 |
| 2007-03 | £171,029 | £291,188 | £179,634 | £133,892 | £121,524 |
| 2007-04 | £170,691 | £289,692 | £179,153 | £133,939 | £121,430 |
| 2007-05 | £173,419 | £293,121 | £181,875 | £136,496 | £123,468 |
| 2007-06 | £176,165 | £297,216 | £184,563 | £138,913 | £125,636 |
| 2007-07 | £178,423 | £302,068 | £186,941 | £140,580 | £126,807 |
| 2007-08 | £179,270 | £304,884 | £187,892 | £141,232 | £126,343 |
| 2007-09 | £178,678 | £304,954 | £187,235 | £140,605 | £125,707 |
| 2007-10 | £180,053 | £308,161 | £188,428 | £141,558 | £127,097 |
| 2007-11 | £179,452 | £307,503 | £187,698 | £140,855 | £127,292 |
| 2007-12 | £180,209 | £308,133 | £188,481 | £141,510 | £128,147 |
| 2008-01 | £177,868 | £304,533 | £186,036 | £139,617 | £126,342 |
| 2008-02 | £179,167 | £307,141 | £187,442 | £140,661 | £126,855 |
| 2008-03 | £178,432 | £307,170 | £186,898 | £139,942 | £125,294 |
| 2008-04 | £176,512 | £304,350 | £184,932 | £138,526 | £123,284 |
| 2008-05 | £176,609 | £304,192 | £185,126 | £138,731 | £123,008 |
| 2008-06 | £174,031 | £299,421 | £182,387 | £136,751 | £121,409 |
| 2008-07 | £173,521 | £298,448 | £182,230 | £136,015 | £121,035 |
| 2008-08 | £168,862 | £291,081 | £177,276 | £132,225 | £117,856 |
| 2008-09 | £166,594 | £289,596 | £174,668 | £130,080 | £116,171 |
| 2008-10 | £165,018 | £287,433 | £172,773 | £128,853 | £115,279 |
| 2008-11 | £161,221 | £281,499 | £168,844 | £125,649 | £112,669 |
| 2008-12 | £157,970 | £274,187 | £165,563 | £123,414 | £110,411 |
| 2009-01 | £154,380 | £268,527 | £161,660 | £120,511 | £108,130 |
| 2009-02 | £152,056 | £264,158 | £159,246 | £118,682 | £106,753 |
| 2009-03 | £151,199 | £262,891 | £158,372 | £117,758 | £106,734 |
| 2009-04 | £150,765 | £260,721 | £158,270 | £117,642 | £106,001 |
| 2009-05 | £152,132 | £262,347 | £159,861 | £119,049 | £106,342 |
| 2009-06 | £151,691 | £261,349 | £159,589 | £118,948 | £105,126 |
| 2009-07 | £152,942 | £263,656 | £161,044 | £120,051 | £105,215 |
| 2009-08 | £153,654 | £266,039 | £161,896 | £120,433 | £104,898 |
| 2009-09 | £155,520 | £269,763 | £163,943 | £121,798 | £105,763 |
| 2009-10 | £156,078 | £271,268 | £164,608 | £122,134 | £105,739 |
| 2009-11 | £158,200 | £274,885 | £166,688 | £124,103 | £107,028 |
| 2009-12 | £159,932 | £276,597 | £168,573 | £126,001 | £107,885 |
| 2010-01 | £159,203 | £276,166 | £168,078 | £125,125 | £106,653 |
| 2010-02 | £157,838 | £274,017 | £167,143 | £123,724 | £104,851 |
| 2010-03 | £157,394 | £275,704 | £166,792 | £122,577 | £104,056 |
| 2010-04 | £157,060 | £274,308 | £166,430 | £122,532 | £104,029 |
| 2010-05 | £159,612 | £278,698 | £168,920 | £124,626 | £106,162 |
| 2010-06 | £158,878 | £276,577 | £168,206 | £124,410 | £105,322 |
| 2010-07 | £160,533 | £280,522 | £169,843 | £125,695 | £105,852 |
| 2010-08 | £159,570 | £279,603 | £169,184 | £124,546 | £104,473 |
| 2010-09 | £159,354 | £280,705 | £168,959 | £124,031 | £103,886 |
| 2010-10 | £158,329 | £279,034 | £168,007 | £123,006 | £103,275 |
| 2010-11 | £159,004 | £280,857 | £168,544 | £123,482 | £103,814 |
| 2010-12 | £160,247 | £282,675 | £170,034 | £124,335 | £104,729 |
| 2011-01 | £159,453 | £282,352 | £169,088 | £123,442 | £104,282 |
| 2011-02 | £155,674 | £276,708 | £164,878 | £120,402 | £101,788 |
| 2011-03 | £154,695 | £276,645 | £163,640 | £119,348 | £101,062 |
| 2011-04 | £155,756 | £278,023 | £164,738 | £120,366 | £101,750 |
| 2011-05 | £157,531 | £279,565 | £166,836 | £121,822 | £103,391 |
| 2011-06 | £157,306 | £276,811 | £166,928 | £121,957 | £103,445 |
| 2011-07 | £156,592 | £274,922 | £166,293 | £121,390 | £103,171 |
| 2011-08 | £155,816 | £274,098 | £165,676 | £120,751 | £101,720 |
| 2011-09 | £156,264 | £276,336 | £166,002 | £121,031 | £101,432 |
| 2011-10 | £156,782 | £277,996 | £166,790 | £121,177 | £101,117 |
| 2011-11 | £156,161 | £277,217 | £166,008 | £120,500 | £101,289 |
| 2011-12 | £156,119 | £275,844 | £166,174 | £120,528 | £101,565 |
| 2012-01 | £155,685 | £274,053 | £165,779 | £120,497 | £101,173 |
| 2012-02 | £158,973 | £279,472 | £169,264 | £123,499 | £102,505 |
| 2012-03 | £157,534 | £276,224 | £167,602 | £122,862 | £101,408 |
| 2012-04 | £157,577 | £276,375 | £167,532 | £122,813 | £101,913 |
| 2012-05 | £155,922 | £272,850 | £165,837 | £121,503 | £101,254 |
| 2012-06 | £157,072 | £274,841 | £167,025 | £122,480 | £101,922 |
| 2012-07 | £158,281 | £276,763 | £168,187 | £123,741 | £102,420 |
| 2012-08 | £157,918 | £275,994 | £167,761 | £123,798 | £101,571 |
| 2012-09 | £158,928 | £278,859 | £168,795 | £124,339 | £101,981 |
| 2012-10 | £160,333 | £281,134 | £170,435 | £125,365 | £102,814 |
| 2012-11 | £160,818 | £282,261 | £170,973 | £125,583 | £103,217 |
| 2012-12 | £160,191 | £281,010 | £170,401 | £125,129 | £102,589 |
| 2013-01 | £158,096 | £277,852 | £168,369 | £123,244 | £100,858 |
| 2013-02 | £158,837 | £279,542 | £169,187 | £123,742 | £101,137 |
| 2013-03 | £157,476 | £277,769 | £167,746 | £122,436 | £100,331 |
| 2013-04 | £157,961 | £278,451 | £168,052 | £123,144 | £100,588 |
| 2013-05 | £158,060 | £278,101 | £168,224 | £123,233 | £100,895 |
| 2013-06 | £161,082 | £282,174 | £171,517 | £125,970 | £102,786 |
| 2013-07 | £163,634 | £286,443 | £174,193 | £128,035 | £104,542 |
| 2013-08 | £163,682 | £286,444 | £174,311 | £128,170 | £104,226 |
| 2013-09 | £164,922 | £289,942 | £175,564 | £128,783 | £104,894 |
| 2013-10 | £165,174 | £291,221 | £176,014 | £128,597 | £104,742 |
| 2013-11 | £165,761 | £292,454 | £176,722 | £128,864 | £105,161 |
| 2013-12 | £165,118 | £289,725 | £176,302 | £128,529 | £105,008 |
| 2014-01 | £164,715 | £288,394 | £175,777 | £128,458 | £104,975 |
| 2014-02 | £165,881 | £290,533 | £176,930 | £129,536 | £105,541 |
| 2014-03 | £166,923 | £292,633 | £178,078 | £130,395 | £105,802 |
| 2014-04 | £167,843 | £293,766 | £179,015 | £131,434 | £106,166 |
| 2014-05 | £170,324 | £297,064 | £181,716 | £133,613 | £107,894 |
| 2014-06 | £172,683 | £300,896 | £184,197 | £135,646 | £109,296 |
| 2014-07 | £174,862 | £304,570 | £186,638 | £137,434 | £110,354 |
| 2014-08 | £176,288 | £307,556 | £188,231 | £138,509 | £110,819 |
| 2014-09 | £177,019 | £309,257 | £188,906 | £139,044 | £111,273 |
| 2014-10 | £176,745 | £308,982 | £188,621 | £138,637 | £111,335 |
| 2014-11 | £174,783 | £305,940 | £186,553 | £136,836 | £110,303 |
| 2014-12 | £173,878 | £304,726 | £185,572 | £135,957 | £109,848 |
| 2015-01 | £177,190 | £310,542 | £189,219 | £138,443 | £111,899 |
| 2015-02 | £178,487 | £312,634 | £190,354 | £139,669 | £112,957 |
| 2015-03 | £179,111 | £314,078 | £191,241 | £139,847 | £113,300 |
| 2015-04 | £177,869 | £312,282 | £189,818 | £138,933 | £112,360 |
| 2015-05 | £178,660 | £313,306 | £191,000 | £139,424 | £112,619 |
| 2015-06 | £181,877 | £318,338 | £194,457 | £142,394 | £114,020 |
| 2015-07 | £182,884 | £319,429 | £195,799 | £143,178 | £114,513 |
| 2015-08 | £184,507 | £322,574 | £197,506 | £144,555 | £115,165 |
| 2015-09 | £184,424 | £323,868 | £197,234 | £144,122 | £115,365 |
| 2015-10 | £185,735 | £327,113 | £198,641 | £144,976 | £115,920 |
| 2015-11 | £186,935 | £329,664 | £200,044 | £145,635 | £116,711 |
| 2015-12 | £186,557 | £328,479 | £199,830 | £145,444 | £116,171 |
| 2016-01 | £188,215 | £330,855 | £201,844 | £146,681 | £117,149 |
| 2016-02 | £188,532 | £331,603 | £202,163 | £147,019 | £117,077 |
| 2016-03 | £189,139 | £333,382 | £202,741 | £147,270 | £117,627 |
| 2016-04 | £189,103 | £332,713 | £202,519 | £147,599 | £117,647 |
| 2016-05 | £193,008 | £337,734 | £206,564 | £150,996 | £120,855 |
| 2016-06 | £196,309 | £341,988 | £210,019 | £154,011 | £123,162 |
| 2016-07 | £198,881 | £346,700 | £212,643 | £156,023 | £124,918 |
| 2016-08 | £200,738 | £350,969 | £214,632 | £157,246 | £125,893 |
| 2016-09 | £202,550 | £354,488 | £216,852 | £158,357 | £126,830 |
| 2016-10 | £202,113 | £354,733 | £216,480 | £157,339 | £127,133 |
| 2016-11 | £200,608 | £353,585 | £214,944 | £155,548 | £126,375 |
| 2016-12 | £199,118 | £351,581 | £213,160 | £154,215 | £125,829 |
| 2017-01 | £199,060 | £351,889 | £213,093 | £154,146 | £125,583 |
| 2017-02 | £199,498 | £351,839 | £213,248 | £154,761 | £126,513 |
| 2017-03 | £200,019 | £352,803 | £213,775 | £155,039 | £127,152 |
| 2017-04 | £203,426 | £358,484 | £217,109 | £157,898 | £129,754 |
| 2017-05 | £206,305 | £362,663 | £220,515 | £160,065 | £131,609 |
| 2017-06 | £209,846 | £367,369 | £224,311 | £163,139 | £134,197 |
| 2017-07 | £210,580 | £367,572 | £225,353 | £163,711 | £134,830 |
| 2017-08 | £210,811 | £368,118 | £225,415 | £164,182 | £134,699 |
| 2017-09 | £211,154 | £370,151 | £225,786 | £164,232 | £134,390 |
| 2017-10 | £209,704 | £368,637 | £224,300 | £162,957 | £132,940 |
| 2017-11 | £211,033 | £371,376 | £226,006 | £163,647 | £133,589 |
| 2017-12 | £211,115 | £370,713 | £226,250 | £163,810 | £133,641 |
| 2018-01 | £213,778 | £375,159 | £229,347 | £165,670 | £135,375 |
| 2018-02 | £213,999 | £376,337 | £229,495 | £165,960 | £134,998 |
| 2018-03 | £214,969 | £378,206 | £230,699 | £166,722 | £135,181 |
| 2018-04 | £214,449 | £376,932 | £230,097 | £166,872 | £134,146 |
| 2018-05 | £216,765 | £380,083 | £232,891 | £168,851 | £135,218 |
| 2018-06 | £218,191 | £382,555 | £234,667 | £169,778 | £135,962 |
| 2018-07 | £221,955 | £389,986 | £238,689 | £172,456 | £138,300 |
| 2018-08 | £222,201 | £391,039 | £239,010 | £172,463 | £138,287 |
| 2018-09 | £225,385 | £397,393 | £242,329 | £175,019 | £139,857 |
| 2018-10 | £226,153 | £399,056 | £243,233 | £175,460 | £140,270 |
| 2018-11 | £226,292 | £400,115 | £243,371 | £175,372 | £140,231 |
| 2018-12 | £225,832 | £398,715 | £242,914 | £174,961 | £140,336 |
| 2019-01 | £224,751 | £397,465 | £241,997 | £173,766 | £139,413 |
| 2019-02 | £224,560 | £397,428 | £241,752 | £173,548 | £139,361 |
| 2019-03 | £222,022 | £393,428 | £239,340 | £171,389 | £137,186 |
| 2019-04 | £222,761 | £393,604 | £240,065 | £172,505 | £137,503 |
| 2019-05 | £224,731 | £395,821 | £242,436 | £174,393 | £138,308 |
| 2019-06 | £227,533 | £399,980 | £245,493 | £176,757 | £140,103 |
| 2019-07 | £228,241 | £401,108 | £246,214 | £177,347 | £140,632 |
| 2019-08 | £227,583 | £400,033 | £245,463 | £177,034 | £139,899 |
| 2019-09 | £228,937 | £402,974 | £246,457 | £178,417 | £140,788 |
| 2019-10 | £229,890 | £404,526 | £247,917 | £178,829 | £141,112 |
| 2019-11 | £232,255 | £409,171 | £250,834 | £180,187 | £142,349 |
| 2019-12 | £231,993 | £408,689 | £250,867 | £179,856 | £141,741 |
| 2020-01 | £232,952 | £410,878 | £251,915 | £180,649 | £141,889 |
| 2020-02 | £233,120 | £411,467 | £251,911 | £181,045 | £141,713 |
| 2020-03 | £231,988 | £409,960 | £250,832 | £179,952 | £140,785 |
| 2020-04 | £232,135 | £411,684 | £250,795 | £180,325 | £139,931 |
| 2020-05 | £231,641 | £411,351 | £250,463 | £179,484 | £139,729 |
| 2020-06 | £233,727 | £414,451 | £252,950 | £181,243 | £140,573 |
| 2020-07 | £235,821 | £416,342 | £255,389 | £182,870 | £142,547 |
| 2020-08 | £238,864 | £421,821 | £258,883 | £185,461 | £143,458 |
| 2020-09 | £242,513 | £429,799 | £262,845 | £188,130 | £145,014 |
| 2020-10 | £244,735 | £435,077 | £265,276 | £189,847 | £145,500 |
| 2020-11 | £247,592 | £440,415 | £268,080 | £192,243 | £147,340 |
| 2020-12 | £249,769 | £444,073 | £270,189 | £194,326 | £148,572 |
| 2021-01 | £251,548 | £444,356 | £272,023 | £196,046 | £150,945 |
| 2021-02 | £251,587 | £440,783 | £271,777 | £196,781 | £152,452 |
| 2021-03 | £252,217 | £438,175 | £272,164 | £197,780 | £154,730 |
| 2021-04 | £252,161 | £438,178 | £271,589 | £198,183 | £154,864 |
| 2021-05 | £251,527 | £438,123 | £270,819 | £197,629 | £154,130 |
| 2021-06 | £257,053 | £447,066 | £276,332 | £202,814 | £157,270 |
| 2021-07 | £255,313 | £445,305 | £274,648 | £201,025 | £155,847 |
| 2021-08 | £256,652 | £448,990 | £276,529 | £201,766 | £155,553 |
| 2021-09 | £255,511 | £448,604 | £275,692 | £200,400 | £153,950 |
| 2021-10 | £260,649 | £460,280 | £281,610 | £203,811 | £155,897 |
| 2021-11 | £265,282 | £469,425 | £286,772 | £207,093 | £158,427 |
| 2021-12 | £267,088 | £474,606 | £289,036 | £208,044 | £158,555 |
| 2022-01 | £271,081 | £479,636 | £293,610 | £211,768 | £160,469 |
| 2022-02 | £273,714 | £483,363 | £296,392 | £214,186 | £162,236 |
| 2022-03 | £275,056 | £486,006 | £298,305 | £214,826 | £162,756 |
| 2022-04 | £277,061 | £489,163 | £300,135 | £216,907 | £163,975 |
| 2022-05 | £277,143 | £488,678 | £300,400 | £217,297 | £163,308 |
| 2022-06 | £282,846 | £497,561 | £306,482 | £222,220 | £166,910 |
| 2022-07 | £286,365 | £502,745 | £310,690 | £225,191 | £168,323 |
| 2022-08 | £293,349 | £514,147 | £318,273 | £231,232 | £171,864 |
| 2022-09 | £295,047 | £517,431 | £320,074 | £232,953 | £171,739 |
| 2022-10 | £299,128 | £525,614 | £324,389 | £235,931 | £174,075 |
| 2022-11 | £297,475 | £524,077 | £322,467 | £234,342 | £172,905 |
| 2022-12 | £295,553 | £520,245 | £320,358 | £232,833 | £172,258 |
| 2023-01 | £293,622 | £517,025 | £318,632 | £231,041 | £170,632 |
| 2023-02 | £293,732 | £518,060 | £318,922 | £230,584 | £170,734 |
| 2023-03 | £290,910 | £515,246 | £316,261 | £227,274 | £168,672 |
| 2023-04 | £285,314 | £506,234 | £310,181 | £222,553 | £165,587 |
| 2023-05 | £283,208 | £501,759 | £308,117 | £220,682 | £164,720 |
| 2023-06 | £283,832 | £501,786 | £308,487 | £221,920 | £164,855 |
| 2023-07 | £287,981 | £507,235 | £313,194 | £225,638 | £167,027 |
| 2023-08 | £287,979 | £507,439 | £313,051 | £226,290 | £166,057 |
| 2023-09 | £289,269 | £509,405 | £314,522 | £227,511 | £166,476 |
| 2023-10 | £288,692 | £507,869 | £313,570 | £227,270 | £166,600 |
| 2023-11 | £288,845 | £508,179 | £313,897 | £226,945 | £167,145 |
| 2023-12 | £287,889 | £505,431 | £312,997 | £226,124 | £166,983 |
| 2024-01 | £290,266 | £510,497 | £315,584 | £227,904 | £168,072 |
| 2024-02 | £288,891 | £506,213 | £313,911 | £227,558 | £167,314 |
| 2024-03 | £289,478 | £506,914 | £314,190 | £228,066 | £168,437 |
| 2024-04 | £286,531 | £500,427 | £310,856 | £226,016 | £167,210 |
| 2024-05 | £289,470 | £504,824 | £314,075 | £228,240 | £169,402 |
| 2024-06 | £293,564 | £511,172 | £318,514 | £232,040 | £171,291 |
| 2024-07 | £293,778 | £510,905 | £318,823 | £232,820 | £170,635 |
| 2024-08 | £295,120 | £513,462 | £320,161 | £234,451 | £170,602 |
| 2024-09 | £295,112 | £515,549 | £320,466 | £234,169 | £169,403 |
| 2024-10 | £298,921 | £523,910 | £324,228 | £236,767 | £172,062 |
| 2024-11 | £300,218 | £527,264 | £325,992 | £237,365 | £172,301 |
| 2024-12 | £300,923 | £528,668 | £326,676 | £238,060 | £172,549 |
| 2025-01 | £299,102 | £525,761 | £325,281 | £236,650 | £170,276 |
| 2025-02 | £297,062 | £521,885 | £322,802 | £235,378 | £169,174 |
| 2025-03 | £297,386 | £517,959 | £322,788 | £236,314 | £171,136 |
| 2025-04 | £300,139 | £526,137 | £326,138 | £237,433 | £172,049 |
| 2025-05 | £302,167 | £531,000 | £328,647 | £238,918 | £172,286 |
| 2025-06 | £304,250 | £538,343 | £331,821 | £239,898 | £171,175 |
| 2025-07 | £305,006 | £535,873 | £332,676 | £241,881 | £171,432 |
| 2025-08 | £308,113 | £540,279 | £336,596 | £244,381 | £172,777 |
| 2025-09 | £307,671 | £540,237 | £336,304 | £244,215 | £171,661 |
| 2025-10 | £307,468 | £539,855 | £336,154 | £244,007 | £171,506 |
| 2025-11 | £306,523 | £538,196 | £334,741 | £243,667 | £171,040 |
| 2025-12 | £307,183 | £537,607 | £335,287 | £244,844 | £171,627 |
| 2026-01 | £310,226 | £541,447 | £338,872 | £247,942 | £172,722 |
| 2026-02 | £312,130 | £544,902 | £341,443 | £249,301 | £173,088 |
| 2026-03 | £313,101 | £547,093 | £343,089 | £250,051 | £172,398 |
- All property types
- Detached
- Semi-detached
- Terraced
- Flats
Source: HM Land Registry House Price Index
| Year | All property types | Detached | Semi-detached | Terraced | Flats |
|---|---|---|---|---|---|
| 1996-01 | -3.4% | -3.9% | -2.6% | -4.2% | -3.7% |
| 1996-02 | -2.2% | -1.8% | -1.8% | -2.8% | -3.4% |
| 1996-03 | -1.1% | -0.4% | -0.5% | -2.1% | -2.5% |
| 1996-04 | -0.4% | +0.3% | +0.1% | -1.2% | -1.6% |
| 1996-05 | +0.1% | +0.6% | +0.5% | -0.5% | -0.7% |
| 1996-06 | +0.2% | +0.5% | +0.2% | 0.0% | -0.5% |
| 1996-07 | +1.1% | +1.6% | +1.1% | +0.8% | +0.3% |
| 1996-08 | +1.2% | +1.8% | +1.3% | +0.7% | +0.5% |
| 1996-09 | +1.3% | +2.1% | +1.5% | +0.6% | +0.4% |
| 1996-10 | +2.6% | +3.5% | +2.8% | +2.0% | +1.3% |
| 1996-11 | +2.1% | +2.8% | +2.2% | +1.8% | +0.4% |
| 1996-12 | +4.1% | +4.7% | +4.2% | +4.0% | +2.1% |
| 1997-01 | +4.6% | +5.0% | +4.8% | +4.6% | +3.1% |
| 1997-02 | +6.0% | +6.8% | +6.1% | +5.7% | +5.0% |
| 1997-03 | +5.0% | +5.8% | +4.7% | +5.1% | +4.6% |
| 1997-04 | +5.7% | +6.7% | +5.4% | +5.6% | +4.8% |
| 1997-05 | +6.7% | +7.8% | +6.8% | +6.3% | +5.0% |
| 1997-06 | +8.0% | +9.4% | +8.3% | +7.2% | +4.7% |
| 1997-07 | +7.9% | +9.2% | +8.2% | +7.3% | +4.3% |
| 1997-08 | +6.8% | +7.9% | +7.0% | +6.5% | +3.3% |
| 1997-09 | +5.2% | +5.9% | +5.4% | +4.9% | +2.5% |
| 1997-10 | +3.6% | +4.3% | +3.9% | +3.2% | +1.4% |
| 1997-11 | +4.7% | +5.8% | +5.0% | +4.2% | +2.2% |
| 1997-12 | +5.9% | +7.1% | +6.2% | +5.2% | +3.5% |
| 1998-01 | +8.2% | +9.9% | +8.3% | +7.5% | +5.7% |
| 1998-02 | +5.9% | +6.9% | +6.1% | +5.3% | +4.3% |
| 1998-03 | +4.8% | +5.6% | +5.2% | +4.0% | +2.8% |
| 1998-04 | +2.6% | +3.2% | +3.3% | +1.8% | +0.7% |
| 1998-05 | +2.9% | +3.4% | +3.3% | +2.3% | +0.9% |
| 1998-06 | +4.0% | +4.2% | +4.3% | +3.5% | +3.5% |
| 1998-07 | +5.1% | +5.2% | +5.4% | +4.5% | +5.2% |
| 1998-08 | +5.3% | +5.5% | +5.5% | +4.6% | +5.5% |
| 1998-09 | +6.3% | +6.9% | +6.5% | +5.8% | +6.1% |
| 1998-10 | +7.3% | +7.9% | +7.3% | +6.9% | +7.2% |
| 1998-11 | +7.0% | +7.6% | +7.1% | +6.4% | +7.4% |
| 1998-12 | +4.9% | +5.2% | +5.0% | +4.4% | +5.9% |
| 1999-01 | +3.0% | +2.9% | +3.2% | +2.4% | +4.1% |
| 1999-02 | +5.0% | +5.0% | +5.2% | +4.5% | +5.4% |
| 1999-03 | +7.1% | +7.4% | +7.3% | +6.4% | +7.7% |
| 1999-04 | +8.2% | +8.6% | +8.2% | +7.8% | +8.9% |
| 1999-05 | +8.0% | +8.3% | +8.0% | +7.5% | +9.2% |
| 1999-06 | +5.9% | +6.2% | +5.9% | +5.6% | +6.4% |
| 1999-07 | +6.3% | +6.9% | +6.2% | +5.9% | +6.6% |
| 1999-08 | +7.3% | +7.6% | +7.2% | +7.2% | +7.6% |
| 1999-09 | +7.2% | +7.6% | +7.0% | +7.0% | +8.0% |
| 1999-10 | +7.1% | +7.4% | +7.1% | +6.8% | +8.1% |
| 1999-11 | +7.2% | +7.5% | +7.1% | +7.0% | +8.1% |
| 1999-12 | +11.3% | +11.5% | +11.1% | +11.1% | +12.1% |
| 2000-01 | +11.8% | +12.2% | +11.6% | +11.6% | +11.9% |
| 2000-02 | +12.6% | +13.2% | +12.4% | +12.4% | +12.7% |
| 2000-03 | +12.6% | +13.2% | +12.5% | +12.3% | +11.9% |
| 2000-04 | +14.5% | +15.2% | +14.4% | +14.0% | +14.5% |
| 2000-05 | +14.3% | +15.2% | +14.3% | +13.3% | +14.7% |
| 2000-06 | +15.0% | +15.7% | +15.2% | +13.7% | +16.3% |
| 2000-07 | +14.3% | +15.3% | +14.7% | +12.8% | +15.2% |
| 2000-08 | +14.8% | +15.9% | +15.5% | +12.7% | +16.4% |
| 2000-09 | +16.9% | +18.4% | +17.5% | +14.5% | +18.5% |
| 2000-10 | +17.4% | +18.9% | +18.1% | +15.0% | +18.9% |
| 2000-11 | +17.8% | +19.6% | +18.3% | +15.7% | +19.2% |
| 2000-12 | +15.5% | +17.2% | +15.9% | +13.2% | +17.0% |
| 2001-01 | +16.0% | +17.3% | +16.3% | +13.9% | +18.6% |
| 2001-02 | +14.0% | +14.8% | +14.4% | +12.2% | +16.5% |
| 2001-03 | +12.5% | +13.2% | +12.9% | +11.0% | +15.1% |
| 2001-04 | +10.7% | +11.5% | +11.0% | +9.3% | +12.4% |
| 2001-05 | +11.0% | +11.7% | +11.1% | +10.1% | +12.4% |
| 2001-06 | +11.5% | +12.0% | +11.4% | +10.8% | +13.0% |
| 2001-07 | +12.2% | +12.3% | +12.1% | +11.7% | +14.3% |
| 2001-08 | +12.6% | +12.7% | +12.3% | +12.5% | +14.7% |
| 2001-09 | +10.7% | +10.5% | +10.3% | +10.9% | +12.9% |
| 2001-10 | +11.7% | +11.2% | +11.1% | +12.2% | +13.6% |
| 2001-11 | +11.4% | +10.5% | +11.1% | +11.6% | +13.5% |
| 2001-12 | +13.0% | +11.9% | +12.9% | +13.0% | +15.4% |
| 2002-01 | +13.1% | +12.1% | +13.1% | +12.6% | +15.6% |
| 2002-02 | +14.5% | +13.7% | +14.4% | +14.1% | +17.6% |
| 2002-03 | +15.2% | +14.4% | +15.0% | +15.0% | +18.6% |
| 2002-04 | +16.2% | +15.0% | +16.0% | +15.8% | +20.5% |
| 2002-05 | +16.6% | +15.4% | +16.6% | +16.0% | +21.0% |
| 2002-06 | +17.6% | +16.6% | +17.6% | +17.0% | +21.8% |
| 2002-07 | +18.0% | +17.0% | +17.9% | +17.7% | +21.4% |
| 2002-08 | +18.8% | +17.3% | +18.7% | +18.6% | +22.0% |
| 2002-09 | +20.1% | +18.2% | +20.5% | +19.9% | +22.6% |
| 2002-10 | +19.5% | +17.5% | +20.1% | +19.0% | +21.8% |
| 2002-11 | +19.5% | +17.9% | +19.8% | +19.2% | +21.5% |
| 2002-12 | +18.4% | +17.1% | +18.6% | +18.4% | +19.6% |
| 2003-01 | +20.5% | +19.1% | +20.3% | +21.1% | +21.3% |
| 2003-02 | +21.0% | +19.1% | +21.3% | +21.5% | +21.6% |
| 2003-03 | +22.1% | +20.2% | +22.3% | +22.4% | +23.5% |
| 2003-04 | +21.8% | +19.9% | +22.4% | +21.5% | +22.8% |
| 2003-05 | +22.6% | +21.0% | +23.1% | +22.5% | +23.4% |
| 2003-06 | +22.7% | +20.7% | +23.2% | +22.7% | +23.3% |
| 2003-07 | +22.7% | +20.0% | +23.2% | +23.0% | +23.7% |
| 2003-08 | +21.2% | +18.1% | +21.7% | +21.8% | +22.2% |
| 2003-09 | +20.2% | +16.9% | +20.6% | +21.2% | +21.1% |
| 2003-10 | +20.0% | +16.7% | +20.0% | +21.5% | +20.7% |
| 2003-11 | +20.9% | +17.2% | +21.0% | +22.6% | +21.5% |
| 2003-12 | +22.5% | +18.1% | +22.3% | +24.7% | +23.4% |
| 2004-01 | +21.1% | +16.8% | +21.0% | +23.1% | +21.8% |
| 2004-02 | +22.3% | +18.2% | +21.8% | +24.8% | +23.1% |
| 2004-03 | +20.1% | +16.2% | +19.6% | +22.8% | +20.4% |
| 2004-04 | +20.6% | +16.2% | +19.8% | +24.4% | +20.4% |
| 2004-05 | +18.7% | +13.2% | +17.7% | +23.2% | +18.9% |
| 2004-06 | +20.5% | +14.6% | +19.5% | +25.2% | +20.5% |
| 2004-07 | +20.5% | +14.6% | +19.6% | +25.1% | +20.8% |
| 2004-08 | +22.1% | +16.8% | +21.2% | +26.4% | +22.1% |
| 2004-09 | +22.4% | +17.5% | +21.4% | +26.6% | +22.9% |
| 2004-10 | +22.9% | +18.3% | +21.8% | +26.8% | +23.9% |
| 2004-11 | +21.0% | +16.6% | +19.9% | +24.9% | +22.5% |
| 2004-12 | +18.7% | +14.9% | +17.5% | +22.3% | +19.9% |
| 2005-01 | +18.5% | +15.0% | +17.3% | +22.1% | +19.7% |
| 2005-02 | +16.9% | +13.9% | +16.0% | +19.9% | +17.6% |
| 2005-03 | +17.1% | +13.8% | +16.3% | +19.7% | +17.6% |
| 2005-04 | +13.6% | +10.9% | +13.0% | +15.7% | +14.0% |
| 2005-05 | +12.0% | +10.1% | +11.3% | +13.7% | +12.4% |
| 2005-06 | +9.6% | +7.9% | +8.8% | +11.3% | +9.7% |
| 2005-07 | +8.9% | +7.6% | +8.1% | +10.4% | +9.0% |
| 2005-08 | +8.2% | +6.6% | +7.4% | +10.1% | +8.4% |
| 2005-09 | +6.3% | +4.9% | +5.5% | +8.2% | +6.6% |
| 2005-10 | +5.0% | +3.3% | +4.0% | +7.0% | +4.9% |
| 2005-11 | +4.1% | +2.5% | +3.3% | +6.1% | +3.9% |
| 2005-12 | +4.2% | +2.4% | +3.4% | +6.1% | +4.1% |
| 2006-01 | +3.1% | +1.3% | +2.5% | +4.9% | +2.7% |
| 2006-02 | +3.0% | +1.0% | +2.2% | +5.1% | +3.0% |
| 2006-03 | +3.2% | +1.4% | +2.4% | +5.2% | +2.9% |
| 2006-04 | +5.7% | +4.0% | +4.8% | +7.8% | +5.5% |
| 2006-05 | +6.0% | +4.6% | +5.4% | +7.7% | +5.4% |
| 2006-06 | +5.8% | +4.8% | +5.3% | +7.3% | +5.1% |
| 2006-07 | +4.4% | +3.5% | +3.9% | +6.0% | +3.4% |
| 2006-08 | +3.4% | +2.6% | +2.9% | +5.0% | +2.0% |
| 2006-09 | +4.3% | +3.5% | +3.9% | +5.7% | +2.6% |
| 2006-10 | +5.0% | +4.4% | +4.9% | +6.0% | +3.4% |
| 2006-11 | +6.0% | +5.6% | +5.9% | +7.0% | +4.1% |
| 2006-12 | +5.9% | +5.6% | +5.8% | +7.0% | +3.7% |
| 2007-01 | +6.9% | +6.5% | +6.8% | +8.0% | +4.8% |
| 2007-02 | +6.6% | +6.5% | +6.5% | +7.4% | +4.7% |
| 2007-03 | +7.2% | +7.1% | +7.1% | +8.1% | +5.6% |
| 2007-04 | +5.7% | +5.7% | +5.5% | +6.6% | +4.1% |
| 2007-05 | +7.0% | +6.6% | +6.6% | +8.3% | +5.8% |
| 2007-06 | +7.2% | +6.8% | +6.7% | +8.4% | +6.1% |
| 2007-07 | +8.3% | +8.2% | +7.8% | +9.3% | +7.4% |
| 2007-08 | +7.6% | +7.8% | +7.2% | +8.4% | +6.5% |
| 2007-09 | +7.0% | +7.2% | +6.6% | +7.8% | +6.3% |
| 2007-10 | +7.0% | +7.4% | +6.5% | +7.8% | +6.4% |
| 2007-11 | +6.9% | +7.4% | +6.3% | +7.5% | +6.9% |
| 2007-12 | +7.1% | +7.8% | +6.5% | +7.4% | +6.9% |
| 2008-01 | +5.0% | +5.9% | +4.5% | +5.2% | +5.0% |
| 2008-02 | +5.5% | +6.6% | +5.2% | +5.7% | +4.7% |
| 2008-03 | +4.3% | +5.5% | +4.0% | +4.5% | +3.1% |
| 2008-04 | +3.4% | +5.1% | +3.2% | +3.4% | +1.5% |
| 2008-05 | +1.8% | +3.8% | +1.8% | +1.6% | -0.4% |
| 2008-06 | -1.2% | +0.7% | -1.2% | -1.6% | -3.4% |
| 2008-07 | -2.7% | -1.2% | -2.5% | -3.2% | -4.6% |
| 2008-08 | -5.8% | -4.5% | -5.6% | -6.4% | -6.7% |
| 2008-09 | -6.8% | -5.0% | -6.7% | -7.5% | -7.6% |
| 2008-10 | -8.4% | -6.7% | -8.3% | -9.0% | -9.3% |
| 2008-11 | -10.2% | -8.5% | -10.0% | -10.8% | -11.5% |
| 2008-12 | -12.3% | -11.0% | -12.2% | -12.8% | -13.8% |
| 2009-01 | -13.2% | -11.8% | -13.1% | -13.7% | -14.4% |
| 2009-02 | -15.1% | -14.0% | -15.0% | -15.6% | -15.8% |
| 2009-03 | -15.3% | -14.4% | -15.3% | -15.9% | -14.8% |
| 2009-04 | -14.6% | -14.3% | -14.4% | -15.1% | -14.0% |
| 2009-05 | -13.9% | -13.8% | -13.6% | -14.2% | -13.5% |
| 2009-06 | -12.8% | -12.7% | -12.5% | -13.0% | -13.4% |
| 2009-07 | -11.9% | -11.7% | -11.6% | -11.7% | -13.1% |
| 2009-08 | -9.0% | -8.6% | -8.7% | -8.9% | -11.0% |
| 2009-09 | -6.6% | -6.8% | -6.1% | -6.4% | -9.0% |
| 2009-10 | -5.4% | -5.6% | -4.7% | -5.2% | -8.3% |
| 2009-11 | -1.9% | -2.3% | -1.3% | -1.2% | -5.0% |
| 2009-12 | +1.2% | +0.9% | +1.8% | +2.1% | -2.3% |
| 2010-01 | +3.1% | +2.8% | +4.0% | +3.8% | -1.4% |
| 2010-02 | +3.8% | +3.7% | +5.0% | +4.2% | -1.8% |
| 2010-03 | +4.1% | +4.9% | +5.3% | +4.1% | -2.5% |
| 2010-04 | +4.2% | +5.2% | +5.2% | +4.2% | -1.9% |
| 2010-05 | +4.9% | +6.2% | +5.7% | +4.7% | -0.2% |
| 2010-06 | +4.7% | +5.8% | +5.4% | +4.6% | +0.2% |
| 2010-07 | +5.0% | +6.4% | +5.5% | +4.7% | +0.6% |
| 2010-08 | +3.9% | +5.1% | +4.5% | +3.4% | -0.4% |
| 2010-09 | +2.5% | +4.1% | +3.1% | +1.8% | -1.8% |
| 2010-10 | +1.4% | +2.9% | +2.1% | +0.7% | -2.3% |
| 2010-11 | +0.5% | +2.2% | +1.1% | -0.5% | -3.0% |
| 2010-12 | +0.2% | +2.2% | +0.9% | -1.3% | -2.9% |
| 2011-01 | +0.2% | +2.2% | +0.6% | -1.3% | -2.2% |
| 2011-02 | -1.4% | +1.0% | -1.4% | -2.7% | -2.9% |
| 2011-03 | -1.7% | +0.3% | -1.9% | -2.6% | -2.9% |
| 2011-04 | -0.8% | +1.4% | -1.0% | -1.8% | -2.2% |
| 2011-05 | -1.3% | +0.3% | -1.2% | -2.3% | -2.6% |
| 2011-06 | -1.0% | +0.1% | -0.8% | -2.0% | -1.8% |
| 2011-07 | -2.5% | -2.0% | -2.1% | -3.4% | -2.5% |
| 2011-08 | -2.4% | -2.0% | -2.1% | -3.0% | -2.6% |
| 2011-09 | -1.9% | -1.6% | -1.7% | -2.4% | -2.4% |
| 2011-10 | -1.0% | -0.4% | -0.7% | -1.5% | -2.1% |
| 2011-11 | -1.8% | -1.3% | -1.5% | -2.4% | -2.4% |
| 2011-12 | -2.6% | -2.4% | -2.3% | -3.1% | -3.0% |
| 2012-01 | -2.4% | -2.9% | -2.0% | -2.4% | -3.0% |
| 2012-02 | +2.1% | +1.0% | +2.7% | +2.6% | +0.7% |
| 2012-03 | +1.8% | -0.2% | +2.4% | +2.9% | +0.3% |
| 2012-04 | +1.2% | -0.6% | +1.7% | +2.0% | +0.2% |
| 2012-05 | -1.0% | -2.4% | -0.6% | -0.3% | -2.1% |
| 2012-06 | -0.1% | -0.7% | +0.1% | +0.4% | -1.5% |
| 2012-07 | +1.1% | +0.7% | +1.1% | +1.9% | -0.7% |
| 2012-08 | +1.3% | +0.7% | +1.3% | +2.5% | -0.1% |
| 2012-09 | +1.7% | +0.9% | +1.7% | +2.7% | +0.5% |
| 2012-10 | +2.3% | +1.1% | +2.2% | +3.5% | +1.7% |
| 2012-11 | +3.0% | +1.8% | +3.0% | +4.2% | +1.9% |
| 2012-12 | +2.6% | +1.9% | +2.5% | +3.8% | +1.0% |
| 2013-01 | +1.5% | +1.4% | +1.6% | +2.3% | -0.3% |
| 2013-02 | -0.1% | 0.0% | 0.0% | +0.2% | -1.3% |
| 2013-03 | 0.0% | +0.6% | +0.1% | -0.3% | -1.1% |
| 2013-04 | +0.2% | +0.8% | +0.3% | +0.3% | -1.3% |
| 2013-05 | +1.4% | +1.9% | +1.4% | +1.4% | -0.4% |
| 2013-06 | +2.6% | +2.7% | +2.7% | +2.8% | +0.8% |
| 2013-07 | +3.4% | +3.5% | +3.6% | +3.5% | +2.1% |
| 2013-08 | +3.6% | +3.8% | +3.9% | +3.5% | +2.6% |
| 2013-09 | +3.8% | +4.0% | +4.0% | +3.6% | +2.9% |
| 2013-10 | +3.0% | +3.6% | +3.3% | +2.6% | +1.9% |
| 2013-11 | +3.1% | +3.6% | +3.4% | +2.6% | +1.9% |
| 2013-12 | +3.1% | +3.1% | +3.5% | +2.7% | +2.4% |
| 2014-01 | +4.2% | +3.8% | +4.4% | +4.2% | +4.1% |
| 2014-02 | +4.4% | +3.9% | +4.6% | +4.7% | +4.4% |
| 2014-03 | +6.0% | +5.4% | +6.2% | +6.5% | +5.5% |
| 2014-04 | +6.3% | +5.5% | +6.5% | +6.7% | +5.5% |
| 2014-05 | +7.8% | +6.8% | +8.0% | +8.4% | +6.9% |
| 2014-06 | +7.2% | +6.6% | +7.4% | +7.7% | +6.3% |
| 2014-07 | +6.9% | +6.3% | +7.1% | +7.3% | +5.6% |
| 2014-08 | +7.7% | +7.4% | +8.0% | +8.1% | +6.3% |
| 2014-09 | +7.3% | +6.7% | +7.6% | +8.0% | +6.1% |
| 2014-10 | +7.0% | +6.1% | +7.2% | +7.8% | +6.3% |
| 2014-11 | +5.4% | +4.6% | +5.6% | +6.2% | +4.9% |
| 2014-12 | +5.3% | +5.2% | +5.3% | +5.8% | +4.6% |
| 2015-01 | +7.6% | +7.7% | +7.6% | +7.8% | +6.6% |
| 2015-02 | +7.6% | +7.6% | +7.6% | +7.8% | +7.0% |
| 2015-03 | +7.3% | +7.3% | +7.4% | +7.2% | +7.1% |
| 2015-04 | +6.0% | +6.3% | +6.0% | +5.7% | +5.8% |
| 2015-05 | +4.9% | +5.5% | +5.1% | +4.3% | +4.4% |
| 2015-06 | +5.3% | +5.8% | +5.6% | +5.0% | +4.3% |
| 2015-07 | +4.6% | +4.9% | +4.9% | +4.2% | +3.8% |
| 2015-08 | +4.7% | +4.9% | +4.9% | +4.4% | +3.9% |
| 2015-09 | +4.2% | +4.7% | +4.4% | +3.7% | +3.7% |
| 2015-10 | +5.1% | +5.9% | +5.3% | +4.6% | +4.1% |
| 2015-11 | +7.0% | +7.8% | +7.2% | +6.4% | +5.8% |
| 2015-12 | +7.3% | +7.8% | +7.7% | +7.0% | +5.8% |
| 2016-01 | +6.2% | +6.5% | +6.7% | +5.9% | +4.7% |
| 2016-02 | +5.6% | +6.1% | +6.2% | +5.3% | +3.6% |
| 2016-03 | +5.6% | +6.1% | +6.0% | +5.3% | +3.8% |
| 2016-04 | +6.3% | +6.5% | +6.7% | +6.2% | +4.7% |
| 2016-05 | +8.0% | +7.8% | +8.1% | +8.3% | +7.3% |
| 2016-06 | +7.9% | +7.4% | +8.0% | +8.2% | +8.0% |
| 2016-07 | +8.7% | +8.5% | +8.6% | +9.0% | +9.1% |
| 2016-08 | +8.8% | +8.8% | +8.7% | +8.8% | +9.3% |
| 2016-09 | +9.8% | +9.5% | +9.9% | +9.9% | +9.9% |
| 2016-10 | +8.8% | +8.4% | +9.0% | +8.5% | +9.7% |
| 2016-11 | +7.3% | +7.3% | +7.4% | +6.8% | +8.3% |
| 2016-12 | +6.7% | +7.0% | +6.7% | +6.0% | +8.3% |
| 2017-01 | +5.8% | +6.4% | +5.6% | +5.1% | +7.2% |
| 2017-02 | +5.8% | +6.1% | +5.5% | +5.3% | +8.1% |
| 2017-03 | +5.8% | +5.8% | +5.4% | +5.3% | +8.1% |
| 2017-04 | +7.6% | +7.7% | +7.2% | +7.0% | +10.3% |
| 2017-05 | +6.9% | +7.4% | +6.8% | +6.0% | +8.9% |
| 2017-06 | +6.9% | +7.4% | +6.8% | +5.9% | +9.0% |
| 2017-07 | +5.9% | +6.0% | +6.0% | +4.9% | +7.9% |
| 2017-08 | +5.0% | +4.9% | +5.0% | +4.4% | +7.0% |
| 2017-09 | +4.2% | +4.4% | +4.1% | +3.7% | +6.0% |
| 2017-10 | +3.8% | +3.9% | +3.6% | +3.6% | +4.6% |
| 2017-11 | +5.2% | +5.0% | +5.1% | +5.2% | +5.7% |
| 2017-12 | +6.0% | +5.4% | +6.1% | +6.2% | +6.2% |
| 2018-01 | +7.4% | +6.6% | +7.6% | +7.5% | +7.8% |
| 2018-02 | +7.3% | +7.0% | +7.6% | +7.2% | +6.7% |
| 2018-03 | +7.5% | +7.2% | +7.9% | +7.5% | +6.3% |
| 2018-04 | +5.4% | +5.1% | +6.0% | +5.7% | +3.4% |
| 2018-05 | +5.1% | +4.8% | +5.6% | +5.5% | +2.7% |
| 2018-06 | +4.0% | +4.1% | +4.6% | +4.1% | +1.3% |
| 2018-07 | +5.4% | +6.1% | +5.9% | +5.3% | +2.6% |
| 2018-08 | +5.4% | +6.2% | +6.0% | +5.0% | +2.7% |
| 2018-09 | +6.7% | +7.4% | +7.3% | +6.6% | +4.1% |
| 2018-10 | +7.8% | +8.3% | +8.4% | +7.7% | +5.5% |
| 2018-11 | +7.2% | +7.7% | +7.7% | +7.2% | +5.0% |
| 2018-12 | +7.0% | +7.6% | +7.4% | +6.8% | +5.0% |
| 2019-01 | +5.1% | +5.9% | +5.5% | +4.9% | +3.0% |
| 2019-02 | +4.9% | +5.6% | +5.3% | +4.6% | +3.2% |
| 2019-03 | +3.3% | +4.0% | +3.7% | +2.8% | +1.5% |
| 2019-04 | +3.9% | +4.4% | +4.3% | +3.4% | +2.5% |
| 2019-05 | +3.7% | +4.1% | +4.1% | +3.3% | +2.3% |
| 2019-06 | +4.3% | +4.6% | +4.6% | +4.1% | +3.0% |
| 2019-07 | +2.8% | +2.9% | +3.2% | +2.8% | +1.7% |
| 2019-08 | +2.4% | +2.3% | +2.7% | +2.7% | +1.2% |
| 2019-09 | +1.6% | +1.4% | +1.7% | +1.9% | +0.7% |
| 2019-10 | +1.7% | +1.4% | +1.9% | +1.9% | +0.6% |
| 2019-11 | +2.6% | +2.3% | +3.1% | +2.7% | +1.5% |
| 2019-12 | +2.7% | +2.5% | +3.3% | +2.8% | +1.0% |
| 2020-01 | +3.6% | +3.4% | +4.1% | +4.0% | +1.8% |
| 2020-02 | +3.8% | +3.5% | +4.2% | +4.3% | +1.7% |
| 2020-03 | +4.5% | +4.2% | +4.8% | +5.0% | +2.6% |
| 2020-04 | +4.2% | +4.6% | +4.5% | +4.5% | +1.8% |
| 2020-05 | +3.1% | +3.9% | +3.3% | +2.9% | +1.0% |
| 2020-06 | +2.7% | +3.6% | +3.0% | +2.5% | +0.3% |
| 2020-07 | +3.3% | +3.8% | +3.7% | +3.1% | +1.4% |
| 2020-08 | +5.0% | +5.4% | +5.5% | +4.8% | +2.5% |
| 2020-09 | +5.9% | +6.7% | +6.6% | +5.4% | +3.0% |
| 2020-10 | +6.5% | +7.6% | +7.0% | +6.2% | +3.1% |
| 2020-11 | +6.6% | +7.6% | +6.9% | +6.7% | +3.5% |
| 2020-12 | +7.7% | +8.7% | +7.7% | +8.0% | +4.8% |
| 2021-01 | +8.0% | +8.1% | +8.0% | +8.5% | +6.4% |
| 2021-02 | +7.9% | +7.1% | +7.9% | +8.7% | +7.6% |
| 2021-03 | +8.7% | +6.9% | +8.5% | +9.9% | +9.9% |
| 2021-04 | +8.6% | +6.4% | +8.3% | +9.9% | +10.7% |
| 2021-05 | +8.6% | +6.5% | +8.1% | +10.1% | +10.3% |
| 2021-06 | +10.0% | +7.9% | +9.2% | +11.9% | +11.9% |
| 2021-07 | +8.3% | +7.0% | +7.5% | +9.9% | +9.3% |
| 2021-08 | +7.4% | +6.4% | +6.8% | +8.8% | +8.4% |
| 2021-09 | +5.4% | +4.4% | +4.9% | +6.5% | +6.2% |
| 2021-10 | +6.5% | +5.8% | +6.2% | +7.4% | +7.1% |
| 2021-11 | +7.1% | +6.6% | +7.0% | +7.7% | +7.5% |
| 2021-12 | +6.9% | +6.9% | +7.0% | +7.1% | +6.7% |
| 2022-01 | +7.8% | +7.9% | +7.9% | +8.0% | +6.3% |
| 2022-02 | +8.8% | +9.7% | +9.1% | +8.8% | +6.4% |
| 2022-03 | +9.1% | +10.9% | +9.6% | +8.6% | +5.2% |
| 2022-04 | +9.9% | +11.6% | +10.5% | +9.4% | +5.9% |
| 2022-05 | +10.2% | +11.5% | +10.9% | +10.0% | +6.0% |
| 2022-06 | +10.0% | +11.3% | +10.9% | +9.6% | +6.1% |
| 2022-07 | +12.2% | +12.9% | +13.1% | +12.0% | +8.0% |
| 2022-08 | +14.3% | +14.5% | +15.1% | +14.6% | +10.5% |
| 2022-09 | +15.5% | +15.3% | +16.1% | +16.2% | +11.6% |
| 2022-10 | +14.8% | +14.2% | +15.2% | +15.8% | +11.7% |
| 2022-11 | +12.1% | +11.6% | +12.4% | +13.2% | +9.1% |
| 2022-12 | +10.7% | +9.6% | +10.8% | +11.9% | +8.6% |
| 2023-01 | +8.3% | +7.8% | +8.5% | +9.1% | +6.3% |
| 2023-02 | +7.3% | +7.2% | +7.6% | +7.7% | +5.2% |
| 2023-03 | +5.8% | +6.0% | +6.0% | +5.8% | +3.6% |
| 2023-04 | +3.0% | +3.5% | +3.3% | +2.6% | +1.0% |
| 2023-05 | +2.2% | +2.7% | +2.6% | +1.6% | +0.9% |
| 2023-06 | +0.3% | +0.8% | +0.7% | -0.1% | -1.2% |
| 2023-07 | +0.6% | +0.9% | +0.8% | +0.2% | -0.8% |
| 2023-08 | -1.8% | -1.3% | -1.6% | -2.1% | -3.4% |
| 2023-09 | -2.0% | -1.6% | -1.7% | -2.3% | -3.1% |
| 2023-10 | -3.5% | -3.4% | -3.3% | -3.7% | -4.3% |
| 2023-11 | -2.9% | -3.0% | -2.7% | -3.2% | -3.3% |
| 2023-12 | -2.6% | -2.8% | -2.3% | -2.9% | -3.1% |
| 2024-01 | -1.1% | -1.3% | -1.0% | -1.4% | -1.5% |
| 2024-02 | -1.6% | -2.3% | -1.6% | -1.3% | -2.0% |
| 2024-03 | -0.5% | -1.6% | -0.7% | +0.3% | -0.1% |
| 2024-04 | +0.4% | -1.1% | +0.2% | +1.6% | +1.0% |
| 2024-05 | +2.2% | +0.6% | +1.9% | +3.4% | +2.8% |
| 2024-06 | +3.4% | +1.9% | +3.3% | +4.6% | +3.9% |
| 2024-07 | +2.0% | +0.7% | +1.8% | +3.2% | +2.2% |
| 2024-08 | +2.5% | +1.2% | +2.3% | +3.6% | +2.7% |
| 2024-09 | +2.0% | +1.2% | +1.9% | +2.9% | +1.8% |
| 2024-10 | +3.5% | +3.2% | +3.4% | +4.2% | +3.3% |
| 2024-11 | +3.9% | +3.8% | +3.9% | +4.6% | +3.1% |
| 2024-12 | +4.5% | +4.6% | +4.4% | +5.3% | +3.3% |
| 2025-01 | +3.0% | +3.0% | +3.1% | +3.8% | +1.3% |
| 2025-02 | +2.8% | +3.1% | +2.8% | +3.4% | +1.1% |
| 2025-03 | +2.7% | +2.2% | +2.7% | +3.6% | +1.6% |
| 2025-04 | +4.7% | +5.1% | +4.9% | +5.1% | +2.9% |
| 2025-05 | +4.4% | +5.2% | +4.6% | +4.7% | +1.7% |
| 2025-06 | +3.6% | +5.3% | +4.2% | +3.4% | -0.1% |
| 2025-07 | +3.8% | +4.9% | +4.3% | +3.9% | +0.5% |
| 2025-08 | +4.4% | +5.2% | +5.1% | +4.2% | +1.3% |
| 2025-09 | +4.3% | +4.8% | +4.9% | +4.3% | +1.3% |
| 2025-10 | +2.9% | +3.0% | +3.7% | +3.1% | -0.3% |
| 2025-11 | +2.1% | +2.1% | +2.7% | +2.7% | -0.7% |
| 2025-12 | +2.1% | +1.7% | +2.6% | +2.8% | -0.5% |
| 2026-01 | +3.7% | +3.0% | +4.2% | +4.8% | +1.4% |
| 2026-02 | +5.1% | +4.4% | +5.8% | +5.9% | +2.3% |
| 2026-03 | +5.3% | +5.6% | +6.3% | +5.8% | +0.7% |
Sold House Prices in Stockport
The average sold price across all property types in Stockport is £313,101, which is 8.0% above the England average of £289,946 as of March 2026. That premium is rare for the North West, but it is not spread evenly. Detached and semi-detached houses sit well above England, terraced stock is roughly level, and flats trade at a clear discount. The pattern tells you what Stockport is: a borough whose value sits in family houses, not apartments.
| Property Type | Stockport Average | England Average | Difference |
|---|---|---|---|
| Detached houses | £547,093 | £470,492 | +16.3% |
| Semi-detached houses | £343,089 | £288,185 | +19.1% |
| Terraced houses | £250,051 | £243,788 | +2.6% |
| Flats and maisonettes | £172,398 | £214,563 | -19.7% |
| All property types | £313,101 | £289,946 | +8.0% |
Detached houses at £547,093 carry a 16.3% premium over England's £470,492. This is the most expensive corner of the Stockport market, concentrated in the southern suburbs of SK7 Bramhall, SK12 Poynton and WA15 Hale, where the borough competes with Cheshire villages for family buyers. Annual growth of 5.6% shows steady demand at the top of the market.
Semi-detached houses at £343,089 carry the widest premium of any type, 19.1% above England's £288,185. This is the backbone of Stockport's housing and its strongest performer, with 6.3% annual growth. Semi-detached stock dominates the established suburbs from Heaton Moor and Heaton Mersey in SK4 to Cheadle in SK8, the homes that draw the bulk of family rental demand.
Terraced houses at £250,051 sit almost exactly level with England, a 2.6% premium over £243,788. This is the one property type where Stockport prices align with the national market, and the terraced stock is concentrated in the cheaper northern and town-centre postcodes of SK1, SK3 Edgeley and SK5 Reddish. Annual growth of 5.8% puts terraces among the borough's stronger performers.
Flats and maisonettes at £172,398 show the only discount to England, 19.7% below £214,563. Stockport is not a flat-heavy borough outside the town centre, and the smaller pool of apartment stock means flat prices reflect local demand rather than the institutional premium that lifts flat values in central Manchester. Annual change of 0.7% confirms a flat, slow-moving segment.
Price Per Square Foot in Stockport
Stockport's cheapest space costs £262 per square foot in SK1 and its dearest £449 in WA15 Hale, a 71% spread across eleven postcodes. Measuring by the square foot strips out how big the homes are and isolates what each location itself commands, so it is a cleaner read on the borough's internal pecking order than headline asking prices.
| Rank | Area | Price Per Sq Ft |
|---|---|---|
| 1 | SK1 (Town Centre) | £262 |
| 2 | SK5 (Reddish, Brinnington) | £271 |
| 3 | M19 (Levenshulme, Burnage) | £301 |
| 4 | SK3 (Edgeley, Davenport) | £303 |
| 5 | SK2 (Offerton) | £306 |
| 6 | SK6 (Marple, Bredbury) | £330 |
| 7 | SK4 (Heaton Moor, Heaton Mersey) | £359 |
| 8 | SK8 (Cheadle, Cheadle Hulme) | £366 |
| 9 | SK7 (Bramhall, Hazel Grove) | £375 |
| 10 | SK12 (Poynton, Disley) | £396 |
| 11 | WA15 (Hale, Timperley) | £449 |
SK1 at £262 per square foot is the cheapest space in Stockport, covering the town centre's terraces and flats. With the MDC regeneration adding new homes on the doorstep, SK1 is the postcode most exposed to a rerating as the western side of the centre fills in. SK5 Reddish follows at £271, keeping the two northern town-centre postcodes as the value end of the borough.
WA15 Hale tops the table at £449 per square foot, nearly double SK1's rate, and operates in effectively a different market. Hale is one of Greater Manchester's most prestigious addresses, and the per-foot premium is paid for affluent owner-occupier demand rather than rental economics, which is exactly why the yield data later in this guide puts WA15 near the bottom.
For Sale Asking Prices in Stockport
SK1 at £205,216 and WA15 at £638,191 sit £432,975 apart, the widest asking-price gap of any Greater Manchester borough we cover. That hierarchy follows the sold-price and per-foot data, but the spread is more extreme. The mean asking price across all eleven Stockport postcodes is £374,681.
| Rank | Area | Asking Price |
|---|---|---|
| 1 | SK1 (Town Centre) | £205,216 |
| 2 | SK5 (Reddish, Brinnington) | £234,784 |
| 3 | SK3 (Edgeley, Davenport) | £268,395 |
| 4 | SK2 (Offerton) | £296,376 |
| 5 | M19 (Levenshulme, Burnage) | £323,158 |
| 6 | SK4 (Heaton Moor, Heaton Mersey) | £373,882 |
| 7 | SK6 (Marple, Bredbury) | £390,451 |
| 8 | SK8 (Cheadle, Cheadle Hulme) | £420,263 |
| 9 | SK12 (Poynton, Disley) | £485,162 |
| 10 | SK7 (Bramhall, Hazel Grove) | £485,609 |
| 11 | WA15 (Hale, Timperley) | £638,191 |
SK1 at £205,216 is the cheapest postcode by a clear margin, almost £30,000 below second-placed SK5 and more than £100,000 under the borough's £313,101 Land Registry sold average. Four of the eleven postcodes sit below that sold average (SK1, SK5, SK3 and SK2), but SK1 is the only one to start with a one in front, and for an investor on a fixed budget the town centre offers the most property for the money and the lowest barrier to getting into the borough at all.
WA15 at £638,191 is an outlier in a Greater Manchester context. To put it in perspective, neighbouring Manchester's mean asking price across its postcodes is £268,032, so Stockport's dearest postcode costs more than twice the Manchester average. WA15 Hale is premium owner-occupier territory, and the rental yield data below confirms that the price is doing more for prestige than for income.
House Price Growth in Stockport
Every Stockport postcode posted positive five-year growth, led by SK1 at 36.1%. SK7 was negative over both one and three years; every other postcode was positive over both periods. The five-year column is universally green, a reminder that the whole borough rode the post-pandemic wave. The story is in the shorter windows, where the cheaper northern postcodes have kept climbing while the premium southern ones have flattened.
| Area | 1 Year | 3 Years | 5 Years |
|---|---|---|---|
| SK1 (Town Centre) | 11.9% | 11.8% | 36.1% |
| SK5 (Reddish, Brinnington) | 2.7% | 5.2% | 32.4% |
| SK3 (Edgeley, Davenport) | 4.8% | 10.2% | 29.8% |
| M19 (Levenshulme, Burnage) | 0.6% | 9.0% | 29.3% |
| SK2 (Offerton) | 9.0% | 11.2% | 26.1% |
| SK12 (Poynton, Disley) | 0.8% | 9.3% | 21.7% |
| SK7 (Bramhall, Hazel Grove) | -0.8% | -2.3% | 19.1% |
| SK6 (Marple, Bredbury) | 3.6% | 7.1% | 19.0% |
| SK8 (Cheadle, Cheadle Hulme) | 2.8% | 2.8% | 16.7% |
| WA15 (Hale, Timperley) | 4.9% | 3.0% | 16.1% |
| SK4 (Heaton Moor, Heaton Mersey) | 5.0% | 5.3% | 15.8% |
SK1 at 36.1% five-year growth leads the borough and pairs that with the strongest recent run, up 11.9% over one year and 11.8% over three. The town centre has gone from the cheapest postcode to the fastest-growing, and the timing lines up with the MDC regeneration starting to land. SK5 Reddish is close behind on the five-year figure at 32.4%, keeping the northern postcodes ahead on growth as well as on value.
SK7 Bramhall has negative one-year (-0.8%) and three-year (-2.3%) readings, despite a 19.1% five-year return. All ten other postcodes are positive over both shorter periods. The premium southern suburb ran hard through the pandemic and has since given a little back, a pattern that fits its high prices and owner-occupier base. WA15 Hale tells a similar story, with a softer 16.1% over five years, confirming that the borough's recent momentum has sat with the cheaper end rather than the dearest.
Monthly Property Sales in Stockport
Monthly sales range from 11 transactions in SK1 to 58 in SK8 Cheadle, with turnover running from 10% in WA15 up to 34% in SK2 Offerton. The bigger suburban postcodes shift more homes in absolute terms, but turnover, the share of stock that changes hands in a year, is where the real liquidity signal sits.
| Area | Sales Per Month | Turnover | Asking Price |
|---|---|---|---|
| SK8 (Cheadle, Cheadle Hulme) | 58 | 15% | £420,263 |
| SK6 (Marple, Bredbury) | 49 | 19% | £390,451 |
| SK7 (Bramhall, Hazel Grove) | 41 | 16% | £485,609 |
| WA15 (Hale, Timperley) | 39 | 10% | £638,191 |
| SK2 (Offerton) | 33 | 34% | £296,376 |
| SK5 (Reddish, Brinnington) | 30 | 32% | £234,784 |
| SK4 (Heaton Moor, Heaton Mersey) | 29 | 29% | £373,882 |
| SK3 (Edgeley, Davenport) | 28 | 33% | £268,395 |
| M19 (Levenshulme, Burnage) | 24 | 23% | £323,158 |
| SK12 (Poynton, Disley) | 23 | 13% | £485,162 |
| SK1 (Town Centre) | 11 | 24% | £205,216 |
SK2 Offerton's 34% turnover is the highest in Stockport, with SK3 Edgeley and SK5 Reddish close behind in the low thirties. These mid-priced northern and central postcodes combine steady demand with a deep pool of family stock, so homes change hands often. For a buy-to-let investor, high turnover signals an easier exit when the time comes to sell.
WA15 Hale records 39 sales a month but only 10% turnover, the lowest in the borough, because its expensive stock is a small share of a large, slow-moving base. SK12 Poynton sits similarly low at 13%. At the top of the market, owners hold for longer and homes sit on the market for more of the year, the trade-off that comes with the prestige postcodes.
How Long Properties Take to Sell in Stockport
SK3 Edgeley clears fastest in Stockport at around 74 days, while SK12 Poynton and WA15 Hale both sit for roughly 304 days, a four-fold gap inside one borough. Days on market is the typical number of days a home is up for sale before it sells, and the months of unsold stock shows how much for-sale supply is sitting there at the current rate of sales. Two postcodes can show a similar yield, but a far quicker route back out.
| Area | Avg Days to Sell | Months of Unsold Stock | Market |
|---|---|---|---|
| SK3 (Edgeley, Davenport) | 74 | 2.4 | Seller's market |
| SK2 (Offerton) | 95 | 3.1 | Seller's market |
| SK4 (Heaton Moor, Heaton Mersey) | 109 | 3.6 | Seller's market |
| SK1 (Town Centre) | 122 | 4.0 | Seller's market |
| SK5 (Reddish, Brinnington) | 122 | 4.0 | Seller's market |
| M19 (Levenshulme, Burnage) | 132 | 4.3 | Seller's market |
| SK6 (Marple, Bredbury) | 152 | 5.0 | Seller's market |
| SK7 (Bramhall, Hazel Grove) | 160 | 5.3 | Seller's market |
| SK8 (Cheadle, Cheadle Hulme) | 203 | 6.7 | Balanced market |
| SK12 (Poynton, Disley) | 304 | 10.0 | Balanced market |
| WA15 (Hale, Timperley) | 304 | 10.0 | Balanced market |
The cheaper, central postcodes are where stock moves. SK3 Edgeley at 2.4 months of unsold supply and SK2 Offerton at 3.1 mean an investor in those postcodes can expect to find a buyer in a couple of months rather than a year. That liquidity is a real and often overlooked part of the return, because it is the difference between exiting cleanly and carrying a property you are trying to move on.
At the premium end, SK12 Poynton and WA15 Hale each carry ten months of unsold stock and around 304 days on market. The same affluence that lifts their prices thins out the buyer pool, so a sale there is a longer, slower process. For a landlord weighing income against exit speed, the southern suburbs ask you to accept lower yields and a longer wait to sell.
What Type of Property Can You Buy in Stockport?
The housing mix flips sharply across Stockport: SK1 around the town centre is 40.3% flats and only 3.1% detached, while SK12 Poynton is 51.1% detached and just 3.6% flats. That split shapes which strategies fit where. The figures below are drawn from 2021 Census records for each postcode.
| Area | Detached | Semi-detached | Terraced | Flats |
|---|---|---|---|---|
| SK1 (Town Centre) | 3.1% | 20.4% | 36.1% | 40.3% |
| SK5 (Reddish, Brinnington) | 6.3% | 39.2% | 30.7% | 23.9% |
| SK3 (Edgeley, Davenport) | 9.5% | 47.2% | 24.1% | 19.2% |
| M19 (Levenshulme, Burnage) | 14.2% | 48.5% | 21.7% | 15.6% |
| SK2 (Offerton) | 19.7% | 41.7% | 20.6% | 18.0% |
| SK4 (Heaton Moor, Heaton Mersey) | 21.8% | 43.1% | 17.0% | 18.0% |
| WA15 (Hale, Timperley) | 27.0% | 39.4% | 17.8% | 15.8% |
| SK8 (Cheadle, Cheadle Hulme) | 35.4% | 35.5% | 11.6% | 16.9% |
| SK6 (Marple, Bredbury) | 41.1% | 34.0% | 19.3% | 5.4% |
| SK7 (Bramhall, Hazel Grove) | 44.1% | 33.7% | 12.9% | 9.4% |
| SK12 (Poynton, Disley) | 51.1% | 30.6% | 11.2% | 3.6% |
SK1 holds by far the largest share of flats at 40.3% and terraces at 36.1%, the smaller-unit stock that typically forms the buy-to-let market, and that lines up with the town centre carrying the lowest asking price and the highest yield in the borough. Those flats and terraces suit single lets and sharers close to the station and the regenerating centre. SK5 Reddish and SK3 Edgeley follow the same pattern, with high terraced and flat shares that keep the northern postcodes pointed at income.
SK12 Poynton is the most detached-dominated postcode at 51.1%, with the smallest flat share at 3.6%, and SK7 Bramhall is close behind at 44.1% detached. Detached and semi-detached houses together make up 81.7% of the stock in SK12 and 77.8% in SK7. That large-home mix matches their premium asking prices; SK7 yields 3.7%, while SK12 has too few rental listings for a reliable yield. The southern suburbs are weighted towards owner-occupier family homes rather than the smaller units that drive rental income.
Flats combine purpose-built and converted units, and a small share of mobile or temporary dwellings is left out, so rows may not add to exactly 100%.

Stockport Rental Market Analysis
Monthly rents in Stockport range from £1,021 in SK1 to £1,975 in WA15 Hale, with gross rental yields running from 3.6% to 6.0% across the borough. For investors asking is buy to let worth it in Stockport, the sections below break down rents, yields and tenant affordability postcode by postcode. If you are weighing how to build a property portfolio in the North West, Stockport offers a more affluent and resilient tenant base than its higher-yielding neighbours, at the cost of thinner headline returns. Browse current buy-to-let investments for sale across the region.
Average Rent & Gross Rental Yields in Stockport
Gross rental yields in Stockport range from 3.6% in SK4 to 6.0% in SK1. The cheapest postcode delivers the highest yield, and the relationship holds almost perfectly across the borough: as asking prices climb south, the income return falls away. WA15 Hale charges the highest rent at £1,975 a month but yields just 3.7%, because its £638,191 asking price swamps the income.
| Area | Average Monthly Rent | Asking Price | Gross Yield |
|---|---|---|---|
| SK1 (Town Centre) | £1,021 | £205,216 | 6.0% |
| SK5 (Reddish, Brinnington) | £1,125 | £234,784 | 5.8% |
| M19 (Levenshulme, Burnage) | £1,414 | £323,158 | 5.3% |
| SK3 (Edgeley, Davenport) | £1,151 | £268,395 | 5.1% |
| SK2 (Offerton) | £1,166 | £296,376 | 4.7% |
| SK8 (Cheadle, Cheadle Hulme) | £1,501 | £420,263 | 4.3% |
| SK6 (Marple, Bredbury) | £1,271 | £390,451 | 3.9% |
| SK7 (Bramhall, Hazel Grove) | £1,505 | £485,609 | 3.7% |
| WA15 (Hale, Timperley) | £1,975 | £638,191 | 3.7% |
| SK4 (Heaton Moor, Heaton Mersey) | £1,130 | £373,882 | 3.6% |
| SK12 (Poynton, Disley) | Not enough data | £485,162 | Not enough data |
SK1 at 6.0% combines the lowest asking price in the borough with a modest £1,021 rent yet still delivers the best income return. A 30% deposit of £61,565 gets an investor into the highest-yielding postcode and the one most exposed to the town centre regeneration. SK5 Reddish at 5.8% on a £234,784 asking price keeps the two northern postcodes at the top of the yield table.
SK4 Heaton Moor at 3.6% sits at the bottom of Stockport's yield table. Its £1,130 rent is mid-range, but the £373,882 asking price for sought-after Heaton Moor and Heaton Mersey stock compresses the return. In the southern and inner suburbs, the premium price does more for capital values than for rental income, the consistent trade-off across Stockport's two-tier market. SK12 Poynton is excluded from the yield table because there are too few rental listings there to read a reliable figure.
Is Stockport Rent High?
Monthly rents in Stockport consume between 31.1% and 60.3% of the local median gross monthly salary. The widely cited threshold for rent affordability is 30% of gross income, and no Stockport postcode falls below it. That is a wider and higher spread than many North West towns, a direct read of the borough's premium prices feeding through into premium rents.
The median gross weekly salary in Stockport is £756.10, which equates to £3,276 per month or £39,318 per year. This is above the North West regional median of £720.10 per week and broadly level with the Great Britain median of £752.40 per week. Data from the Nomis Labour Market Profile (ASHE 2025).
| Rank | Area | Rent as % of Income |
|---|---|---|
| 1 | WA15 (Hale, Timperley) | 60.3% |
| 2 | SK7 (Bramhall, Hazel Grove) | 45.9% |
| 3 | SK8 (Cheadle, Cheadle Hulme) | 45.8% |
| 4 | M19 (Levenshulme, Burnage) | 43.2% |
| 5 | SK6 (Marple, Bredbury) | 38.8% |
| 6 | SK2 (Offerton) | 35.6% |
| 7 | SK3 (Edgeley, Davenport) | 35.1% |
| 8 | SK4 (Heaton Moor, Heaton Mersey) | 34.5% |
| 9 | SK5 (Reddish, Brinnington) | 34.3% |
| 10 | SK1 (Town Centre) | 31.1% |
| 11 | SK12 (Poynton, Disley) | Not enough data |
SK1 at 31.1% is the closest Stockport comes to the 30% affordability mark. A £1,021 rent against a £3,276 monthly salary leaves the most headroom in the borough, and that matters for landlords because tenants who are not stretched tend to stay longer and fall into arrears less often. The northern postcodes around SK3 to SK5 sit only a little above, in the mid-thirties.
WA15 Hale at 60.3% is by far the least affordable on the median salary, but context matters: a £1,975 rent in Hale is paid by professional and dual-income households, not single earners on the borough median. The figure flags that the southern suburbs run on a tenant base earning well above the local average rather than on affordability headroom.
How Big Is Stockport's Private Rented Sector?
The private rented sector is deepest in SK1 at 29.6% of households and shallowest in SK6 Marple at 8.9%, a spread that tracks the borough's price map almost exactly. The share of homes already let privately shows how established and tested the local tenant demand is, and in Stockport the rented sector concentrates where the smaller, cheaper stock is. The table below shows household tenure by postcode.
| Area | Owned Outright | Owned with Mortgage | Private Rented | Social Rented |
|---|---|---|---|---|
| SK1 (Town Centre) | 17.0% | 24.2% | 29.6% | 25.8% |
| M19 (Levenshulme, Burnage) | 27.1% | 32.7% | 20.4% | 17.8% |
| WA15 (Hale, Timperley) | 30.6% | 31.1% | 19.3% | 18.5% |
| SK3 (Edgeley, Davenport) | 25.3% | 34.8% | 19.2% | 18.0% |
| SK5 (Reddish, Brinnington) | 23.8% | 30.1% | 18.9% | 26.0% |
| SK4 (Heaton Moor, Heaton Mersey) | 36.7% | 37.2% | 16.4% | 8.5% |
| SK2 (Offerton) | 36.0% | 33.2% | 14.6% | 14.5% |
| SK8 (Cheadle, Cheadle Hulme) | 42.6% | 37.0% | 12.8% | 6.7% |
| SK7 (Bramhall, Hazel Grove) | 44.9% | 37.2% | 10.6% | 6.0% |
| SK12 (Poynton, Disley) | 46.9% | 37.9% | 10.2% | 4.8% |
| SK6 (Marple, Bredbury) | 48.3% | 36.2% | 8.9% | 5.7% |
SK1 has the largest private rented sector in Stockport at 29.6% of households, with M19 Levenshulme next at 20.4%. The town centre's deep rented base sits alongside its high yield and its flat-and-terrace stock, so an investor there is buying into a proven, active lettings market rather than an untested one. The northern and inner postcodes from SK3 to SK5 carry mid-range rented shares around 19%, a solid established tenant pool.
SK6 Marple at 8.9%, SK12 Poynton at 10.2% and SK7 Bramhall at 10.6% sit at the other end, where outright and mortgaged owners together hold more than 80% of homes. With so little stock already let, the rental market in these southern suburbs is thinner and the homes are larger and pricier, the opposite end of the borough from the income-led town centre.
Among the postcodes with enough rental listings to read, the balance currently favours landlords in SK3 Edgeley, SK8 Cheadle and WA15 Hale, where homes were letting in around 18 to 59 days. M19 Levenshulme was more balanced at about 94 days to let. The remaining postcodes have too few rental listings at any one time to read reliably.
Local Housing Allowance Rates in Stockport
Stockport straddles three Broad Rental Market Areas, so the Local Housing Allowance a tenant can claim depends on which postcode they are in. Local Housing Allowance caps the eligible rent used to calculate housing support; it does not set a minimum market rent. Most of the borough sits in the Southern Greater Manchester BRMA, M19 falls in Central Greater Manchester, and SK12 Poynton sits in East Cheshire, each with its own rates as of June 2026.
| Property Size | Southern Greater Manchester (most postcodes) | Central Greater Manchester (M19) | East Cheshire (SK12) |
|---|---|---|---|
| Shared accommodation | £94.72 | £94.72 | £97.00 |
| 1 bedroom | £143.84 | £178.36 | £126.58 |
| 2 bedrooms | £172.60 | £201.37 | £166.85 |
| 3 bedrooms | £207.12 | £218.63 | £228.99 |
| 4 bedrooms | £322.19 | £310.68 | £402.74 |
The split matters most at the smaller end, where M19's one-bed rate of £178.36 a week runs well ahead of the £143.84 across the bulk of Stockport, reflecting its place in the Central Greater Manchester area closest to the city. At the family end, the four-bed weekly rates are £310.68 in Central Greater Manchester, £322.19 in Southern Greater Manchester and £402.74 in East Cheshire. Across the Southern Greater Manchester postcodes that cover most of the borough, the two-bed rate of £172.60 a week works out at about £748 a month, while the four-bed rate is about £1,396 a month. Those bedroom-specific allowances are not directly comparable with the £1,021 to £1,975 postcode averages, which mix property sizes, so the exact address and bedroom entitlement both matter. To check the current rate for a specific address, you can use the government's official Local Housing Allowance calculator.
Buy-to-Let Considerations
Are House Prices High in Stockport? Price-to-Earnings Ratios
Purchasing a property in Stockport requires between 5.2 and 16.2 times the median annual salary. This is based on the Nomis Labour Market Profile for Stockport showing the median gross annual income for Stockport residents is £39,318.
England's average sold price of £289,946 is 7.4 times the Great Britain median annual salary of £39,125. Three of Stockport's eleven postcodes (SK1, SK5 and SK3) sit below that benchmark, meaning they are more affordable relative to local incomes than the England average is relative to national incomes.
| Rank | Area | Price-to-Earnings Ratio |
|---|---|---|
| 1 | SK1 (Town Centre) | 5.2x |
| 2 | SK5 (Reddish, Brinnington) | 6.0x |
| 3 | SK3 (Edgeley, Davenport) | 6.8x |
| 4 | SK2 (Offerton) | 7.5x |
| 5 | M19 (Levenshulme, Burnage) | 8.2x |
| 6 | SK4 (Heaton Moor, Heaton Mersey) | 9.5x |
| 7 | SK6 (Marple, Bredbury) | 9.9x |
| 8 | SK8 (Cheadle, Cheadle Hulme) | 10.7x |
| 9 | SK12 (Poynton, Disley) | 12.3x |
| 10 | SK7 (Bramhall, Hazel Grove) | 12.4x |
| 11 | WA15 (Hale, Timperley) | 16.2x |
SK1 at 5.2x is well below the national benchmark of 7.4x and the most affordable entry in Stockport relative to local earnings. At just over five times the median salary, the town centre is competitive with many higher-yielding North West postcodes, but in a borough with stronger wages and lower unemployment underneath it. SK5 and SK3 follow below the benchmark in the low-to-mid sixes.
WA15 Hale at 16.2x sits more than double the national benchmark. At over sixteen times the local median salary, Hale is firmly premium territory, bought by dual-income households or those trading down from the South. For an investor, that ratio compresses yields and stretches the payback period, the reason the income case in Stockport sits firmly in the north of the borough.
Deposit Requirements in Stockport
A 30% deposit on a buy-to-let property in Stockport ranges from £61,565 in SK1 to £191,457 in WA15 Hale. The £129,892 gap between them is more than twice the SK1 deposit, but it is not enough to buy the average £205,216 SK1 property outright. These figures use the same 30% assumption throughout, making the extra capital required further south clear.
Beyond the deposit, the stamp duty calculation and other buy-to-let running costs affect the total capital required.
| Rank | Area | 30% Deposit Required |
|---|---|---|
| 1 | SK1 (Town Centre) | £61,565 |
| 2 | SK5 (Reddish, Brinnington) | £70,435 |
| 3 | SK3 (Edgeley, Davenport) | £80,518 |
| 4 | SK2 (Offerton) | £88,913 |
| 5 | M19 (Levenshulme, Burnage) | £96,947 |
| 6 | SK4 (Heaton Moor, Heaton Mersey) | £112,165 |
| 7 | SK6 (Marple, Bredbury) | £117,135 |
| 8 | SK8 (Cheadle, Cheadle Hulme) | £126,079 |
| 9 | SK12 (Poynton, Disley) | £145,549 |
| 10 | SK7 (Bramhall, Hazel Grove) | £145,683 |
| 11 | WA15 (Hale, Timperley) | £191,457 |
SK1 is the cheapest way into Stockport at a £61,565 deposit, and it pairs the borough's top yield at 6.0% with its strongest recent growth. Stepping up to SK5 Reddish costs under £9,000 more and gives a 5.8% yield on a £70,435 deposit. SK3 is third-cheapest at an £80,518 deposit and yields 5.1%, while the more expensive M19 sits above it on yield at 5.3%.
At the other end, SK7 Bramhall and SK12 Poynton sit within £134 of each other on deposit but are different bets: SK7 still rents at £1,505 a month for a 3.7% yield, while SK12 is a detached-dominated postcode with too thin a rental market to price reliably. WA15 Hale's £191,457 deposit is more than three times SK1's, and it buys prestige and capital values rather than income, the clearest expression of Stockport's two-tier market.
What the Stockport Data Tells Buy-to-Let Investors
In Stockport the cheapest way in is also the highest-yielding, and it is the part of the borough the regeneration is reshaping. SK1 around the town centre has the top yield at 6.0%, the lowest asking price for buying an investment property in Stockport at £205,216, the most affordable prices against local earnings at 5.2 times income, and the borough's strongest recent growth at 11.9% over a year and 36.1% over five. A 30% deposit there is £61,565, the lowest in the borough, for a home renting at £1,021 a month.
SK5 Reddish and SK3 Edgeley extend the income case north of the river, with yields of 5.8% and 5.1% on deposits under £81,000 and five-year growth above 29%. These are the postcodes where the smaller terraced and flat stock, the deeper private rented sectors and the faster selling times all line up, so the income, the tenant pool and the exit route point the same way.
The southern suburbs sit at the high-price end of the borough. WA15 Hale, SK7 Bramhall and SK12 Poynton have three of the four highest asking prices. WA15 and SK7 each yield 3.7%, while SK12 has too few rental listings for a reliable figure; WA15 also sits on the market for around 304 days. The numbers show larger homes and higher capital values alongside thinner measured income returns. Investors who want to come in below those asking prices often work the off-market property in Stockport route before homes reach the portals.
Stockport has no boroughwide selective licensing scheme covering all private landlords, though landlords should always check the council's current requirements for the specific area on its property licensing pages. With above-average wages, a 75.3% employment rate, Manchester's overflow demand and £1.4 billion of town-centre regeneration underway, Stockport is a steadier, more affluent commuter market than its higher-yielding neighbours. The premium south carries lower headline yields, while the regenerating town centre reaches 6%.
How Stockport Compares
Stockport's mean asking price of £374,681 is the second highest of the five Greater Manchester locations compared here, £956 below Trafford, while its 6.0% top yield trails Manchester, Salford and Trafford but edges Tameside. The comparison below places Stockport alongside four nearby boroughs, each with a different investor profile. The mean asking price and mean monthly rent are simple averages across all postcodes with data. Top gross yield is the single highest postcode yield in each location.
| Location | Mean Asking Price | Mean Monthly Rent | Mean Gross Yield | Top Yield (postcode) |
|---|---|---|---|---|
| Salford | £248,444 | £1,188 | 5.7% | 6.6% (M3, M6) |
| Tameside | £254,959 | £1,022 | 4.8% | 5.8% (M43) |
| Manchester | £268,032 | £1,312 | 5.9% | 8.1% (M14) |
| Stockport | £374,681 | £1,326 | 4.2% | 6.0% (SK1) |
| Trafford | £375,637 | £1,329 | 4.2% | 6.4% (M17) |
Stockport is the second most expensive location in this comparison at £374,681 mean asking price, all but level with neighbouring Trafford at £375,637, and the pair sit clearly above the cheaper Greater Manchester boroughs. Stockport's mean rent of £1,326 is £3 below Trafford and £14 above Manchester, placing it second in the group.
For investors comparing income, the best buy-to-let areas in Manchester lead on top postcode yield at 8.1%, with Salford at 6.6% and Trafford at 6.4% also above Stockport's 6.0%. Manchester and Salford have lower mean asking prices than Stockport, while Trafford is £956 higher. Tameside at £254,959 has the cheapest mean asking price alongside a 5.8% top yield. Stockport combines a 6% town-centre yield with higher local wages and a large suburban family-home market. For a data-driven comparison across all UK locations, see our best places to invest in buy-to-let guide.
Frequently Asked Questions
Is Stockport a good place to live for buy-to-let tenants?
For most of Greater Manchester, yes, and it mostly comes down to jobs and connections. Stockport's employment rate is 75.3%, a little above the regional 74.5%, unemployment is below average at 4.2%, and the typical wage is £756 a week against roughly £720 across the North West. Tenants in steadier work, earning a bit more, are generally better placed to keep the rent paid.
It is also an easy place to rent in. Direct trains reach Manchester Piccadilly in under ten minutes, the M60 rings the borough, and the suburbs offer space that the city centre cannot, which suits professional renters and families who tend to stay put rather than move on every year.
What are the best areas in Stockport for property investment?
It depends whether you are buying for income or for growth, and Stockport splits cleanly north to south. SK1 around the town centre is the cheapest way in at £205,216 and carries the highest yield at 6.0%, with SK5 Reddish (5.8%) and SK3 Edgeley (5.1%) extending the income end. These northern and central postcodes have the smaller, cheaper stock, the deeper rented sectors and the faster selling times.
The southern suburbs are the high-price, large-home end. WA15 Hale, SK7 Bramhall and SK12 Poynton command three of the four highest asking prices. WA15 and SK7 both yield 3.7%; SK12 has too few rental listings for a reliable yield. The measurable split is between higher yields in the northern and central postcodes and larger family-home stock in the south.
How does Stockport compare to Manchester for buy-to-let?
They sit at different ends of the same region. Manchester is the higher-yield, lower-cost option, with a top yield around 8.1% against Stockport's 6.0%, and a mean asking price of £268,032, roughly 28% below Stockport's £374,681. It also has a far deeper student and city-centre flat market with more stock to choose from.
Stockport trades that yield for a wealthier, more suburban tenant base, higher local wages, and family-house stock that Manchester's city centre cannot offer. Manchester shows the higher top yield; Stockport shows higher asking prices, more large-home stock in its southern suburbs and a regenerating town centre.
Is there demand for student or HMO accommodation in Stockport?
Stockport has no large university of its own, so it is not a core student market in the way central Manchester is. The demand that exists is more for young professionals and house-sharers commuting into Manchester, concentrated in the cheaper, better-connected northern postcodes like SK1 and M19 with their higher flat and terrace shares.
On the HMO side, a sample of current M19 Levenshulme room adverts puts a double room with a shared bathroom at around £147 a week, with most between £127 and £173 (the middle 80% of 38 adverts). That was the only room type with enough live adverts for a reliable figure, so other room types across Stockport are harder to pin down. For how the numbers work on a shared house, see our complete guide to HMO investment, and for the purpose-built end, our guide to student property investment.
Can I find buy-to-let property under £250,000 in Stockport?
The lower-priced part of the market is concentrated in two postcodes. SK1 around the town centre averages £205,216 and SK5 Reddish £234,784, and they deliver the borough's highest yields at 6.0% and 5.8%. By property type, flats average £172,398 across the borough, while terraced houses average £250,051, just above the threshold. The available sub-£250,000 stock is therefore concentrated in the northern town-centre postcodes and flats elsewhere. You can also explore below market value property.
What are average house prices in Stockport?
The sold-price picture starts above the national average. Stockport is at £313,101 on the Land Registry index, about 8.0% above the England average of £289,946 as of March 2026, which makes it one of the few North West boroughs trading above the national figure. Asking prices by postcode run from £205,216 in SK1 around the town centre up to £638,191 in WA15 Hale, with a borough-wide mean of £374,681. By type, detached homes average £547,093, semi-detached £343,089, terraced £250,051 and flats £172,398.
Through a buy-to-let lens, SK1 is the cheapest entry and the highest-yielding at 6.0%, while WA15 Hale is the dearest and among the lowest-yielding.
What are the Local Housing Allowance rates in Stockport?
Stockport spans three Broad Rental Market Areas, so the rate depends on the postcode. Most of the borough falls in Southern Greater Manchester, where as of June 2026 Local Housing Allowance runs at £94.72 a week for a shared room, £143.84 for a one-bed, £172.60 for two beds, £207.12 for three and £322.19 for four. M19 Levenshulme sits in Central Greater Manchester, where the four-bed rate is £310.68, while SK12 Poynton falls in East Cheshire, where the four-bed rate is £402.74. Local Housing Allowance caps the eligible rent used to calculate housing support; it does not set a minimum market rent.
What type of property is most common in Stockport?
The housing mix changes completely as you cross the borough. SK1 around the town centre is dominated by flats (40.3%) and terraces (36.1%), the smaller stock that suits buy-to-let. Head south and detached houses take over: SK12 Poynton is 51.1% detached and just 3.6% flats, with SK7 Bramhall close behind. Semi-detached houses are the most common type in the inner and northern postcodes, from SK3 Edgeley to M19 Levenshulme, which is also where most family rental demand sits.
How do I buy an investment property in Stockport?
Decide first whether you are buying for income or for growth, because in Stockport that points you at a different half of the borough. For yield, SK1 around the town centre is the cheapest entry at £205,216 and the highest-yielding at 6.0%, with SK5 Reddish close behind. For larger family homes in established commuter suburbs, head south to Cheadle, Bramhall and Hale, accepting lower yields for prestige and space. Budget 30% down, which runs from £61,565 in SK1 to £191,457 in WA15 Hale depending on the postcode.
Beyond what is listed openly, plenty of experienced investors buy below asking through off-market property in Stockport and BMV property. To see what is available now, browse investment properties or buy-to-let homes for sale.
Ready to buy property?
Browse investment properties with prices and gross yields shown for each opportunity.
Get property alerts