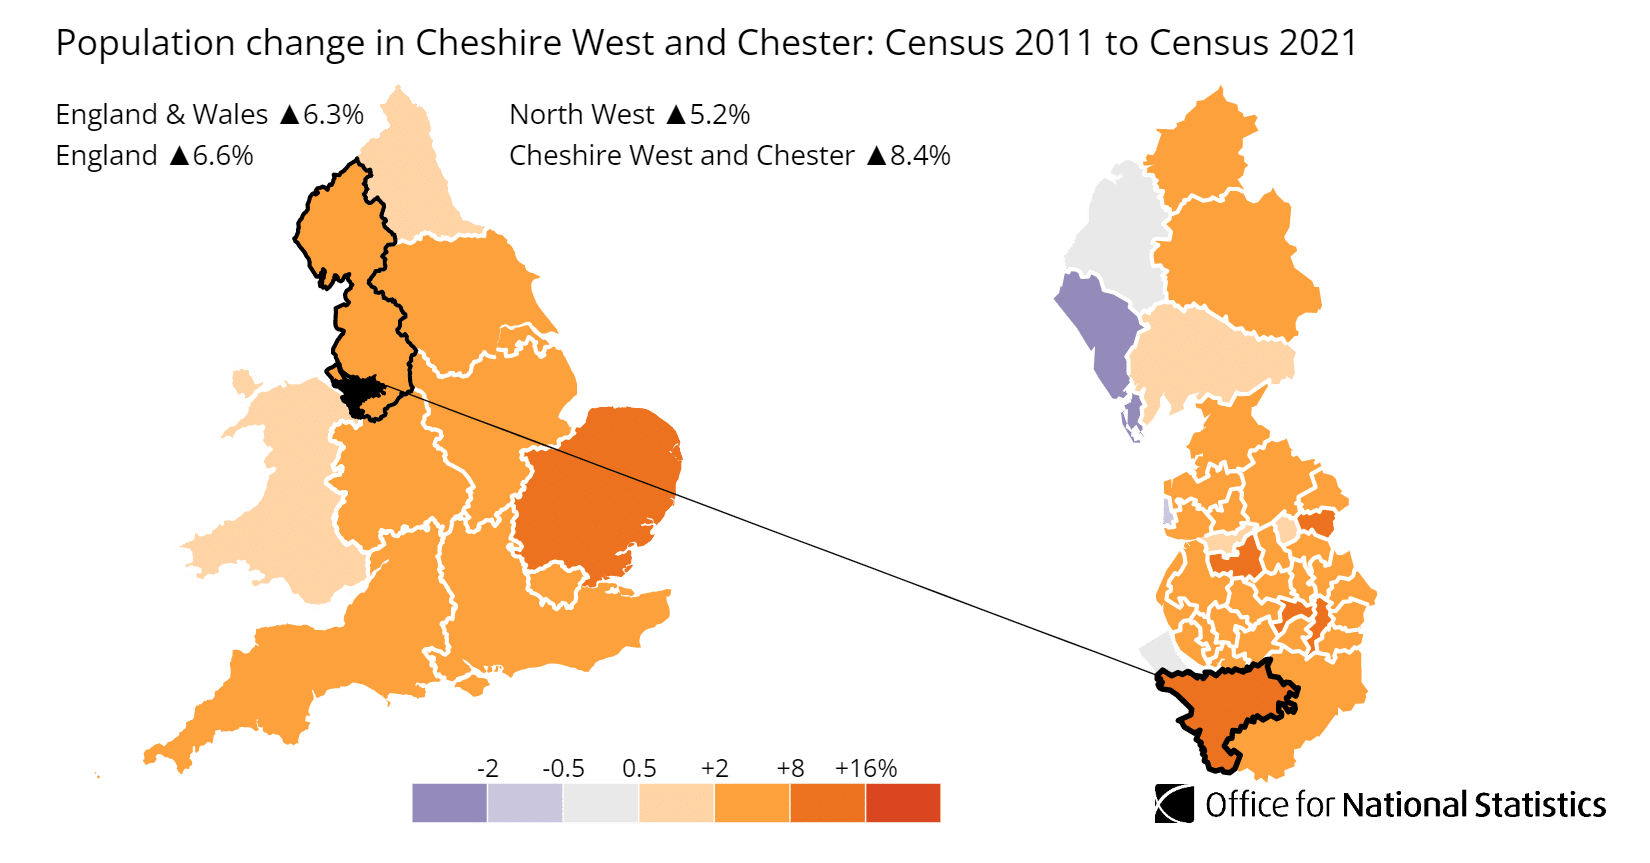
Chester is a city in Cheshire, in north-west England, at the heart of the Cheshire West and Chester unitary authority. Average sold prices across Cheshire West and Chester sit at £267,724 on the HM Land Registry House Price Index, 24.7% above the North West regional average of £214,678 yet £22,222 below England's £289,946. Buying here means paying nearly a quarter more than the North West average while still sitting below England's. The local authority's population grew 8.36% between the 2011 and 2021 censuses, from 329,608 to 357,150 residents.
Earnings in Cheshire West and Chester outstrip the region by 10.8%: the median gross weekly salary is £797.80, compared to £720.10 across the North West and £752.40 for Great Britain. For investors, the spread between CH1 at £258,806 and CH3 at £444,352 creates a two-tier market within a single city, where the higher yields sit with the cheaper postcodes rather than the premium ones.
This guide covers the unitary authority of Cheshire West and Chester (ONS code E06000050) across postcodes CH1, CH2, CH3, and CH4. CH1 and CH4 both reach across the border into Flintshire, Wales, at Higher Ferry, Saltney, Broughton and Penyffordd, so the England-only licensing, stamp duty and Local Housing Allowance statements on this page do not cover those addresses. Chester sits in the North West region, 40 miles south of Liverpool and 40 miles south-west of Manchester. The wider Cheshire buy-to-let region also includes Warrington to the north-east.
Article updated: July 2026

Why Invest in Chester?
Cheshire West and Chester, the local authority Chester sits within, grew its population 8.36% between the 2011 and 2021 censuses, from 329,608 to 357,150 residents. That growth rate is above the England and Wales average of 6.3%. Chester is the authority's main centre, with a Roman heritage and a compact walkable core.
The local employment rate of 81.2% is above both the North West average of 74.2% and Great Britain's 75.6%. Wholesale and retail account for 14.3% of employee jobs, health and social work 12.0%, and professional, scientific and technical services 10.9%, so the employment base runs beyond tourism and the university. The University of Chester adds a student population, and the city's tourism economy supports accommodation and food jobs, the sector our guide to holiday let investment covers.
Median gross annual earnings across Cheshire West and Chester are £41,486, which is 10.8% above the North West regional median of £37,445 and 6.0% above the Great Britain median of £39,125.
Chester Economic Summary
- Population (Cheshire West and Chester): 357,150 (2021 Census). Growth of 8.36% from 2011.
- Median annual salary: £41,486 (local), £37,445 (North West), £39,125 (Great Britain)
- Employment rate: 81.2% (local), 74.2% (North West), 75.6% (Great Britain)
- Unemployment rate: 5.6% (local)
- Key employment sectors: Wholesale and retail, health and social work, professional and technical services, administrative services, accommodation and food
Source: ONS Census 2021, Nomis Labour Market Profile (ASHE 2025, Employment Oct 2024-Sep 2025)
Regeneration and Investment in Chester
Chester's city centre regeneration is anchored by the £72 million Northgate scheme, with over 400 new homes now in the pipeline for Phase 2. The investment is concentrated around the former Forum shopping centre site, where VINCI UK Developments and ION Property Developments signed a pre-development agreement with the council in November 2025.
- Chester Northgate Future Phases (Masterplanning, 400+ homes): VINCI UK Developments and ION Property Developments signed a pre-development agreement with Cheshire West and Chester Council in November 2025 to deliver over 400 sustainable homes, new public spaces, and reinstated historic lanes on the former Forum shopping centre site. The scheme adds a residential component to the Northgate retail and leisure site. Updates at Cheshire West and Chester Council.
- Chester Northgate Phase 1 (Completed, £72 million): The new retail, leisure, and dining destination in Chester city centre opened in 2022 with a six-screen Picturehouse cinema, relocated indoor market, and multiple restaurants. The scheme has welcomed over 3.5 million visitors to Chester Market since opening and has directly increased city centre footfall. Updates at Gardiner & Theobald.
- Cheshire and Warrington Growth Programme (Active): The Cheshire and Warrington Combined Authority, established in February 2026 with Cheshire West and Chester, Cheshire East and Warrington as its members, coordinates sub-regional investment across Chester, Warrington, and Crewe, with major development sites promoted at the UKREiiF 2026 national property conference and a directly elected mayor due in May 2027.
Source: Office for National Statistics - Population for Cheshire West and Chester
Chester Property Market Analysis
Average property prices in Cheshire West and Chester have risen 409.8% since January 1995, from £52,516 to £267,724. The sections below break down that journey cycle by cycle, then drill into current postcode-level data for sold prices, price per square foot, asking prices, growth trends, and monthly transaction volumes.
When was the last house price crash in Chester?
Chester sits within the unitary authority of Cheshire West and Chester, so all sold property prices from HM Land Registry are recorded at this level. The Land Registry House Price Index tracks average prices from January 1995 to March 2026, covering 31 years of market cycles.
The 1995 to 2007 boom: Cheshire West and Chester started at £52,516 in January 1995. By December 2000, prices had reached £75,841, a 44.4% increase in six years. Growth accelerated through the early 2000s, reaching £157,821 by December 2005. The market peaked at £175,410 in September 2007.
2008 to 2009, the financial crisis: Prices fell from the September 2007 peak of £175,410 to a trough of £148,501 in May 2009. That is a decline of 15.3% over 20 months. The worst year-on-year reading was -13.2% in May 2009. Chester's decline was shallower than both the England fall of 18.2% (from £183,883 in September 2007 to £150,438 in March 2009) and the North West fall of 18.3% (from £141,847 in December 2007 to £115,931 in January 2013).
The 2010 to 2013 stagnation: Prices bounced off the May 2009 trough but plateaued. By December 2010, the average stood at £161,039. It drifted down to £154,485 by December 2012 before picking up to £160,349 by December 2013. Chester spent nearly four years oscillating in a narrow band, unable to push past the pre-crash peak.
Recovery, 2014 to 2016: Growth returned with prices rising from £168,043 in December 2014 to £176,690 in April 2016. That April 2016 reading was the first time prices surpassed the September 2007 pre-crash peak of £175,410. It took eight and a half years to recover. By December 2016, the average reached £180,162.
The 2017 to 2019 pre-pandemic growth: Steady single-digit growth continued. Prices moved from £187,465 in December 2017 to £191,375 in December 2018 and £195,182 in December 2019. Annual growth sat between 2.0% and 4.1% through this period.
2020 to 2022, the pandemic surge: The stamp duty holiday lifted Chester. Prices jumped from £195,949 in June 2020 to £211,400 by December 2020 (8.3% annual growth). The run continued through 2021, hitting £226,756 by December 2021 (7.3% annual). By December 2022, prices reached £253,514 (11.8% annual growth).
The 2023 rate shock: Higher mortgage rates slowed the market. Prices eased to £248,201 by June 2023 and £248,737 by December 2023, recording -1.9% annual growth.
2024 to present: Prices reached £258,676 by December 2024 (4.0% annual growth) and £267,724 by the latest reading in March 2026. The current price is 52.6% above the pre-crash peak of £175,410.
Long-term growth summary:
- 5 years (March 2021 to March 2026): 22.6% growth (£218,400 to £267,724)
- 10 years (December 2015 to March 2026): 53.8% growth (£174,099 to £267,724)
- 15 years (December 2010 to March 2026): 66.2% growth (£161,039 to £267,724)
- 20 years (December 2005 to March 2026): 69.6% growth (£157,821 to £267,724)
- 31 years (January 1995 to March 2026): 409.8% growth (£52,516 to £267,724)
Chester's 15.3% crash was shallower than the regional and national falls, but the 409.8% rise over 31 years includes an eight-and-a-half-year wait to regain the pre-crash peak, longer than England's. An investor who bought at the exact peak in September 2007 would now be sitting on gains of 52.6% on the Land Registry average.
- All property types
- Detached
- Semi-detached
- Terraced
- Flats
Source: HM Land Registry House Price Index
| Year | All property types | Detached | Semi-detached | Terraced | Flats |
|---|---|---|---|---|---|
| 1995-01 | £52,516 | £89,229 | £49,808 | £38,406 | £33,265 |
| 1995-02 | £53,387 | £89,961 | £50,915 | £39,141 | £33,965 |
| 1995-03 | £53,200 | £89,505 | £50,732 | £39,107 | £33,820 |
| 1995-04 | £53,353 | £89,454 | £50,949 | £39,306 | £34,024 |
| 1995-05 | £52,782 | £88,432 | £50,399 | £38,938 | £33,625 |
| 1995-06 | £52,455 | £87,850 | £50,161 | £38,605 | £33,536 |
| 1995-07 | £52,705 | £88,471 | £50,386 | £38,722 | £33,482 |
| 1995-08 | £53,700 | £90,640 | £51,216 | £39,335 | £33,874 |
| 1995-09 | £54,033 | £91,360 | £51,472 | £39,598 | £33,862 |
| 1995-10 | £53,801 | £90,984 | £51,317 | £39,307 | £33,862 |
| 1995-11 | £52,129 | £88,091 | £49,779 | £38,009 | £33,035 |
| 1995-12 | £51,732 | £87,303 | £49,470 | £37,685 | £32,903 |
| 1996-01 | £51,933 | £87,924 | £49,584 | £37,788 | £32,847 |
| 1996-02 | £52,012 | £88,036 | £49,685 | £37,859 | £32,774 |
| 1996-03 | £52,181 | £88,536 | £49,846 | £37,862 | £32,822 |
| 1996-04 | £51,236 | £86,673 | £48,965 | £37,298 | £32,348 |
| 1996-05 | £52,048 | £87,872 | £49,708 | £38,047 | £32,904 |
| 1996-06 | £52,312 | £88,249 | £49,906 | £38,327 | £33,242 |
| 1996-07 | £53,524 | £90,477 | £51,057 | £39,137 | £33,816 |
| 1996-08 | £53,704 | £91,236 | £51,154 | £39,101 | £33,714 |
| 1996-09 | £53,830 | £91,837 | £51,199 | £39,116 | £33,368 |
| 1996-10 | £53,337 | £91,112 | £50,735 | £38,696 | £32,954 |
| 1996-11 | £53,588 | £91,321 | £51,024 | £38,929 | £33,254 |
| 1996-12 | £53,735 | £91,242 | £51,286 | £39,086 | £33,388 |
| 1997-01 | £53,481 | £90,774 | £51,032 | £38,950 | £33,183 |
| 1997-02 | £53,474 | £90,970 | £50,991 | £38,862 | £33,113 |
| 1997-03 | £53,945 | £91,913 | £51,323 | £39,250 | £33,493 |
| 1997-04 | £55,168 | £93,740 | £52,562 | £40,211 | £34,287 |
| 1997-05 | £55,960 | £94,851 | £53,425 | £40,867 | £34,501 |
| 1997-06 | £56,378 | £95,647 | £53,869 | £41,129 | £34,387 |
| 1997-07 | £57,046 | £97,039 | £54,448 | £41,589 | £34,453 |
| 1997-08 | £57,587 | £98,325 | £54,878 | £41,877 | £34,641 |
| 1997-09 | £58,409 | £99,922 | £55,643 | £42,394 | £35,010 |
| 1997-10 | £58,355 | £99,914 | £55,619 | £42,247 | £35,036 |
| 1997-11 | £58,723 | £100,562 | £55,990 | £42,473 | £35,259 |
| 1997-12 | £58,476 | £99,978 | £55,861 | £42,240 | £35,226 |
| 1998-01 | £58,496 | £100,292 | £55,768 | £42,213 | £35,238 |
| 1998-02 | £57,935 | £99,266 | £55,245 | £41,792 | £35,166 |
| 1998-03 | £57,676 | £98,891 | £54,956 | £41,642 | £34,950 |
| 1998-04 | £58,210 | £99,470 | £55,616 | £42,075 | £35,269 |
| 1998-05 | £58,978 | £100,576 | £56,380 | £42,782 | £35,554 |
| 1998-06 | £59,600 | £101,632 | £56,960 | £43,217 | £36,109 |
| 1998-07 | £60,265 | £102,927 | £57,545 | £43,670 | £36,423 |
| 1998-08 | £60,508 | £103,785 | £57,661 | £43,701 | £36,430 |
| 1998-09 | £61,247 | £105,248 | £58,322 | £44,196 | £36,661 |
| 1998-10 | £60,855 | £104,670 | £57,930 | £43,831 | £36,578 |
| 1998-11 | £60,506 | £104,095 | £57,659 | £43,446 | £36,526 |
| 1998-12 | £60,082 | £103,150 | £57,334 | £43,125 | £36,578 |
| 1999-01 | £60,570 | £104,021 | £57,787 | £43,466 | £36,880 |
| 1999-02 | £60,892 | £104,444 | £58,121 | £43,751 | £37,079 |
| 1999-03 | £61,668 | £105,929 | £58,798 | £44,259 | £37,568 |
| 1999-04 | £62,629 | £107,186 | £59,759 | £45,142 | £38,245 |
| 1999-05 | £64,010 | £109,342 | £61,079 | £46,268 | £39,133 |
| 1999-06 | £65,276 | £111,447 | £62,263 | £47,273 | £39,844 |
| 1999-07 | £65,545 | £112,355 | £62,404 | £47,342 | £39,858 |
| 1999-08 | £66,083 | £113,601 | £62,781 | £47,705 | £40,077 |
| 1999-09 | £66,536 | £114,794 | £63,083 | £47,930 | £40,265 |
| 1999-10 | £66,950 | £115,484 | £63,555 | £48,082 | £40,733 |
| 1999-11 | £67,478 | £116,320 | £64,130 | £48,386 | £41,182 |
| 1999-12 | £67,872 | £116,543 | £64,612 | £48,758 | £41,752 |
| 2000-01 | £68,710 | £118,239 | £65,336 | £49,338 | £42,045 |
| 2000-02 | £69,428 | £119,532 | £65,967 | £49,822 | £42,523 |
| 2000-03 | £70,158 | £120,884 | £66,683 | £50,263 | £42,709 |
| 2000-04 | £71,583 | £122,782 | £68,060 | £51,451 | £44,004 |
| 2000-05 | £72,185 | £123,678 | £68,717 | £51,832 | £44,482 |
| 2000-06 | £72,255 | £123,600 | £68,838 | £51,867 | £44,753 |
| 2000-07 | £72,452 | £124,621 | £69,017 | £51,749 | £44,454 |
| 2000-08 | £73,105 | £126,244 | £69,581 | £51,968 | £44,922 |
| 2000-09 | £73,391 | £127,567 | £69,656 | £51,951 | £44,962 |
| 2000-10 | £74,006 | £128,578 | £70,330 | £52,234 | £45,597 |
| 2000-11 | £74,852 | £130,126 | £71,079 | £52,801 | £46,262 |
| 2000-12 | £75,841 | £131,282 | £72,125 | £53,530 | £47,439 |
| 2001-01 | £76,383 | £132,176 | £72,520 | £54,001 | £48,011 |
| 2001-02 | £77,034 | £133,055 | £73,180 | £54,541 | £48,445 |
| 2001-03 | £77,683 | £134,315 | £73,810 | £54,988 | £48,554 |
| 2001-04 | £78,219 | £135,099 | £74,240 | £55,515 | £48,960 |
| 2001-05 | £78,858 | £135,798 | £74,891 | £56,143 | £49,351 |
| 2001-06 | £79,918 | £137,311 | £75,888 | £56,986 | £50,327 |
| 2001-07 | £81,149 | £139,566 | £77,112 | £57,782 | £50,914 |
| 2001-08 | £82,001 | £141,586 | £77,730 | £58,268 | £51,562 |
| 2001-09 | £83,259 | £144,491 | £78,702 | £59,049 | £52,229 |
| 2001-10 | £83,898 | £145,435 | £79,363 | £59,431 | £52,934 |
| 2001-11 | £84,783 | £146,699 | £80,365 | £59,965 | £53,662 |
| 2001-12 | £85,206 | £146,595 | £81,001 | £60,254 | £54,589 |
| 2002-01 | £85,463 | £147,097 | £81,228 | £60,376 | £54,910 |
| 2002-02 | £84,596 | £145,478 | £80,278 | £59,902 | £54,606 |
| 2002-03 | £85,493 | £146,962 | £81,131 | £60,641 | £54,942 |
| 2002-04 | £86,667 | £148,395 | £82,256 | £61,668 | £56,077 |
| 2002-05 | £90,268 | £153,984 | £85,894 | £64,284 | £58,454 |
| 2002-06 | £92,749 | £158,077 | £88,163 | £66,171 | £60,275 |
| 2002-07 | £96,082 | £164,017 | £91,310 | £68,561 | £62,012 |
| 2002-08 | £98,366 | £168,133 | £93,392 | £70,202 | £63,384 |
| 2002-09 | £99,976 | £171,114 | £95,056 | £71,185 | £64,023 |
| 2002-10 | £100,030 | £170,897 | £95,326 | £71,081 | £64,266 |
| 2002-11 | £100,767 | £172,211 | £96,045 | £71,522 | £64,850 |
| 2002-12 | £101,248 | £172,354 | £96,663 | £71,896 | £65,705 |
| 2003-01 | £103,505 | £176,099 | £98,612 | £73,746 | £67,315 |
| 2003-02 | £104,179 | £176,509 | £99,500 | £74,308 | £67,924 |
| 2003-03 | £105,723 | £179,272 | £100,873 | £75,485 | £68,791 |
| 2003-04 | £106,858 | £180,467 | £102,299 | £76,274 | £69,662 |
| 2003-05 | £109,258 | £184,185 | £104,613 | £78,188 | £71,133 |
| 2003-06 | £112,262 | £188,473 | £107,577 | £80,567 | £73,467 |
| 2003-07 | £115,575 | £193,673 | £110,833 | £83,130 | £75,403 |
| 2003-08 | £118,472 | £198,274 | £113,648 | £85,323 | £77,279 |
| 2003-09 | £121,147 | £202,736 | £116,263 | £87,380 | £78,430 |
| 2003-10 | £122,254 | £204,246 | £117,264 | £88,401 | £79,298 |
| 2003-11 | £125,136 | £208,687 | £120,139 | £90,596 | £81,102 |
| 2003-12 | £127,587 | £211,372 | £122,667 | £92,816 | £83,275 |
| 2004-01 | £130,249 | £215,789 | £125,170 | £94,815 | £85,006 |
| 2004-02 | £130,947 | £216,227 | £125,726 | £95,622 | £85,872 |
| 2004-03 | £131,535 | £217,287 | £126,077 | £96,136 | £86,114 |
| 2004-04 | £133,661 | £218,846 | £128,383 | £98,382 | £87,435 |
| 2004-05 | £137,520 | £223,460 | £132,226 | £101,906 | £90,012 |
| 2004-06 | £140,767 | £227,313 | £135,521 | £104,714 | £92,401 |
| 2004-07 | £143,702 | £231,746 | £138,519 | £106,999 | £93,999 |
| 2004-08 | £145,936 | £235,846 | £140,690 | £108,594 | £95,000 |
| 2004-09 | £148,448 | £240,628 | £143,099 | £110,377 | £96,030 |
| 2004-10 | £149,942 | £243,134 | £144,243 | £111,471 | £97,723 |
| 2004-11 | £152,620 | £247,235 | £146,724 | £113,491 | £99,930 |
| 2004-12 | £152,485 | £245,918 | £146,435 | £113,833 | £100,552 |
| 2005-01 | £153,429 | £247,382 | £147,050 | £114,813 | £101,426 |
| 2005-02 | £150,738 | £242,585 | £144,468 | £112,909 | £99,881 |
| 2005-03 | £151,715 | £244,096 | £145,509 | £113,587 | £100,350 |
| 2005-04 | £152,542 | £244,061 | £146,659 | £114,416 | £100,911 |
| 2005-05 | £154,414 | £246,833 | £148,335 | £116,131 | £102,045 |
| 2005-06 | £154,532 | £245,896 | £148,491 | £116,728 | £102,082 |
| 2005-07 | £155,956 | £248,616 | £149,897 | £117,863 | £102,432 |
| 2005-08 | £155,778 | £248,513 | £149,652 | £117,906 | £101,996 |
| 2005-09 | £158,487 | £253,721 | £152,066 | £119,918 | £103,473 |
| 2005-10 | £157,829 | £252,474 | £151,133 | £119,571 | £103,608 |
| 2005-11 | £159,833 | £255,143 | £153,117 | £121,128 | £105,176 |
| 2005-12 | £157,821 | £250,872 | £151,099 | £119,816 | £104,614 |
| 2006-01 | £156,849 | £249,473 | £150,119 | £119,253 | £103,628 |
| 2006-02 | £154,930 | £245,817 | £148,174 | £118,047 | £102,758 |
| 2006-03 | £156,493 | £248,863 | £149,818 | £119,141 | £103,162 |
| 2006-04 | £159,087 | £251,988 | £152,522 | £121,328 | £104,878 |
| 2006-05 | £161,209 | £255,392 | £154,722 | £122,923 | £105,858 |
| 2006-06 | £163,790 | £258,762 | £157,294 | £125,115 | £107,568 |
| 2006-07 | £164,444 | £260,289 | £157,779 | £125,773 | £107,503 |
| 2006-08 | £165,630 | £262,638 | £158,848 | £126,838 | £107,625 |
| 2006-09 | £164,260 | £261,445 | £157,466 | £125,718 | £106,050 |
| 2006-10 | £164,533 | £262,040 | £157,734 | £125,742 | £106,445 |
| 2006-11 | £165,785 | £263,986 | £159,037 | £126,626 | £107,206 |
| 2006-12 | £167,017 | £264,784 | £160,201 | £127,887 | £108,556 |
| 2007-01 | £168,896 | £267,898 | £161,958 | £129,418 | £109,555 |
| 2007-02 | £168,381 | £266,883 | £161,346 | £129,014 | £109,731 |
| 2007-03 | £169,242 | £268,803 | £162,172 | £129,630 | £109,817 |
| 2007-04 | £169,644 | £268,554 | £162,538 | £130,346 | £110,198 |
| 2007-05 | £170,586 | £269,197 | £163,426 | £131,482 | £110,863 |
| 2007-06 | £171,754 | £270,794 | £164,446 | £132,528 | £111,846 |
| 2007-07 | £173,450 | £274,455 | £166,000 | £133,607 | £112,596 |
| 2007-08 | £175,282 | £278,637 | £167,697 | £134,954 | £112,754 |
| 2007-09 | £175,410 | £279,871 | £167,720 | £134,819 | £112,529 |
| 2007-10 | £174,693 | £279,155 | £166,836 | £134,195 | £112,321 |
| 2007-11 | £173,932 | £278,104 | £166,039 | £133,343 | £112,403 |
| 2007-12 | £173,867 | £277,485 | £166,000 | £133,383 | £112,638 |
| 2008-01 | £174,251 | £278,508 | £166,328 | £133,525 | £112,898 |
| 2008-02 | £172,544 | £276,097 | £164,671 | £132,158 | £111,724 |
| 2008-03 | £171,730 | £275,425 | £164,009 | £131,455 | £110,566 |
| 2008-04 | £170,557 | £273,776 | £162,869 | £130,667 | £109,367 |
| 2008-05 | £171,076 | £274,100 | £163,486 | £131,312 | £109,488 |
| 2008-06 | £169,055 | £270,688 | £161,532 | £129,846 | £108,279 |
| 2008-07 | £166,957 | £267,041 | £159,855 | £128,083 | £106,753 |
| 2008-08 | £165,432 | £265,186 | £158,279 | £126,735 | £105,747 |
| 2008-09 | £164,158 | £265,093 | £156,664 | £125,266 | £104,681 |
| 2008-10 | £162,321 | £262,610 | £154,671 | £123,731 | £103,826 |
| 2008-11 | £157,836 | £255,592 | £150,439 | £120,111 | £100,986 |
| 2008-12 | £158,059 | £254,544 | £150,919 | £120,694 | £101,237 |
| 2009-01 | £155,159 | £250,473 | £147,924 | £118,298 | £99,632 |
| 2009-02 | £155,659 | £251,275 | £148,322 | £118,628 | £100,355 |
| 2009-03 | £151,532 | £244,860 | £144,275 | £115,233 | £98,332 |
| 2009-04 | £149,065 | £239,482 | £142,321 | £113,766 | £96,635 |
| 2009-05 | £148,501 | £237,876 | £141,998 | £113,749 | £95,752 |
| 2009-06 | £149,522 | £239,249 | £143,201 | £114,775 | £95,615 |
| 2009-07 | £153,018 | £245,331 | £146,632 | £117,517 | £96,844 |
| 2009-08 | £155,929 | £250,796 | £149,444 | £119,678 | £97,698 |
| 2009-09 | £157,303 | £253,415 | £150,771 | £120,659 | £98,135 |
| 2009-10 | £159,030 | £256,378 | £152,524 | £121,889 | £98,888 |
| 2009-11 | £161,357 | £260,283 | £154,644 | £123,796 | £100,202 |
| 2009-12 | £162,095 | £260,377 | £155,634 | £124,868 | £100,333 |
| 2010-01 | £162,555 | £262,093 | £156,160 | £124,977 | £99,618 |
| 2010-02 | £158,368 | £255,589 | £152,511 | £121,463 | £96,314 |
| 2010-03 | £159,267 | £258,813 | £153,128 | £121,485 | £96,536 |
| 2010-04 | £160,645 | £260,241 | £154,547 | £122,726 | £97,790 |
| 2010-05 | £161,440 | £261,441 | £155,117 | £123,500 | £98,552 |
| 2010-06 | £161,037 | £260,266 | £154,864 | £123,465 | £98,036 |
| 2010-07 | £158,874 | £257,552 | £152,641 | £121,756 | £96,159 |
| 2010-08 | £160,639 | £261,061 | £154,572 | £122,732 | £96,547 |
| 2010-09 | £161,839 | £264,252 | £155,594 | £123,287 | £96,753 |
| 2010-10 | £163,670 | £267,472 | £157,385 | £124,467 | £97,945 |
| 2010-11 | £163,101 | £267,060 | £156,638 | £123,871 | £97,814 |
| 2010-12 | £161,039 | £263,216 | £154,825 | £122,287 | £96,800 |
| 2011-01 | £158,818 | £260,180 | £152,467 | £120,486 | £95,536 |
| 2011-02 | £157,404 | £258,334 | £150,819 | £119,463 | £94,725 |
| 2011-03 | £157,811 | £260,197 | £150,842 | £119,526 | £94,925 |
| 2011-04 | £156,482 | £257,633 | £149,581 | £118,675 | £94,199 |
| 2011-05 | £156,252 | £256,113 | £149,565 | £118,637 | £94,550 |
| 2011-06 | £154,989 | £252,490 | £148,761 | £117,999 | £93,856 |
| 2011-07 | £157,616 | £256,348 | £151,352 | £120,035 | £95,671 |
| 2011-08 | £159,404 | £259,924 | £153,272 | £121,340 | £95,634 |
| 2011-09 | £159,742 | £261,519 | £153,462 | £121,468 | £95,270 |
| 2011-10 | £156,932 | £257,708 | £150,947 | £119,009 | £92,927 |
| 2011-11 | £153,458 | £251,959 | £147,462 | £116,250 | £91,522 |
| 2011-12 | £153,314 | £250,879 | £147,565 | £116,133 | £91,798 |
| 2012-01 | £155,214 | £253,314 | £149,498 | £117,859 | £92,840 |
| 2012-02 | £155,659 | £253,844 | £149,989 | £118,486 | £92,597 |
| 2012-03 | £156,662 | £254,790 | £150,951 | £119,688 | £93,367 |
| 2012-04 | £154,918 | £251,817 | £149,137 | £118,387 | £92,815 |
| 2012-05 | £157,254 | £255,206 | £151,459 | £120,215 | £94,505 |
| 2012-06 | £157,310 | £255,378 | £151,432 | £120,472 | £94,165 |
| 2012-07 | £158,155 | £256,690 | £152,183 | £121,390 | £94,321 |
| 2012-08 | £156,417 | £253,832 | £150,488 | £120,346 | £92,752 |
| 2012-09 | £156,561 | £254,902 | £150,472 | £120,181 | £92,667 |
| 2012-10 | £154,313 | £251,024 | £148,432 | £118,392 | £91,462 |
| 2012-11 | £155,131 | £252,487 | £149,184 | £118,871 | £92,179 |
| 2012-12 | £154,485 | £251,344 | £148,670 | £118,310 | £91,781 |
| 2013-01 | £155,197 | £252,775 | £149,504 | £118,728 | £91,697 |
| 2013-02 | £154,686 | £252,137 | £149,041 | £118,312 | £91,085 |
| 2013-03 | £154,954 | £253,073 | £149,237 | £118,312 | £91,169 |
| 2013-04 | £157,052 | £256,449 | £151,084 | £120,100 | £92,518 |
| 2013-05 | £158,176 | £257,932 | £152,226 | £121,014 | £93,411 |
| 2013-06 | £158,162 | £257,011 | £152,364 | £121,415 | £93,301 |
| 2013-07 | £158,272 | £257,061 | £152,435 | £121,611 | £93,385 |
| 2013-08 | £157,677 | £256,120 | £151,904 | £121,211 | £92,729 |
| 2013-09 | £158,355 | £258,120 | £152,390 | £121,448 | £92,948 |
| 2013-10 | £159,362 | £260,422 | £153,441 | £121,827 | £93,281 |
| 2013-11 | £160,908 | £263,054 | £155,049 | £122,811 | £94,177 |
| 2013-12 | £160,349 | £261,107 | £154,871 | £122,440 | £94,241 |
| 2014-01 | £159,032 | £258,554 | £153,627 | £121,570 | £93,665 |
| 2014-02 | £157,983 | £257,086 | £152,528 | £120,785 | £92,943 |
| 2014-03 | £157,404 | £256,269 | £151,976 | £120,368 | £92,334 |
| 2014-04 | £159,524 | £259,299 | £154,038 | £122,272 | £93,472 |
| 2014-05 | £161,384 | £261,577 | £155,905 | £123,990 | £94,722 |
| 2014-06 | £163,996 | £265,684 | £158,482 | £126,082 | £96,110 |
| 2014-07 | £164,746 | £266,940 | £159,280 | £126,680 | £96,281 |
| 2014-08 | £165,550 | £268,672 | £160,105 | £127,178 | £96,351 |
| 2014-09 | £168,276 | £273,404 | £162,595 | £129,270 | £97,889 |
| 2014-10 | £168,284 | £273,586 | £162,638 | £129,075 | £98,025 |
| 2014-11 | £169,082 | £274,929 | £163,446 | £129,510 | £98,730 |
| 2014-12 | £168,043 | £273,476 | £162,408 | £128,536 | £98,281 |
| 2015-01 | £169,046 | £275,256 | £163,392 | £129,175 | £98,920 |
| 2015-02 | £168,648 | £274,833 | £162,743 | £128,922 | £98,868 |
| 2015-03 | £167,584 | £273,511 | £161,757 | £127,856 | £98,167 |
| 2015-04 | £167,313 | £273,162 | £161,407 | £127,750 | £97,875 |
| 2015-05 | £167,419 | £273,018 | £161,817 | £127,773 | £97,797 |
| 2015-06 | £167,486 | £272,488 | £162,109 | £128,188 | £97,393 |
| 2015-07 | £169,095 | £274,742 | £163,932 | £129,422 | £98,211 |
| 2015-08 | £171,450 | £278,737 | £166,202 | £131,313 | £99,229 |
| 2015-09 | £174,522 | £284,718 | £168,888 | £133,338 | £101,110 |
| 2015-10 | £174,818 | £285,676 | £169,142 | £133,455 | £101,025 |
| 2015-11 | £174,069 | £284,705 | £168,489 | £132,681 | £100,556 |
| 2015-12 | £174,099 | £284,731 | £168,658 | £132,678 | £100,370 |
| 2016-01 | £174,542 | £285,333 | £169,301 | £132,860 | £100,649 |
| 2016-02 | £174,711 | £285,696 | £169,492 | £132,984 | £100,599 |
| 2016-03 | £174,683 | £285,740 | £169,429 | £132,873 | £100,730 |
| 2016-04 | £176,690 | £288,685 | £171,233 | £134,661 | £102,040 |
| 2016-05 | £180,284 | £293,708 | £174,530 | £137,709 | £104,862 |
| 2016-06 | £182,873 | £297,285 | £176,989 | £140,002 | £106,569 |
| 2016-07 | £182,222 | £296,321 | £176,236 | £139,559 | £106,217 |
| 2016-08 | £180,996 | £294,873 | £175,043 | £138,443 | £105,233 |
| 2016-09 | £181,517 | £296,028 | £175,731 | £138,544 | £105,412 |
| 2016-10 | £181,543 | £296,849 | £175,724 | £137,967 | £105,784 |
| 2016-11 | £181,829 | £298,364 | £175,964 | £137,604 | £105,987 |
| 2016-12 | £180,162 | £296,057 | £174,123 | £136,181 | £105,306 |
| 2017-01 | £179,558 | £295,328 | £173,448 | £135,749 | £104,785 |
| 2017-02 | £179,450 | £294,622 | £173,101 | £135,889 | £105,368 |
| 2017-03 | £179,437 | £294,697 | £173,041 | £135,776 | £105,544 |
| 2017-04 | £178,752 | £293,235 | £172,230 | £135,408 | £105,530 |
| 2017-05 | £180,613 | £295,548 | £174,407 | £136,829 | £106,690 |
| 2017-06 | £182,029 | £296,870 | £175,853 | £138,288 | £107,764 |
| 2017-07 | £185,866 | £302,563 | £179,832 | £141,170 | £110,197 |
| 2017-08 | £186,186 | £303,260 | £179,968 | £141,668 | £110,041 |
| 2017-09 | £186,540 | £304,665 | £180,268 | £141,723 | £109,803 |
| 2017-10 | £185,910 | £304,167 | £179,656 | £141,192 | £108,941 |
| 2017-11 | £188,016 | £307,895 | £181,893 | £142,474 | £110,057 |
| 2017-12 | £187,465 | £306,466 | £181,607 | £142,133 | £109,700 |
| 2018-01 | £186,214 | £304,474 | £180,492 | £141,087 | £108,897 |
| 2018-02 | £184,342 | £302,438 | £178,414 | £139,659 | £107,173 |
| 2018-03 | £187,464 | £308,251 | £181,450 | £141,974 | £108,300 |
| 2018-04 | £189,097 | £310,899 | £183,083 | £143,533 | £108,644 |
| 2018-05 | £189,023 | £310,149 | £183,403 | £143,704 | £108,188 |
| 2018-06 | £189,211 | £309,967 | £183,844 | £143,803 | £108,439 |
| 2018-07 | £190,627 | £312,552 | £185,141 | £144,801 | £109,217 |
| 2018-08 | £192,054 | £314,786 | £186,515 | £145,919 | £110,136 |
| 2018-09 | £193,472 | £317,634 | £187,778 | £147,012 | £110,503 |
| 2018-10 | £193,758 | £318,402 | £188,127 | £146,971 | £110,581 |
| 2018-11 | £192,817 | £317,274 | £187,267 | £146,054 | £109,756 |
| 2018-12 | £191,375 | £314,663 | £185,931 | £144,899 | £109,199 |
| 2019-01 | £190,540 | £313,548 | £185,174 | £144,079 | £108,609 |
| 2019-02 | £191,838 | £316,190 | £186,256 | £144,861 | £109,415 |
| 2019-03 | £192,309 | £317,176 | £186,775 | £145,101 | £109,403 |
| 2019-04 | £194,220 | £319,574 | £188,730 | £147,011 | £110,291 |
| 2019-05 | £194,400 | £318,959 | £189,142 | £147,525 | £110,259 |
| 2019-06 | £194,029 | £317,846 | £188,823 | £147,443 | £110,203 |
| 2019-07 | £194,672 | £319,036 | £189,331 | £147,937 | £110,653 |
| 2019-08 | £195,485 | £320,669 | £190,012 | £148,670 | £110,751 |
| 2019-09 | £197,017 | £323,451 | £191,149 | £150,101 | £111,557 |
| 2019-10 | £195,374 | £320,380 | £189,963 | £148,719 | £110,430 |
| 2019-11 | £194,983 | £319,715 | £189,914 | £148,058 | £110,201 |
| 2019-12 | £195,182 | £319,727 | £190,524 | £148,094 | £109,986 |
| 2020-01 | £196,794 | £322,869 | £191,987 | £149,311 | £110,517 |
| 2020-02 | £196,163 | £322,025 | £191,276 | £148,957 | £109,893 |
| 2020-03 | £196,127 | £322,610 | £191,160 | £148,704 | £109,681 |
| 2020-04 | £195,372 | £322,164 | £190,246 | £148,207 | £108,537 |
| 2020-05 | £196,713 | £324,504 | £191,651 | £148,975 | £109,362 |
| 2020-06 | £195,949 | £322,698 | £191,220 | £148,579 | £108,573 |
| 2020-07 | £197,246 | £323,868 | £192,672 | £149,661 | £109,886 |
| 2020-08 | £200,237 | £329,019 | £195,624 | £152,191 | £110,702 |
| 2020-09 | £204,288 | £336,821 | £199,298 | £155,116 | £112,437 |
| 2020-10 | £207,917 | £343,665 | £202,760 | £157,783 | £113,713 |
| 2020-11 | £208,983 | £345,585 | £203,620 | £158,682 | £114,339 |
| 2020-12 | £211,400 | £349,398 | £205,877 | £160,809 | £115,567 |
| 2021-01 | £212,235 | £348,699 | £206,939 | £161,981 | £117,080 |
| 2021-02 | £215,088 | £351,061 | £209,902 | £164,885 | £119,808 |
| 2021-03 | £218,400 | £354,036 | £213,287 | £168,141 | £123,043 |
| 2021-04 | £220,132 | £356,988 | £214,699 | £169,724 | £123,982 |
| 2021-05 | £219,812 | £357,084 | £214,243 | £169,407 | £123,452 |
| 2021-06 | £223,636 | £362,554 | £217,790 | £173,040 | £125,599 |
| 2021-07 | £222,143 | £360,383 | £216,588 | £171,596 | £124,398 |
| 2021-08 | £224,138 | £364,327 | £218,842 | £172,703 | £124,685 |
| 2021-09 | £221,778 | £361,412 | £216,819 | £170,312 | £122,570 |
| 2021-10 | £226,406 | £371,143 | £221,155 | £173,124 | £124,239 |
| 2021-11 | £226,891 | £372,542 | £221,603 | £173,270 | £124,233 |
| 2021-12 | £226,756 | £373,953 | £221,385 | £172,608 | £123,327 |
| 2022-01 | £226,777 | £372,594 | £221,805 | £173,133 | £123,082 |
| 2022-02 | £229,828 | £376,847 | £224,905 | £175,683 | £125,026 |
| 2022-03 | £231,633 | £379,736 | £227,039 | £176,826 | £125,691 |
| 2022-04 | £234,124 | £383,436 | £229,226 | £179,210 | £127,156 |
| 2022-05 | £235,845 | £386,009 | £231,002 | £180,831 | £127,513 |
| 2022-06 | £238,585 | £389,598 | £233,663 | £183,427 | £129,221 |
| 2022-07 | £241,753 | £394,246 | £237,130 | £186,012 | £130,423 |
| 2022-08 | £243,142 | £396,344 | £238,451 | £187,461 | £130,658 |
| 2022-09 | £246,519 | £402,230 | £241,732 | £190,207 | £131,674 |
| 2022-10 | £248,550 | £406,197 | £243,581 | £191,550 | £132,692 |
| 2022-11 | £252,270 | £412,890 | £247,129 | £194,168 | £134,605 |
| 2022-12 | £253,514 | £414,516 | £248,402 | £195,129 | £135,715 |
| 2023-01 | £252,592 | £413,251 | £247,745 | £194,140 | £134,875 |
| 2023-02 | £250,980 | £411,309 | £246,195 | £192,474 | £133,933 |
| 2023-03 | £245,410 | £403,766 | £240,917 | £187,254 | £130,379 |
| 2023-04 | £246,648 | £406,394 | £242,050 | £187,873 | £131,180 |
| 2023-05 | £246,072 | £404,584 | £241,647 | £187,461 | £131,279 |
| 2023-06 | £248,201 | £407,095 | £243,515 | £189,846 | £132,448 |
| 2023-07 | £247,163 | £404,483 | £242,698 | £189,519 | £131,601 |
| 2023-08 | £246,085 | £402,819 | £241,662 | £189,147 | £130,216 |
| 2023-09 | £246,023 | £402,712 | £241,703 | £189,219 | £129,833 |
| 2023-10 | £244,455 | £399,678 | £240,065 | £188,165 | £129,331 |
| 2023-11 | £245,655 | £402,090 | £241,338 | £188,593 | £130,184 |
| 2023-12 | £248,737 | £406,563 | £244,492 | £190,799 | £132,328 |
| 2024-01 | £250,854 | £410,598 | £246,471 | £192,381 | £133,210 |
| 2024-02 | £248,022 | £404,678 | £243,793 | £190,733 | £131,870 |
| 2024-03 | £245,513 | £400,739 | £241,074 | £188,811 | £130,917 |
| 2024-04 | £244,194 | £397,401 | £239,773 | £188,028 | £130,995 |
| 2024-05 | £248,397 | £403,694 | £243,897 | £191,357 | £133,631 |
| 2024-06 | £248,977 | £403,532 | £244,603 | £192,423 | £133,811 |
| 2024-07 | £249,199 | £403,745 | £244,921 | £193,069 | £133,176 |
| 2024-08 | £251,630 | £407,964 | £247,128 | £195,434 | £133,828 |
| 2024-09 | £251,900 | £409,858 | £247,545 | £195,215 | £132,960 |
| 2024-10 | £256,728 | £418,547 | £252,007 | £198,635 | £135,713 |
| 2024-11 | £257,220 | £419,623 | £252,925 | £198,578 | £135,584 |
| 2024-12 | £258,676 | £422,386 | £254,279 | £199,768 | £136,032 |
| 2025-01 | £257,619 | £421,071 | £253,710 | £198,861 | £134,388 |
| 2025-02 | £257,996 | £421,849 | £253,839 | £199,402 | £134,536 |
| 2025-03 | £261,312 | £424,034 | £257,218 | £202,902 | £137,918 |
| 2025-04 | £258,932 | £421,965 | £254,999 | £200,294 | £135,850 |
| 2025-05 | £253,969 | £414,677 | £250,265 | £196,221 | £132,512 |
| 2025-06 | £251,892 | £413,739 | £248,571 | £193,849 | £129,414 |
| 2025-07 | £255,532 | £417,128 | £252,337 | £197,839 | £131,645 |
| 2025-08 | £261,456 | £426,162 | £258,625 | £202,616 | £134,203 |
| 2025-09 | £264,380 | £431,429 | £261,592 | £204,992 | £134,887 |
| 2025-10 | £265,431 | £433,507 | £262,781 | £205,633 | £135,049 |
| 2025-11 | £265,396 | £433,416 | £262,545 | £205,865 | £135,041 |
| 2025-12 | £263,709 | £429,451 | £261,014 | £205,014 | £134,415 |
| 2026-01 | £267,691 | £434,844 | £265,235 | £208,748 | £136,016 |
| 2026-02 | £267,265 | £434,069 | £265,158 | £208,273 | £135,387 |
| 2026-03 | £267,724 | £435,102 | £265,997 | £208,676 | £134,535 |
- All property types
- Detached
- Semi-detached
- Terraced
- Flats
Source: HM Land Registry House Price Index
| Year | All property types | Detached | Semi-detached | Terraced | Flats |
|---|---|---|---|---|---|
| 1996-01 | -1.1% | -1.5% | -0.4% | -1.6% | -1.3% |
| 1996-02 | -2.6% | -2.1% | -2.4% | -3.3% | -3.5% |
| 1996-03 | -1.9% | -1.1% | -1.7% | -3.2% | -3.0% |
| 1996-04 | -4.0% | -3.1% | -3.9% | -5.1% | -4.9% |
| 1996-05 | -1.4% | -0.6% | -1.4% | -2.3% | -2.1% |
| 1996-06 | -0.3% | +0.5% | -0.5% | -0.7% | -0.9% |
| 1996-07 | +1.6% | +2.3% | +1.3% | +1.1% | +1.0% |
| 1996-08 | 0.0% | +0.7% | -0.1% | -0.6% | -0.5% |
| 1996-09 | -0.4% | +0.5% | -0.5% | -1.2% | -1.5% |
| 1996-10 | -0.9% | +0.1% | -1.1% | -1.6% | -2.7% |
| 1996-11 | +2.8% | +3.7% | +2.5% | +2.4% | +0.7% |
| 1996-12 | +3.9% | +4.5% | +3.7% | +3.7% | +1.5% |
| 1997-01 | +3.0% | +3.2% | +2.9% | +3.1% | +1.0% |
| 1997-02 | +2.8% | +3.3% | +2.6% | +2.6% | +1.0% |
| 1997-03 | +3.4% | +3.8% | +3.0% | +3.7% | +2.0% |
| 1997-04 | +7.7% | +8.2% | +7.3% | +7.8% | +6.0% |
| 1997-05 | +7.5% | +7.9% | +7.5% | +7.4% | +4.9% |
| 1997-06 | +7.8% | +8.4% | +7.9% | +7.3% | +3.4% |
| 1997-07 | +6.6% | +7.3% | +6.6% | +6.3% | +1.9% |
| 1997-08 | +7.2% | +7.8% | +7.3% | +7.1% | +2.7% |
| 1997-09 | +8.5% | +8.8% | +8.7% | +8.4% | +4.9% |
| 1997-10 | +9.4% | +9.7% | +9.6% | +9.2% | +6.3% |
| 1997-11 | +9.6% | +10.1% | +9.7% | +9.1% | +6.0% |
| 1997-12 | +8.8% | +9.6% | +8.9% | +8.1% | +5.5% |
| 1998-01 | +9.4% | +10.5% | +9.3% | +8.4% | +6.2% |
| 1998-02 | +8.3% | +9.1% | +8.3% | +7.5% | +6.2% |
| 1998-03 | +6.9% | +7.6% | +7.1% | +6.1% | +4.3% |
| 1998-04 | +5.5% | +6.1% | +5.8% | +4.6% | +2.9% |
| 1998-05 | +5.4% | +6.0% | +5.5% | +4.7% | +3.1% |
| 1998-06 | +5.7% | +6.3% | +5.7% | +5.1% | +5.0% |
| 1998-07 | +5.6% | +6.1% | +5.7% | +5.0% | +5.7% |
| 1998-08 | +5.1% | +5.6% | +5.1% | +4.4% | +5.2% |
| 1998-09 | +4.9% | +5.3% | +4.8% | +4.3% | +4.7% |
| 1998-10 | +4.3% | +4.8% | +4.2% | +3.8% | +4.4% |
| 1998-11 | +3.0% | +3.5% | +3.0% | +2.3% | +3.6% |
| 1998-12 | +2.7% | +3.2% | +2.6% | +2.1% | +3.8% |
| 1999-01 | +3.5% | +3.7% | +3.6% | +3.0% | +4.7% |
| 1999-02 | +5.1% | +5.2% | +5.2% | +4.7% | +5.4% |
| 1999-03 | +6.9% | +7.1% | +7.0% | +6.3% | +7.5% |
| 1999-04 | +7.6% | +7.8% | +7.4% | +7.3% | +8.4% |
| 1999-05 | +8.5% | +8.7% | +8.3% | +8.1% | +10.1% |
| 1999-06 | +9.5% | +9.7% | +9.3% | +9.4% | +10.3% |
| 1999-07 | +8.8% | +9.2% | +8.4% | +8.4% | +9.4% |
| 1999-08 | +9.2% | +9.5% | +8.9% | +9.2% | +10.0% |
| 1999-09 | +8.6% | +9.1% | +8.2% | +8.4% | +9.8% |
| 1999-10 | +10.0% | +10.3% | +9.7% | +9.7% | +11.4% |
| 1999-11 | +11.5% | +11.7% | +11.2% | +11.4% | +12.7% |
| 1999-12 | +13.0% | +13.0% | +12.7% | +13.1% | +14.1% |
| 2000-01 | +13.4% | +13.7% | +13.1% | +13.5% | +14.0% |
| 2000-02 | +14.0% | +14.4% | +13.5% | +13.9% | +14.7% |
| 2000-03 | +13.8% | +14.1% | +13.4% | +13.6% | +13.7% |
| 2000-04 | +14.3% | +14.6% | +13.9% | +14.0% | +15.1% |
| 2000-05 | +12.8% | +13.1% | +12.5% | +12.0% | +13.7% |
| 2000-06 | +10.7% | +10.9% | +10.6% | +9.7% | +12.3% |
| 2000-07 | +10.5% | +10.9% | +10.6% | +9.3% | +11.5% |
| 2000-08 | +10.6% | +11.1% | +10.8% | +8.9% | +12.1% |
| 2000-09 | +10.3% | +11.1% | +10.4% | +8.4% | +11.7% |
| 2000-10 | +10.5% | +11.3% | +10.7% | +8.6% | +11.9% |
| 2000-11 | +10.9% | +11.9% | +10.8% | +9.1% | +12.3% |
| 2000-12 | +11.7% | +12.6% | +11.6% | +9.8% | +13.6% |
| 2001-01 | +11.2% | +11.8% | +11.0% | +9.5% | +14.2% |
| 2001-02 | +11.0% | +11.3% | +10.9% | +9.5% | +13.9% |
| 2001-03 | +10.7% | +11.1% | +10.7% | +9.4% | +13.7% |
| 2001-04 | +9.3% | +10.0% | +9.1% | +7.9% | +11.3% |
| 2001-05 | +9.2% | +9.8% | +9.0% | +8.3% | +10.9% |
| 2001-06 | +10.6% | +11.1% | +10.2% | +9.9% | +12.5% |
| 2001-07 | +12.0% | +12.0% | +11.7% | +11.7% | +14.5% |
| 2001-08 | +12.2% | +12.2% | +11.7% | +12.1% | +14.8% |
| 2001-09 | +13.4% | +13.3% | +13.0% | +13.7% | +16.2% |
| 2001-10 | +13.4% | +13.1% | +12.8% | +13.8% | +16.1% |
| 2001-11 | +13.3% | +12.7% | +13.1% | +13.6% | +16.0% |
| 2001-12 | +12.3% | +11.7% | +12.3% | +12.6% | +15.1% |
| 2002-01 | +11.9% | +11.3% | +12.0% | +11.8% | +14.4% |
| 2002-02 | +9.8% | +9.3% | +9.7% | +9.8% | +12.7% |
| 2002-03 | +10.1% | +9.4% | +9.9% | +10.3% | +13.2% |
| 2002-04 | +10.8% | +9.8% | +10.8% | +11.1% | +14.5% |
| 2002-05 | +14.5% | +13.4% | +14.7% | +14.5% | +18.4% |
| 2002-06 | +16.1% | +15.1% | +16.2% | +16.1% | +19.8% |
| 2002-07 | +18.4% | +17.5% | +18.4% | +18.7% | +21.8% |
| 2002-08 | +20.0% | +18.7% | +20.1% | +20.5% | +22.9% |
| 2002-09 | +20.1% | +18.4% | +20.8% | +20.6% | +22.6% |
| 2002-10 | +19.2% | +17.5% | +20.1% | +19.6% | +21.4% |
| 2002-11 | +18.9% | +17.4% | +19.5% | +19.3% | +20.8% |
| 2002-12 | +18.8% | +17.6% | +19.3% | +19.3% | +20.4% |
| 2003-01 | +21.1% | +19.7% | +21.4% | +22.1% | +22.6% |
| 2003-02 | +23.1% | +21.3% | +23.9% | +24.0% | +24.4% |
| 2003-03 | +23.7% | +22.0% | +24.3% | +24.5% | +25.2% |
| 2003-04 | +23.3% | +21.6% | +24.4% | +23.7% | +24.2% |
| 2003-05 | +21.0% | +19.6% | +21.8% | +21.6% | +21.7% |
| 2003-06 | +21.0% | +19.2% | +22.0% | +21.8% | +21.9% |
| 2003-07 | +20.3% | +18.1% | +21.4% | +21.2% | +21.6% |
| 2003-08 | +20.4% | +17.9% | +21.7% | +21.5% | +21.9% |
| 2003-09 | +21.2% | +18.5% | +22.3% | +22.7% | +22.5% |
| 2003-10 | +22.2% | +19.5% | +23.0% | +24.4% | +23.4% |
| 2003-11 | +24.2% | +21.2% | +25.1% | +26.7% | +25.1% |
| 2003-12 | +26.0% | +22.6% | +26.9% | +29.1% | +26.7% |
| 2004-01 | +25.8% | +22.5% | +26.9% | +28.6% | +26.3% |
| 2004-02 | +25.7% | +22.5% | +26.4% | +28.7% | +26.4% |
| 2004-03 | +24.4% | +21.2% | +25.0% | +27.4% | +25.2% |
| 2004-04 | +25.1% | +21.3% | +25.5% | +29.0% | +25.5% |
| 2004-05 | +25.9% | +21.3% | +26.4% | +30.3% | +26.5% |
| 2004-06 | +25.4% | +20.6% | +26.0% | +30.0% | +25.8% |
| 2004-07 | +24.3% | +19.7% | +25.0% | +28.7% | +24.7% |
| 2004-08 | +23.2% | +18.9% | +23.8% | +27.3% | +22.9% |
| 2004-09 | +22.5% | +18.7% | +23.1% | +26.3% | +22.4% |
| 2004-10 | +22.6% | +19.0% | +23.0% | +26.1% | +23.2% |
| 2004-11 | +22.0% | +18.5% | +22.1% | +25.3% | +23.2% |
| 2004-12 | +19.5% | +16.3% | +19.4% | +22.6% | +20.7% |
| 2005-01 | +17.8% | +14.6% | +17.5% | +21.1% | +19.3% |
| 2005-02 | +15.1% | +12.2% | +14.9% | +18.1% | +16.3% |
| 2005-03 | +15.3% | +12.3% | +15.4% | +18.2% | +16.5% |
| 2005-04 | +14.1% | +11.5% | +14.2% | +16.3% | +15.4% |
| 2005-05 | +12.3% | +10.5% | +12.2% | +14.0% | +13.4% |
| 2005-06 | +9.8% | +8.2% | +9.6% | +11.5% | +10.5% |
| 2005-07 | +8.5% | +7.3% | +8.2% | +10.2% | +9.0% |
| 2005-08 | +6.7% | +5.4% | +6.4% | +8.6% | +7.4% |
| 2005-09 | +6.8% | +5.4% | +6.3% | +8.6% | +7.8% |
| 2005-10 | +5.3% | +3.8% | +4.8% | +7.3% | +6.0% |
| 2005-11 | +4.7% | +3.2% | +4.4% | +6.7% | +5.2% |
| 2005-12 | +3.5% | +2.0% | +3.2% | +5.3% | +4.0% |
| 2006-01 | +2.2% | +0.8% | +2.1% | +3.9% | +2.2% |
| 2006-02 | +2.8% | +1.3% | +2.6% | +4.6% | +2.9% |
| 2006-03 | +3.1% | +2.0% | +3.0% | +4.9% | +2.8% |
| 2006-04 | +4.3% | +3.2% | +4.0% | +6.0% | +3.9% |
| 2006-05 | +4.4% | +3.5% | +4.3% | +5.8% | +3.7% |
| 2006-06 | +6.0% | +5.2% | +5.9% | +7.2% | +5.4% |
| 2006-07 | +5.4% | +4.7% | +5.3% | +6.7% | +5.0% |
| 2006-08 | +6.3% | +5.7% | +6.1% | +7.6% | +5.5% |
| 2006-09 | +3.6% | +3.0% | +3.6% | +4.8% | +2.5% |
| 2006-10 | +4.2% | +3.8% | +4.4% | +5.2% | +2.7% |
| 2006-11 | +3.7% | +3.5% | +3.9% | +4.5% | +1.9% |
| 2006-12 | +5.8% | +5.5% | +6.0% | +6.7% | +3.8% |
| 2007-01 | +7.7% | +7.4% | +7.9% | +8.5% | +5.7% |
| 2007-02 | +8.7% | +8.6% | +8.9% | +9.3% | +6.8% |
| 2007-03 | +8.1% | +8.0% | +8.2% | +8.8% | +6.5% |
| 2007-04 | +6.6% | +6.6% | +6.6% | +7.4% | +5.1% |
| 2007-05 | +5.8% | +5.4% | +5.6% | +7.0% | +4.7% |
| 2007-06 | +4.9% | +4.6% | +4.5% | +5.9% | +4.0% |
| 2007-07 | +5.5% | +5.4% | +5.2% | +6.2% | +4.7% |
| 2007-08 | +5.8% | +6.1% | +5.6% | +6.4% | +4.8% |
| 2007-09 | +6.8% | +7.0% | +6.5% | +7.2% | +6.1% |
| 2007-10 | +6.2% | +6.5% | +5.8% | +6.7% | +5.5% |
| 2007-11 | +4.9% | +5.3% | +4.4% | +5.3% | +4.8% |
| 2007-12 | +4.1% | +4.8% | +3.6% | +4.3% | +3.8% |
| 2008-01 | +3.2% | +4.0% | +2.7% | +3.2% | +3.1% |
| 2008-02 | +2.5% | +3.5% | +2.1% | +2.4% | +1.8% |
| 2008-03 | +1.5% | +2.5% | +1.1% | +1.4% | +0.7% |
| 2008-04 | +0.5% | +1.9% | +0.2% | +0.2% | -0.8% |
| 2008-05 | +0.3% | +1.8% | 0.0% | -0.1% | -1.2% |
| 2008-06 | -1.6% | 0.0% | -1.8% | -2.0% | -3.2% |
| 2008-07 | -3.7% | -2.7% | -3.7% | -4.1% | -5.2% |
| 2008-08 | -5.6% | -4.8% | -5.6% | -6.1% | -6.2% |
| 2008-09 | -6.4% | -5.3% | -6.6% | -7.1% | -7.0% |
| 2008-10 | -7.1% | -5.9% | -7.3% | -7.8% | -7.6% |
| 2008-11 | -9.3% | -8.1% | -9.4% | -9.9% | -10.2% |
| 2008-12 | -9.1% | -8.3% | -9.1% | -9.5% | -10.1% |
| 2009-01 | -11.0% | -10.1% | -11.1% | -11.4% | -11.8% |
| 2009-02 | -9.8% | -9.0% | -9.9% | -10.2% | -10.2% |
| 2009-03 | -11.8% | -11.1% | -12.0% | -12.3% | -11.1% |
| 2009-04 | -12.6% | -12.5% | -12.6% | -12.9% | -11.6% |
| 2009-05 | -13.2% | -13.2% | -13.1% | -13.4% | -12.5% |
| 2009-06 | -11.6% | -11.6% | -11.3% | -11.6% | -11.7% |
| 2009-07 | -8.3% | -8.1% | -8.3% | -8.2% | -9.3% |
| 2009-08 | -5.7% | -5.4% | -5.6% | -5.6% | -7.6% |
| 2009-09 | -4.2% | -4.4% | -3.8% | -3.7% | -6.3% |
| 2009-10 | -2.0% | -2.4% | -1.4% | -1.5% | -4.8% |
| 2009-11 | +2.2% | +1.8% | +2.8% | +3.1% | -0.8% |
| 2009-12 | +2.6% | +2.3% | +3.1% | +3.5% | -0.9% |
| 2010-01 | +4.8% | +4.6% | +5.6% | +5.6% | 0.0% |
| 2010-02 | +1.7% | +1.7% | +2.8% | +2.4% | -4.0% |
| 2010-03 | +5.1% | +5.7% | +6.1% | +5.4% | -1.8% |
| 2010-04 | +7.8% | +8.7% | +8.6% | +7.9% | +1.2% |
| 2010-05 | +8.7% | +9.9% | +9.2% | +8.6% | +2.9% |
| 2010-06 | +7.7% | +8.8% | +8.1% | +7.6% | +2.5% |
| 2010-07 | +3.8% | +5.0% | +4.1% | +3.6% | -0.7% |
| 2010-08 | +3.0% | +4.1% | +3.4% | +2.6% | -1.2% |
| 2010-09 | +2.9% | +4.3% | +3.2% | +2.2% | -1.4% |
| 2010-10 | +2.9% | +4.3% | +3.2% | +2.1% | -1.0% |
| 2010-11 | +1.1% | +2.6% | +1.3% | +0.1% | -2.4% |
| 2010-12 | -0.7% | +1.1% | -0.5% | -2.1% | -3.5% |
| 2011-01 | -2.3% | -0.7% | -2.4% | -3.6% | -4.1% |
| 2011-02 | -0.6% | +1.1% | -1.1% | -1.6% | -1.6% |
| 2011-03 | -0.9% | +0.5% | -1.5% | -1.6% | -1.7% |
| 2011-04 | -2.6% | -1.0% | -3.2% | -3.3% | -3.7% |
| 2011-05 | -3.2% | -2.0% | -3.6% | -3.9% | -4.1% |
| 2011-06 | -3.8% | -3.0% | -3.9% | -4.4% | -4.3% |
| 2011-07 | -0.8% | -0.5% | -0.8% | -1.4% | -0.5% |
| 2011-08 | -0.8% | -0.4% | -0.8% | -1.1% | -0.9% |
| 2011-09 | -1.3% | -1.0% | -1.4% | -1.5% | -1.5% |
| 2011-10 | -4.1% | -3.7% | -4.1% | -4.4% | -5.1% |
| 2011-11 | -5.9% | -5.7% | -5.9% | -6.2% | -6.4% |
| 2011-12 | -4.8% | -4.7% | -4.7% | -5.0% | -5.2% |
| 2012-01 | -2.3% | -2.6% | -1.9% | -2.2% | -2.8% |
| 2012-02 | -1.1% | -1.7% | -0.6% | -0.8% | -2.2% |
| 2012-03 | -0.7% | -2.1% | +0.1% | +0.1% | -1.6% |
| 2012-04 | -1.0% | -2.3% | -0.3% | -0.2% | -1.5% |
| 2012-05 | +0.6% | -0.4% | +1.3% | +1.3% | 0.0% |
| 2012-06 | +1.5% | +1.1% | +1.8% | +2.1% | +0.3% |
| 2012-07 | +0.3% | +0.1% | +0.5% | +1.1% | -1.4% |
| 2012-08 | -1.9% | -2.3% | -1.8% | -0.8% | -3.0% |
| 2012-09 | -2.0% | -2.5% | -1.9% | -1.1% | -2.7% |
| 2012-10 | -1.7% | -2.6% | -1.7% | -0.5% | -1.6% |
| 2012-11 | +1.1% | +0.2% | +1.2% | +2.3% | +0.7% |
| 2012-12 | +0.8% | +0.2% | +0.7% | +1.9% | 0.0% |
| 2013-01 | 0.0% | -0.2% | 0.0% | +0.7% | -1.2% |
| 2013-02 | -0.6% | -0.7% | -0.6% | -0.1% | -1.6% |
| 2013-03 | -1.1% | -0.7% | -1.1% | -1.2% | -2.4% |
| 2013-04 | +1.4% | +1.8% | +1.3% | +1.4% | -0.3% |
| 2013-05 | +0.6% | +1.1% | +0.5% | +0.7% | -1.2% |
| 2013-06 | +0.5% | +0.6% | +0.6% | +0.8% | -0.9% |
| 2013-07 | +0.1% | +0.1% | +0.2% | +0.2% | -1.0% |
| 2013-08 | +0.8% | +0.9% | +0.9% | +0.7% | 0.0% |
| 2013-09 | +1.1% | +1.3% | +1.3% | +1.1% | +0.3% |
| 2013-10 | +3.3% | +3.7% | +3.4% | +2.9% | +2.0% |
| 2013-11 | +3.7% | +4.2% | +3.9% | +3.3% | +2.2% |
| 2013-12 | +3.8% | +3.9% | +4.2% | +3.5% | +2.7% |
| 2014-01 | +2.5% | +2.3% | +2.8% | +2.4% | +2.1% |
| 2014-02 | +2.1% | +2.0% | +2.3% | +2.1% | +2.0% |
| 2014-03 | +1.6% | +1.3% | +1.8% | +1.7% | +1.3% |
| 2014-04 | +1.6% | +1.1% | +2.0% | +1.8% | +1.0% |
| 2014-05 | +2.0% | +1.4% | +2.4% | +2.5% | +1.4% |
| 2014-06 | +3.7% | +3.4% | +4.0% | +3.8% | +3.0% |
| 2014-07 | +4.1% | +3.8% | +4.5% | +4.2% | +3.1% |
| 2014-08 | +5.0% | +4.9% | +5.4% | +4.9% | +3.9% |
| 2014-09 | +6.3% | +5.9% | +6.7% | +6.4% | +5.3% |
| 2014-10 | +5.6% | +5.1% | +6.0% | +5.9% | +5.1% |
| 2014-11 | +5.1% | +4.5% | +5.4% | +5.5% | +4.8% |
| 2014-12 | +4.8% | +4.7% | +4.9% | +5.0% | +4.3% |
| 2015-01 | +6.3% | +6.5% | +6.4% | +6.3% | +5.6% |
| 2015-02 | +6.8% | +6.9% | +6.7% | +6.7% | +6.4% |
| 2015-03 | +6.5% | +6.7% | +6.4% | +6.2% | +6.3% |
| 2015-04 | +4.9% | +5.3% | +4.8% | +4.5% | +4.7% |
| 2015-05 | +3.7% | +4.4% | +3.8% | +3.1% | +3.2% |
| 2015-06 | +2.1% | +2.6% | +2.3% | +1.7% | +1.3% |
| 2015-07 | +2.6% | +2.9% | +2.9% | +2.2% | +2.0% |
| 2015-08 | +3.6% | +3.7% | +3.8% | +3.3% | +3.0% |
| 2015-09 | +3.7% | +4.1% | +3.9% | +3.1% | +3.3% |
| 2015-10 | +3.9% | +4.4% | +4.0% | +3.4% | +3.1% |
| 2015-11 | +2.9% | +3.6% | +3.1% | +2.4% | +1.9% |
| 2015-12 | +3.6% | +4.1% | +3.8% | +3.2% | +2.1% |
| 2016-01 | +3.3% | +3.7% | +3.6% | +2.9% | +1.7% |
| 2016-02 | +3.6% | +4.0% | +4.1% | +3.2% | +1.8% |
| 2016-03 | +4.2% | +4.5% | +4.7% | +3.9% | +2.6% |
| 2016-04 | +5.6% | +5.7% | +6.1% | +5.4% | +4.3% |
| 2016-05 | +7.7% | +7.6% | +7.9% | +7.8% | +7.2% |
| 2016-06 | +9.2% | +9.1% | +9.2% | +9.2% | +9.4% |
| 2016-07 | +7.8% | +7.9% | +7.5% | +7.8% | +8.2% |
| 2016-08 | +5.6% | +5.8% | +5.3% | +5.4% | +6.1% |
| 2016-09 | +4.0% | +4.0% | +4.1% | +3.9% | +4.3% |
| 2016-10 | +3.8% | +3.9% | +3.9% | +3.4% | +4.7% |
| 2016-11 | +4.5% | +4.8% | +4.4% | +3.7% | +5.4% |
| 2016-12 | +3.5% | +4.0% | +3.2% | +2.6% | +4.9% |
| 2017-01 | +2.9% | +3.5% | +2.4% | +2.2% | +4.1% |
| 2017-02 | +2.7% | +3.1% | +2.1% | +2.2% | +4.7% |
| 2017-03 | +2.7% | +3.1% | +2.1% | +2.2% | +4.8% |
| 2017-04 | +1.2% | +1.6% | +0.6% | +0.6% | +3.4% |
| 2017-05 | +0.2% | +0.6% | -0.1% | -0.6% | +1.7% |
| 2017-06 | -0.5% | -0.1% | -0.6% | -1.2% | +1.1% |
| 2017-07 | +2.0% | +2.1% | +2.0% | +1.2% | +3.7% |
| 2017-08 | +2.9% | +2.8% | +2.8% | +2.3% | +4.6% |
| 2017-09 | +2.8% | +2.9% | +2.6% | +2.3% | +4.2% |
| 2017-10 | +2.4% | +2.5% | +2.2% | +2.3% | +3.0% |
| 2017-11 | +3.4% | +3.2% | +3.4% | +3.5% | +3.8% |
| 2017-12 | +4.1% | +3.5% | +4.3% | +4.4% | +4.2% |
| 2018-01 | +3.7% | +3.1% | +4.1% | +3.9% | +3.9% |
| 2018-02 | +2.7% | +2.7% | +3.1% | +2.8% | +1.7% |
| 2018-03 | +4.5% | +4.6% | +4.9% | +4.6% | +2.6% |
| 2018-04 | +5.8% | +6.0% | +6.3% | +6.0% | +3.0% |
| 2018-05 | +4.7% | +4.9% | +5.2% | +5.0% | +1.4% |
| 2018-06 | +3.9% | +4.4% | +4.5% | +4.0% | +0.6% |
| 2018-07 | +2.6% | +3.3% | +3.0% | +2.6% | -0.9% |
| 2018-08 | +3.2% | +3.8% | +3.6% | +3.0% | +0.1% |
| 2018-09 | +3.7% | +4.3% | +4.2% | +3.7% | +0.6% |
| 2018-10 | +4.2% | +4.7% | +4.7% | +4.1% | +1.5% |
| 2018-11 | +2.6% | +3.0% | +3.0% | +2.5% | -0.3% |
| 2018-12 | +2.1% | +2.7% | +2.4% | +1.9% | -0.5% |
| 2019-01 | +2.3% | +3.0% | +2.6% | +2.1% | -0.3% |
| 2019-02 | +4.1% | +4.5% | +4.4% | +3.7% | +2.1% |
| 2019-03 | +2.6% | +2.9% | +2.9% | +2.2% | +1.0% |
| 2019-04 | +2.7% | +2.8% | +3.1% | +2.4% | +1.5% |
| 2019-05 | +2.8% | +2.8% | +3.1% | +2.7% | +1.9% |
| 2019-06 | +2.5% | +2.5% | +2.7% | +2.5% | +1.6% |
| 2019-07 | +2.1% | +2.1% | +2.3% | +2.2% | +1.3% |
| 2019-08 | +1.8% | +1.9% | +1.9% | +1.9% | +0.6% |
| 2019-09 | +1.8% | +1.8% | +1.8% | +2.1% | +1.0% |
| 2019-10 | +0.8% | +0.6% | +1.0% | +1.2% | -0.1% |
| 2019-11 | +1.1% | +0.8% | +1.4% | +1.4% | +0.4% |
| 2019-12 | +2.0% | +1.6% | +2.5% | +2.2% | +0.7% |
| 2020-01 | +3.3% | +3.0% | +3.7% | +3.6% | +1.8% |
| 2020-02 | +2.3% | +1.8% | +2.7% | +2.8% | +0.4% |
| 2020-03 | +2.0% | +1.7% | +2.3% | +2.5% | +0.3% |
| 2020-04 | +0.6% | +0.8% | +0.8% | +0.8% | -1.6% |
| 2020-05 | +1.2% | +1.7% | +1.3% | +1.0% | -0.8% |
| 2020-06 | +1.0% | +1.5% | +1.3% | +0.8% | -1.5% |
| 2020-07 | +1.3% | +1.5% | +1.8% | +1.2% | -0.7% |
| 2020-08 | +2.4% | +2.6% | +3.0% | +2.4% | 0.0% |
| 2020-09 | +3.7% | +4.1% | +4.3% | +3.3% | +0.8% |
| 2020-10 | +6.4% | +7.3% | +6.7% | +6.1% | +3.0% |
| 2020-11 | +7.2% | +8.1% | +7.2% | +7.2% | +3.8% |
| 2020-12 | +8.3% | +9.3% | +8.1% | +8.6% | +5.1% |
| 2021-01 | +7.8% | +8.0% | +7.8% | +8.5% | +5.9% |
| 2021-02 | +9.6% | +9.0% | +9.7% | +10.7% | +9.0% |
| 2021-03 | +11.4% | +9.7% | +11.6% | +13.1% | +12.2% |
| 2021-04 | +12.7% | +10.8% | +12.9% | +14.5% | +14.2% |
| 2021-05 | +11.7% | +10.0% | +11.8% | +13.7% | +12.9% |
| 2021-06 | +14.1% | +12.4% | +13.9% | +16.5% | +15.7% |
| 2021-07 | +12.6% | +11.3% | +12.4% | +14.7% | +13.2% |
| 2021-08 | +11.9% | +10.7% | +11.9% | +13.5% | +12.6% |
| 2021-09 | +8.6% | +7.3% | +8.8% | +9.8% | +9.0% |
| 2021-10 | +8.9% | +8.0% | +9.1% | +9.7% | +9.3% |
| 2021-11 | +8.6% | +7.8% | +8.8% | +9.2% | +8.7% |
| 2021-12 | +7.3% | +7.0% | +7.5% | +7.3% | +6.7% |
| 2022-01 | +6.9% | +6.9% | +7.2% | +6.9% | +5.1% |
| 2022-02 | +6.9% | +7.3% | +7.1% | +6.5% | +4.4% |
| 2022-03 | +6.1% | +7.3% | +6.4% | +5.2% | +2.2% |
| 2022-04 | +6.4% | +7.4% | +6.8% | +5.6% | +2.6% |
| 2022-05 | +7.3% | +8.1% | +7.8% | +6.7% | +3.3% |
| 2022-06 | +6.7% | +7.5% | +7.3% | +6.0% | +2.9% |
| 2022-07 | +8.8% | +9.4% | +9.5% | +8.4% | +4.8% |
| 2022-08 | +8.5% | +8.8% | +9.0% | +8.5% | +4.8% |
| 2022-09 | +11.2% | +11.3% | +11.5% | +11.7% | +7.4% |
| 2022-10 | +9.8% | +9.4% | +10.1% | +10.6% | +6.8% |
| 2022-11 | +11.2% | +10.8% | +11.5% | +12.1% | +8.3% |
| 2022-12 | +11.8% | +10.8% | +12.2% | +13.0% | +10.0% |
| 2023-01 | +11.4% | +10.9% | +11.7% | +12.1% | +9.6% |
| 2023-02 | +9.2% | +9.1% | +9.5% | +9.6% | +7.1% |
| 2023-03 | +5.9% | +6.3% | +6.1% | +5.9% | +3.7% |
| 2023-04 | +5.3% | +6.0% | +5.6% | +4.8% | +3.2% |
| 2023-05 | +4.3% | +4.8% | +4.6% | +3.7% | +3.0% |
| 2023-06 | +4.0% | +4.5% | +4.2% | +3.5% | +2.5% |
| 2023-07 | +2.2% | +2.6% | +2.3% | +1.9% | +0.9% |
| 2023-08 | +1.2% | +1.6% | +1.3% | +0.9% | -0.3% |
| 2023-09 | -0.2% | +0.1% | 0.0% | -0.5% | -1.4% |
| 2023-10 | -1.6% | -1.6% | -1.4% | -1.8% | -2.5% |
| 2023-11 | -2.6% | -2.6% | -2.3% | -2.9% | -3.3% |
| 2023-12 | -1.9% | -1.9% | -1.6% | -2.2% | -2.5% |
| 2024-01 | -0.7% | -0.6% | -0.5% | -0.9% | -1.2% |
| 2024-02 | -1.2% | -1.6% | -1.0% | -0.9% | -1.5% |
| 2024-03 | 0.0% | -0.7% | +0.1% | +0.8% | +0.4% |
| 2024-04 | -1.0% | -2.2% | -0.9% | +0.1% | -0.1% |
| 2024-05 | +0.9% | -0.2% | +0.9% | +2.1% | +1.8% |
| 2024-06 | +0.3% | -0.9% | +0.4% | +1.4% | +1.0% |
| 2024-07 | +0.8% | -0.2% | +0.9% | +1.9% | +1.2% |
| 2024-08 | +2.3% | +1.3% | +2.3% | +3.3% | +2.8% |
| 2024-09 | +2.4% | +1.8% | +2.4% | +3.2% | +2.4% |
| 2024-10 | +5.0% | +4.7% | +5.0% | +5.6% | +4.9% |
| 2024-11 | +4.7% | +4.4% | +4.8% | +5.3% | +4.1% |
| 2024-12 | +4.0% | +3.9% | +4.0% | +4.7% | +2.8% |
| 2025-01 | +2.7% | +2.6% | +2.9% | +3.4% | +0.9% |
| 2025-02 | +4.0% | +4.2% | +4.1% | +4.5% | +2.0% |
| 2025-03 | +6.4% | +5.8% | +6.7% | +7.5% | +5.3% |
| 2025-04 | +6.0% | +6.2% | +6.4% | +6.5% | +3.7% |
| 2025-05 | +2.2% | +2.7% | +2.6% | +2.5% | -0.8% |
| 2025-06 | +1.2% | +2.5% | +1.6% | +0.7% | -3.3% |
| 2025-07 | +2.5% | +3.3% | +3.0% | +2.5% | -1.1% |
| 2025-08 | +3.9% | +4.5% | +4.7% | +3.7% | +0.3% |
| 2025-09 | +5.0% | +5.3% | +5.7% | +5.0% | +1.4% |
| 2025-10 | +3.4% | +3.6% | +4.3% | +3.5% | -0.5% |
| 2025-11 | +3.2% | +3.3% | +3.8% | +3.7% | -0.4% |
| 2025-12 | +1.9% | +1.7% | +2.6% | +2.6% | -1.2% |
| 2026-01 | +3.9% | +3.3% | +4.5% | +5.0% | +1.2% |
| 2026-02 | +3.6% | +2.9% | +4.5% | +4.4% | +0.6% |
| 2026-03 | +2.5% | +2.6% | +3.4% | +2.8% | -2.5% |
Sold House Prices in Chester
The average sold price across all property types in Cheshire West and Chester is £267,724, which is 7.7% below the England average of £289,946 as of March 2026. That discount is consistent across most property types, but it is not evenly distributed. Flats show a 37.3% discount to England, while detached houses are only 7.5% below. In the housing stock, detached homes are the largest category in every postcode and flats the smallest.
| Property Type | Cheshire West and Chester Average | England Average | Difference |
|---|---|---|---|
| Detached houses | £435,102 | £470,492 | -7.5% |
| Semi-detached houses | £265,997 | £288,185 | -7.7% |
| Terraced houses | £208,676 | £243,788 | -14.4% |
| Flats and maisonettes | £134,535 | £214,563 | -37.3% |
| All property types | £267,724 | £289,946 | -7.7% |
Detached houses at £435,102 carry the smallest discount at 7.5% below England's £470,492. Annual growth was 2.6% over the past year.
Semi-detached houses at £265,997 sit 7.7% below England's £288,185 and closely match the city-wide average. Semi-detached homes are 38.1% of the stock in CH2 (Hoole, Upton) and 32.8% in CH4 (Handbridge, Saltney). Across the authority, semi-detached prices rose 3.4% over the year, ahead of both detached houses and flats; CH4's Flintshire addresses sit outside that figure.
Terraced houses at £208,676 offer a 14.4% discount to England's £243,788. The terraced stock is concentrated in CH1 (City Centre, Blacon), where Victorian terraces in the city centre sit alongside post-war housing in Blacon. Annual growth of 2.8% puts terraced properties among the strongest performers in Chester.
Flats and maisonettes at £134,535 show the deepest discount at 37.3% below England's £214,563. Chester is not a flat-heavy city. Flats are the smallest category in every postcode, and annual change of -2.5% made them the one type to fall over the year.
Price Per Square Foot in Chester
Just £67 per square foot separates Chester's cheapest postcode from its most expensive, with CH1 at £253 and CH3 at £320. Price per square foot strips out the effect of property size and gives a cleaner comparison of location value. CH3 (Boughton, Christleton) commands the highest rate.
| Rank | Area | Price Per Sq Ft |
|---|---|---|
| 1 | CH1 (City Centre, Blacon) | £253 |
| 2 | CH4 (Handbridge, Saltney) | £282 |
| 3 | CH2 (Hoole, Upton) | £299 |
| 4 | CH3 (Boughton, Christleton) | £320 |
CH1 at £253 per square foot is the cheapest postcode for bricks-and-mortar value. This covers both the city centre (period conversions, smaller flats) and Blacon (a residential area with more affordable housing stock). The wide range within CH1 reflects that contrast. Based on 558 transactions analysed, CH1's price per square foot sits 21% below CH3's.
CH3's higher prices are not simply about buying larger homes: it also has Chester's highest price per square foot at £320. CH3 covers Christleton village, the rural fringe towards Tarvin and the residential streets of Boughton. The £320 figure is drawn from 698 transactions analysed.
For Sale Asking Prices in Chester
CH1 at £258,806 and CH3 at £444,352 sit 71.7% apart. That hierarchy mirrors sold prices, but the spread is more pronounced. The mean asking price across all four Chester postcodes is £339,728.
| Rank | Area | Asking Price |
|---|---|---|
| 1 | CH1 (City Centre, Blacon) | £258,806 |
| 2 | CH2 (Hoole, Upton) | £325,393 |
| 3 | CH4 (Handbridge, Saltney) | £330,362 |
| 4 | CH3 (Boughton, Christleton) | £444,352 |
CH1 at £258,806 is the only postcode where a buy-to-let purchase falls below the city-wide Land Registry average of £267,724. Moving from CH1's average asking price to CH2's adds £66,587, but the largest jump is the £113,990 between CH4 and CH3. The gap between CH1's £258,806 average asking price and CH3's £444,352 makes the postcode a large part of the upfront cost.
CH3's £444,352 asking price sits well above the comparison table below: Manchester's mean asking price is £268,032, so Chester's most expensive postcode costs 65.8% more than Manchester's average. CH3 carries the lowest yield of the four, as the rental data below shows.

House Price Growth in Chester
Only one Chester postcode posted positive growth across all three timeframes: CH2 at 4.8% (one-year), 3.3% (three-year), and 17.2% (five-year). All four postcodes delivered positive five-year returns, but the spread tells a story. CH1 (City Centre, Blacon) sits at the other end with negative one-year and three-year readings, despite a 4.1% five-year return.
| Area | 1 Year | 3 Years | 5 Years |
|---|---|---|---|
| CH2 (Hoole, Upton) | 4.8% | 3.3% | 17.2% |
| CH4 (Handbridge, Saltney) | 6.8% | -1.8% | 13.1% |
| CH3 (Boughton, Christleton) | -2.4% | -1.8% | 9.5% |
| CH1 (City Centre, Blacon) | -5.1% | -2.5% | 4.1% |
CH2 at 17.2% five-year growth has the highest five-year return in Chester. Hoole has independent shops, cafes, and easy walking distance to the city centre and station. CH2's prices are up over one, three and five years, whereas CH4's recent rise has not yet erased its three-year fall.
CH4 now has +6.8% one-year growth but -1.8% three-year growth. Handbridge and Saltney sit south of the river, with Saltney straddling the Welsh border. CH4's recent rise has not fully recovered its three-year fall, although prices remain 13.1% above their level five years ago.
CH1's -5.1% one-year reading is the weakest in Chester. The city-centre and Blacon stock saw the sharpest recent correction, though the five-year return of 4.1% remains positive.
Monthly Property Sales in Chester
Monthly sales range from 30 to 43 per postcode across Chester, 143 city-wide. The quietest postcode, CH4, records 30. Turnover is each month's sales measured against the homes currently for sale, not against every home in the postcode, and it runs from 13% in CH1 to 21% in CH2.
| Area | Sales Per Month | Turnover | Asking Price |
|---|---|---|---|
| CH3 (Boughton, Christleton) | 43 | 15% | £444,352 |
| CH2 (Hoole, Upton) | 39 | 21% | £325,393 |
| CH1 (City Centre, Blacon) | 31 | 13% | £258,806 |
| CH4 (Handbridge, Saltney) | 30 | 15% | £330,362 |
CH2's 21% turnover rate is the highest in Chester, ahead of CH3 and CH4 at 15% and CH1 at 13%, so its for-sale stock is worked through fastest relative to its size.
CH3 records the most transactions at 43 per month despite a 15% turnover rate, because those sales are set against more homes on the market than CH2's 39. CH1 has the lowest turnover at 13%, so the smallest share of its for-sale stock sells in any month.
How Long Properties Take to Sell in Chester
Selling times split Chester in two: homes in CH2 (Hoole, Upton) take an estimated 138 days to sell, while CH1 (City Centre, Blacon) is longest at an estimated 234 days. The days figure is an estimate from the current pace of sales, not a measured time from listing to completion; months of unsold stock is how many months of homes are on the market at that pace, from 4.5 in CH2 to 7.7 in CH1.
| Area | Avg Days to Sell | Months of Unsold Stock | Market |
|---|---|---|---|
| CH2 (Hoole, Upton) | 138 | 4.5 | Seller's market |
| CH3 (Boughton, Christleton) | 203 | 6.7 | Balanced market |
| CH4 (Handbridge, Saltney) | 203 | 6.7 | Balanced market |
| CH1 (City Centre, Blacon) | 234 | 7.7 | Balanced market |
A yield number says nothing about how long a sale is likely to take when you come to exit. Two postcodes can show a similar yield, but CH2's estimated 138 days and 4.5 months of unsold stock mean far fewer listings competing for each buyer than CH1's 234 days and 7.7 months.
What Type of Property Can You Buy in Chester?
Detached homes are the largest single category in every Chester postcode, from 39.5% of stock in CH2 to 52.6% in CH3, while terraced houses and flats are concentrated in CH1. The figures below are drawn from 2021 Census records for each postcode.
| Area | Detached | Semi-detached | Terraced | Flats |
|---|---|---|---|---|
| CH1 (City Centre, Blacon) | 42.2% | 30.7% | 16.4% | 8.3% |
| CH2 (Hoole, Upton) | 39.5% | 38.1% | 13.0% | 6.6% |
| CH3 (Boughton, Christleton) | 52.6% | 29.5% | 13.2% | 3.9% |
| CH4 (Handbridge, Saltney) | 47.3% | 32.8% | 14.3% | 5.6% |
CH1 holds the largest share of terraced houses at 16.4% and flats at 8.3%. That smaller-unit stock lines up with CH1 carrying the lowest asking price and the highest gross yield in the city. City-centre flats sit alongside the lower-cost terraced housing in Blacon.
CH3 is the most detached-dominated postcode at 52.6%, with the smallest share of flats at 3.9%. Detached and semi-detached houses together account for more than 80% of CH3's stock, which matches its premium asking prices and the lowest yield of the four postcodes. Its private rented share, 23.9%, is nonetheless the second-largest in the city.
Flats combine purpose-built and converted units. A small share of mobile and temporary dwellings is not shown, so rows may not total 100%.

Chester Rental Market Analysis
Monthly rents in Chester range from £1,021 in CH1 to £1,443 in CH3, with gross rental yields from 3.9% to 4.7% across all four postcodes. For investors asking whether rental property is a worthwhile investment in Chester, the sections below break down rents, yields, and tenant affordability postcode by postcode. If you are looking at starting a property business in the North West, Chester pairs above-average wages and 81.2% employment with lower yields than the higher-yielding North West cities in the comparison below. Browse current buy-to-let property for sale across the region.
Average Rent & Gross Rental Yields in Chester
Gross rental yields in Chester range from 3.9% in CH3 to 4.7% in CH1. The cheapest postcode delivers the highest yield and the most expensive delivers the lowest. CH3 now charges the highest monthly rent at £1,443 but ranks last for yield at 3.9% because its asking price of £444,352 is 71.7% higher than CH1's.
| Area | Average Monthly Rent | Asking Price | Gross Yield |
|---|---|---|---|
| CH1 (City Centre, Blacon) | £1,021 | £258,806 | 4.7% |
| CH4 (Handbridge, Saltney) | £1,262 | £330,362 | 4.6% |
| CH2 (Hoole, Upton) | £1,091 | £325,393 | 4.0% |
| CH3 (Boughton, Christleton) | £1,443 | £444,352 | 3.9% |
CH1 at 4.7% combines the lowest asking price with the lowest rent (£1,021) yet still delivers the best yield. A 30% deposit of £77,642 gets an investor into the highest-yielding postcode.
CH1 covers both the city centre and Blacon, and it holds the largest share of flats and terraces in the city.
CH3 at 3.9% sits at the bottom of Chester's yield table. The £1,443 monthly rent is the highest in the city, but the £444,352 asking price means the income return is still compressed.
Is Chester Rent High?
Monthly rents in Chester consume between 29.5% and 41.7% of the Cheshire West and Chester median gross monthly salary. The widely cited threshold for rent affordability is 30% of gross income. Only CH1 falls below that line, and the other three postcodes sit above it. The salary is the council area's, so for the Flintshire addresses in CH1 and CH4 it is a benchmark rather than a wage measured for those homes.
The median gross weekly salary in Chester is £797.80, which equates to £3,457 per month or £41,486 per year. This is above the North West regional median of £720.10 per week and the Great Britain median of £752.40 per week. Data from the Nomis Labour Market Profile (ASHE 2025).
| Rank | Area | Rent as % of Income |
|---|---|---|
| 1 | CH3 (Boughton, Christleton) | 41.7% |
| 2 | CH4 (Handbridge, Saltney) | 36.5% |
| 3 | CH2 (Hoole, Upton) | 31.6% |
| 4 | CH1 (City Centre, Blacon) | 29.5% |
CH1 at 29.5% is the lowest ratio: a monthly rent of £1,021 against the council-area monthly salary of £3,457, just under the 30% line.
CH3 at 41.7% is the least affordable. CH3 commands the highest rent in Chester at £1,443, and the ratio compares that whole-home rent with one median salary, so it says nothing about how many people share or what they earn.
How Big Is Chester's Private Rented Sector?
The private rented sector is deepest in CH3 and CH4, where it accounts for 23.9% and 24.3% of households, and shallowest in CH1 and CH2 at 13.6% and 13.9%. A larger private rented share tells you renting is more common in that postcode, not that more tenants are currently looking for a home. The table below shows household tenure by postcode.
| Area | Owned Outright | Owned with Mortgage | Private Rented | Social Rented |
|---|---|---|---|---|
| CH4 (Handbridge, Saltney) | 34.1% | 33.7% | 24.3% | 7.5% |
| CH3 (Boughton, Christleton) | 41.7% | 28.4% | 23.9% | 4.6% |
| CH2 (Hoole, Upton) | 44.4% | 33.6% | 13.9% | 7.6% |
| CH1 (City Centre, Blacon) | 42.5% | 35.2% | 13.6% | 7.9% |
CH3 and CH4 have the largest private rented sectors in Chester, close to a quarter of all households. That share is a different signal from yield: it shows how much already rents, not how quickly a home lets. CH3 pairs its deep rented sector with the city's lowest gross yield at 3.9%, while CH4 pairs a similar rented share with one of the higher yields at 4.6%. CH1 and CH2 have smaller rented sectors but higher owner-occupation, with CH2 showing the highest outright ownership at 44.4%.
The rental-demand sample, which sets the homes advertised to let against the number being let each month, is published for CH1 only; the rent and yield figures above cover all four postcodes. In CH1 the source rates that sample a tenant's market: around 68 homes were advertised to let against about 14 lettings a month, roughly 142 days' worth of lettings at the current pace, a stock-against-pace ratio rather than the time any one home took to let. The sample has no published reading for the other three postcodes in this snapshot.
Local Housing Allowance Rates in Chester
The English addresses in all four Chester postcodes fall within the West Cheshire Broad Rental Market Area, where Local Housing Allowance runs from £86.50 a week for a shared room to £281.69 a week for a four-bedroom home. Local Housing Allowance sets the maximum housing support a tenant on benefits can receive, so it caps the state's contribution, not the rent a landlord can charge. The rates below apply to the English side of every Chester postcode; the Welsh addresses in CH1 and CH4 take the rate for their own Welsh area instead. To check the current rate for a specific address, you can use the government's official Local Housing Allowance calculator.
| Property Size | Weekly LHA Rate | Monthly Equivalent |
|---|---|---|
| Shared accommodation | £86.50 | £375 |
| 1 bedroom | £126.58 | £549 |
| 2 bedrooms | £155.34 | £673 |
| 3 bedrooms | £182.96 | £793 |
| 4 bedrooms | £281.69 | £1,221 |
The two-bedroom LHA rate of £155.34 a week works out at about £673 a month. The £1,021 to £1,443 rents elsewhere on this page cover homes of all sizes, so they cannot be compared directly with a two-bedroom allowance, which caps the housing benefit contribution and leaves the tenant to cover any shortfall. The rates are identical across the English side of every Chester postcode because they are set for the whole West Cheshire market area; the Welsh addresses in CH1 and CH4 sit outside it.
Buy-to-Let Considerations
Are House Prices High in Chester? Price-to-Earnings Ratios
Purchasing a property in Chester requires between 6.2 and 10.7 times the median annual salary. This is based on the Nomis Labour Market Profile for Chester showing the median gross annual income for Chester residents is £41,486.
The national benchmark for price-to-earnings is 7.4x (England's average sold price of £289,946 divided by the Great Britain median annual salary of £39,125). One of Chester's four postcodes (CH1) sits below that national benchmark on the Cheshire West and Chester median salary.
| Rank | Area | Price-to-Earnings Ratio |
|---|---|---|
| 1 | CH1 (City Centre, Blacon) | 6.2x |
| 2 | CH2 (Hoole, Upton) | 7.8x |
| 3 | CH4 (Handbridge, Saltney) | 8.0x |
| 4 | CH3 (Boughton, Christleton) | 10.7x |
Against the same local salary, CH1's average asking price represents 6.2 years of gross earnings and CH3's 10.7, so the purchase budget changes a lot within Chester. CH1 is the lowest ratio against that council-area median, in an authority whose median wage and employment rate both sit above the North West figures; for CH1's Flintshire addresses the salary is a benchmark rather than a local measure.
CH3 at 10.7x sits well above the national benchmark. At more than ten times the council-area median salary, CH3 is the premium end of the city, and a high price against its rent compresses the yield.
Deposit Requirements in Chester
A 30% deposit on a buy-to-let property in Chester ranges from £77,642 in CH1 to £133,306 in CH3. The gap between the cheapest and most expensive deposit is £55,664. That is enough to fund more than two-thirds of a second deposit in CH1.
Beyond the deposit, the stamp duty and other buy to let costs affect the total capital required.
| Rank | Area | 30% Deposit Required |
|---|---|---|
| 1 | CH1 (City Centre, Blacon) | £77,642 |
| 2 | CH2 (Hoole, Upton) | £97,618 |
| 3 | CH4 (Handbridge, Saltney) | £99,109 |
| 4 | CH3 (Boughton, Christleton) | £133,306 |
CH1 is the cheapest way into Chester, at a £77,642 deposit. Stepping up to CH2 costs roughly £20,000 more. CH2 is Hoole and Upton, with the city's strongest five-year growth at 17.2%, a 4.0% yield and the highest turnover, where monthly sales run at 21% of the homes on the market.
At the other end, CH4 and CH2 are priced within £1,491 of each other, under 2% apart on the deposit, but they are not the same investment. They sit in different parts of the city, CH4 south of the river and CH2 to the east, and their figures differ. CH4 brings in higher rent, £1,262 a month against £1,091, while CH2 is up 3.3% over three years where CH4 is down 1.8%.

What the Chester Data Tells Buy-to-Let Investors
In Chester the cheapest way in is also the highest-yielding postcode. CH1 has the top yield at 4.7%, the lowest asking price for buying an investment property at £258,806, and the lowest price-to-earnings ratio against the council-area median at 6.2 times. A 30% deposit there is £77,642, the lowest in the city, for a home renting at £1,021 a month.
CH2 is the one postcode that grew in every period we looked at: up 4.8% over a year, 3.3% over three years and 17.2% over five. It also has the highest turnover, with monthly sales at 21% of the homes on its market, though CH3 records more sales at 43 a month against CH2's 39. The yield is lower at 4.0% and the deposit higher at £97,618, so CH2 is where five-year growth peaks while the yield sits third of the four.
CH4 has grown fastest over the past year at 6.8%, though it is still down 1.8% over three years, so that recent jump sits on top of a softer medium-term record. CH3 carries the highest rent at £1,443 a month, but with a 3.9% yield and a 10.7 times price-to-earnings ratio, the premium price is doing more for the rent than for the return. Homes sold before they reach the portals are covered in our guide to off-market properties.
Chester has no selective licence for private landlords. With above-average wages, an 81.2% employment rate and a broad local economy, it pairs lower headline yields than Liverpool or Manchester with wages and an employment rate above the North West averages.
How Chester Compares
Chester's mean asking price of £339,728 is the highest of five North West locations compared here, yet its top yield of 4.7% matches Warrington's at the bottom of the table. The comparison below places Chester alongside four nearby locations, each with a different investor profile. The mean asking price and mean monthly rent are simple averages across all postcodes with data. Top gross yield is the single highest postcode yield in each location.
| Location | Mean Asking Price | Mean Monthly Rent | Mean Gross Yield | Top Yield (postcode) |
|---|---|---|---|---|
| Liverpool | £210,314 | £904 | 5.2% | 8.0% (L2) |
| Stoke-on-Trent | £239,223 | £828 | 4.2% | 6.7% (ST1) |
| Manchester | £268,032 | £1,312 | 5.9% | 8.1% (M14) |
| Warrington | £311,729 | £1,068 | 4.1% | 4.7% (WA5) |
| Chester | £339,728 | £1,204 | 4.3% | 4.7% (CH1) |
Chester is the most expensive location in this comparison at £339,728 mean asking price, and its top yield of 4.7% matches Warrington's 4.7% at the bottom of the table. Both Chester and Warrington sit at the Cheshire end of the table: higher prices and lower yields than Liverpool or Manchester.
Liverpool at 8.0% and investment property in Manchester at 8.1% show far higher top yields. Liverpool also has the lowest mean asking price in the table at £210,314, with Stoke-on-Trent at 6.7% the next cheapest at £239,223. Chester and Warrington sit together at the higher-price, lower-yield end. For a data-driven comparison across all UK locations, see our best buy-to-let areas guide.
Frequently Asked Questions
Is Chester a good place to live for buy-to-let tenants?
On the local figures, Chester's employment rate is 81.2%, well above the regional 74.2% and the national 75.6%, and the typical wage is £797.80 a week against roughly £720 across the North West.
It is also a compact, walkable city with fast trains to both Liverpool and Manchester.
What are the best areas in Chester for property investment?
The four postcodes split fairly cleanly. CH1 (City Centre and Blacon) is the cheapest way in at £258,806 and carries the highest yield at 4.7%. CH2 (Hoole and Upton) is the only postcode that has grown across one, three and five years (4.8%, 3.3% and 17.2%) and has the highest turnover.
At the top end, CH3 (Boughton and Christleton) is the premium spot at £444,352 and the lowest yield at 3.9%, while CH4 (Handbridge and Saltney) has grown fastest over the past year at 6.8% but is still down 1.8% over three. CH1 leads on yield and price; CH2 is the one postcode with growth positive across every timeframe.
How does Chester compare to Liverpool for buy-to-let?
Liverpool is the higher-yield, lower-cost end: a top postcode yield of 8.0% against Chester's 4.7%, a mean yield of 5.2% against 4.3%, and a mean asking price of £210,314, roughly 38% cheaper than Chester's £339,728.
Chester's £797.80 median weekly wage and 81.2% employment rate are above the North West averages; the comparison table carries no wage or employment figures for Liverpool, so it cannot rank the two on those measures.
Is there demand for student accommodation in Chester?
Yes. The University of Chester's main Parkgate Road campus sits in CH1, which carries the city's lowest average rent at £1,021 a month; where its students rent is not something this page measures. For the purpose-built end of the market, see our guide to student accommodation for sale.
On the HMO side, a sample of current CH1 room adverts puts a double with a shared bathroom at around £141 a week, with most between £115 and £165 (the middle 80% of 41 adverts). That was the only room type with enough live adverts for a reliable figure, so ensuite and single-room rents in Chester are harder to pin down. For how the numbers work on a shared house, see our complete guide to investing in HMOs.
Can I find buy-to-let property under £250,000 in Chester?
Not on average anywhere now. The cheapest postcode is CH1 (City Centre and Blacon) at £258,806, so the city as a whole has edged just above £250,000. The way in below that is by property type rather than postcode: CH1 holds the city's largest shares of terraces and flats, and flats across Cheshire West and Chester average £134,535 on the Land Registry index, a county average rather than the price of any current Chester flat. Neither figure prices a specific CH1 flat or terrace. Homes offered under their market price are covered in our guide to below market value property.
When will the Northgate development affect Chester property prices?
Phase 2 has no homes on the ground yet. It is the part planned to deliver over 400 homes, and the council signed a pre-development agreement for it in November 2025 covering masterplanning, feasibility and funding work; that announcement gives no build or completion dates. Phase 1, the market, cinema and restaurant complex, has been open since 2022.
Whether or how prices respond to Phase 2 is not something this guide's data measures; what it records is the agreement and the planned scale.
What are average house prices in Chester?
The average sold price across Cheshire West and Chester is £267,724 on the Land Registry index, about 7.7% below the England average of £289,946 as of March 2026. Asking prices by postcode run from £258,806 in CH1 (City Centre, Blacon) up to £444,352 in CH3 (Boughton, Christleton), with a city-wide mean of £339,728. By type, detached homes average £435,102, semi-detached £265,997, terraced £208,676 and flats £134,535.
Through a buy-to-let lens, CH1 is the cheapest entry and the highest-yielding at 4.7%, while CH3 is the dearest and lowest-yielding.
What are the Local Housing Allowance rates in Chester?
The English addresses in all four Chester postcodes fall in the West Cheshire Broad Rental Market Area, so they share one set of rates, while the Welsh addresses in CH1 and CH4 take their own Welsh area's rate. As of June 2026, Local Housing Allowance runs at £86.50 a week for a shared room, £126.58 for a one-bed, £155.34 for two beds, £182.96 for three and £281.69 for four. That figure is the most a tenant on housing support can claim towards rent, so any rent above it comes from the tenant's own income.
What type of property is most common in Chester?
Detached houses in every postcode, though only just in CH2, where 39.5% detached sits beside 38.1% semi-detached. They run from 39.5% of the stock in CH2 up to 52.6% in CH3. Terraces and flats are most concentrated in CH1, at 16.4% and 8.3%. CH3 sits at the other end, with the most detached houses and the fewest flats at just 3.9%.
How do I buy an investment property in Chester?
CH1 (City Centre, Blacon) is the cheapest entry at £258,806 and the highest-yielding at 4.7%, while CH2 (Hoole, Upton) pairs a 4.0% yield with the strongest five-year growth at 17.2%. A 30% deposit runs from £77,642 in CH1 to £133,306 in CH3.
Beyond what is listed openly, off market properties and BMV property are covered in their own guides. To see what is available now, browse investment properties or buy-to-let homes for sale.
Ready to buy property?
Browse investment properties with prices and gross yields shown for each opportunity.
Get property alerts