
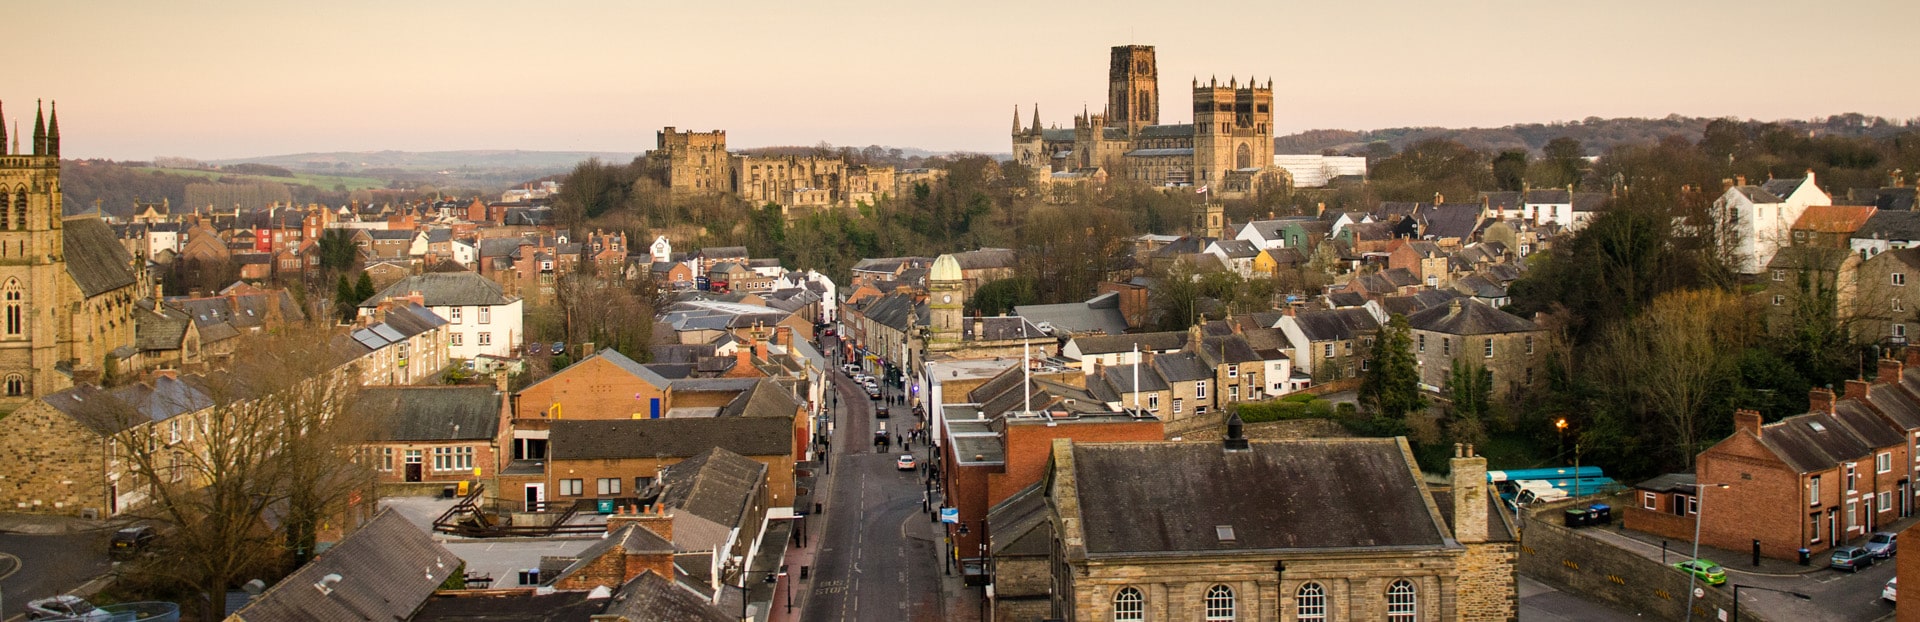
Durham is a cathedral city in County Durham, north-east England. Average sold prices across County Durham sit at £135,767 on the HM Land Registry House Price Index, 53.2% below the England average of £289,946 and 16.0% below the North East regional average of £161,629. That places County Durham among the most affordable markets in England, where an investor buys more than twice the property per pound compared with the national figure. The local authority's population grew 1.72% between the 2011 and 2021 censuses, from 513,242 to 522,068 residents.
County Durham's low prices come with rental yields that hold their ground. Gross yields run from 4.6% in DH8 (Consett) up to 5.5% in both DH7 (Brandon) and DH9 (Stanley), and six of the seven postcodes covered here sit above 4.8%. The median gross weekly salary across County Durham is £643.00, below the North East's £669.90 and Great Britain's £752.40, so very affordable house prices meeting steady rents is what keeps the income return intact across the county.
This guide covers seven County Durham postcodes (ONS code E06000047) from the cathedral city in DH1 out to the former mining towns of Stanley and Consett in the north-west and Coxhoe and Bowburn to the south. Investors comparing options in the region may also look at Newcastle, Sunderland, and Middlesbrough, all measured against Durham later in this guide.
Article updated: July 2026

Why Invest in Durham?
County Durham, the local authority the cathedral city sits within, grew its population 1.72% between the 2011 and 2021 censuses, from 513,242 to 522,068 residents. That is slower than the England and Wales average of 6.3%, which reflects a large, mixed authority of former mining towns, market towns, and rural villages rather than a single fast-growing urban centre. Growth here reads as retention rather than speculative inward migration.
The local employment rate is 73.0%, below both the North East average and Great Britain's 75.6%, and unemployment sits at 4.8%. What matters more for rental demand is the shape of the employment base after the pits closed. The NHS, Durham County Council, and Durham University are the largest employers. Hitachi Rail builds Intercity Express trains at Newton Aycliffe, and Amazon runs a large fulfilment centre at Bowburn in DH6. None of these are single-industry towns any more, and a broader employment base absorbs the shock when one employer restructures.
Median gross annual earnings in County Durham are £33,436, which is below the North East regional median and 14.5% below the Great Britain median of £39,125. Lower local wages cap what buyers and tenants can pay, and that is a large part of why prices stay so low. The counterweight is that rents hold up relative to those prices, which is what produces yields above 4.8% in six of the seven postcodes.
Durham Economic Summary
- Population (County Durham): 522,068 (2021 Census). Growth of 1.72% from 2011.
- Median annual salary: £33,436 (County Durham), £34,835 (North East), £39,125 (Great Britain)
- Employment rate: 73.0% (County Durham), 75.6% (Great Britain)
- Unemployment rate: 4.8% (County Durham)
- Key employment sectors: Health and social work (NHS), education, public administration, advanced manufacturing (Hitachi Rail), logistics (Amazon)
Source: ONS Census 2021, Nomis Labour Market Profile (ASHE 2025)
Durham University adds a layer of demand that most affordable markets do not have. It is a Russell Group institution with more than 21,000 students, concentrated heavily in DH1, and its second and third-year undergraduates rent in the private sector around the city centre and Gilesgate. That student demand, funded externally through loans and family support, is largely insulated from the local wage picture, which is why DH1 behaves differently from the rest of the county in almost every table below.
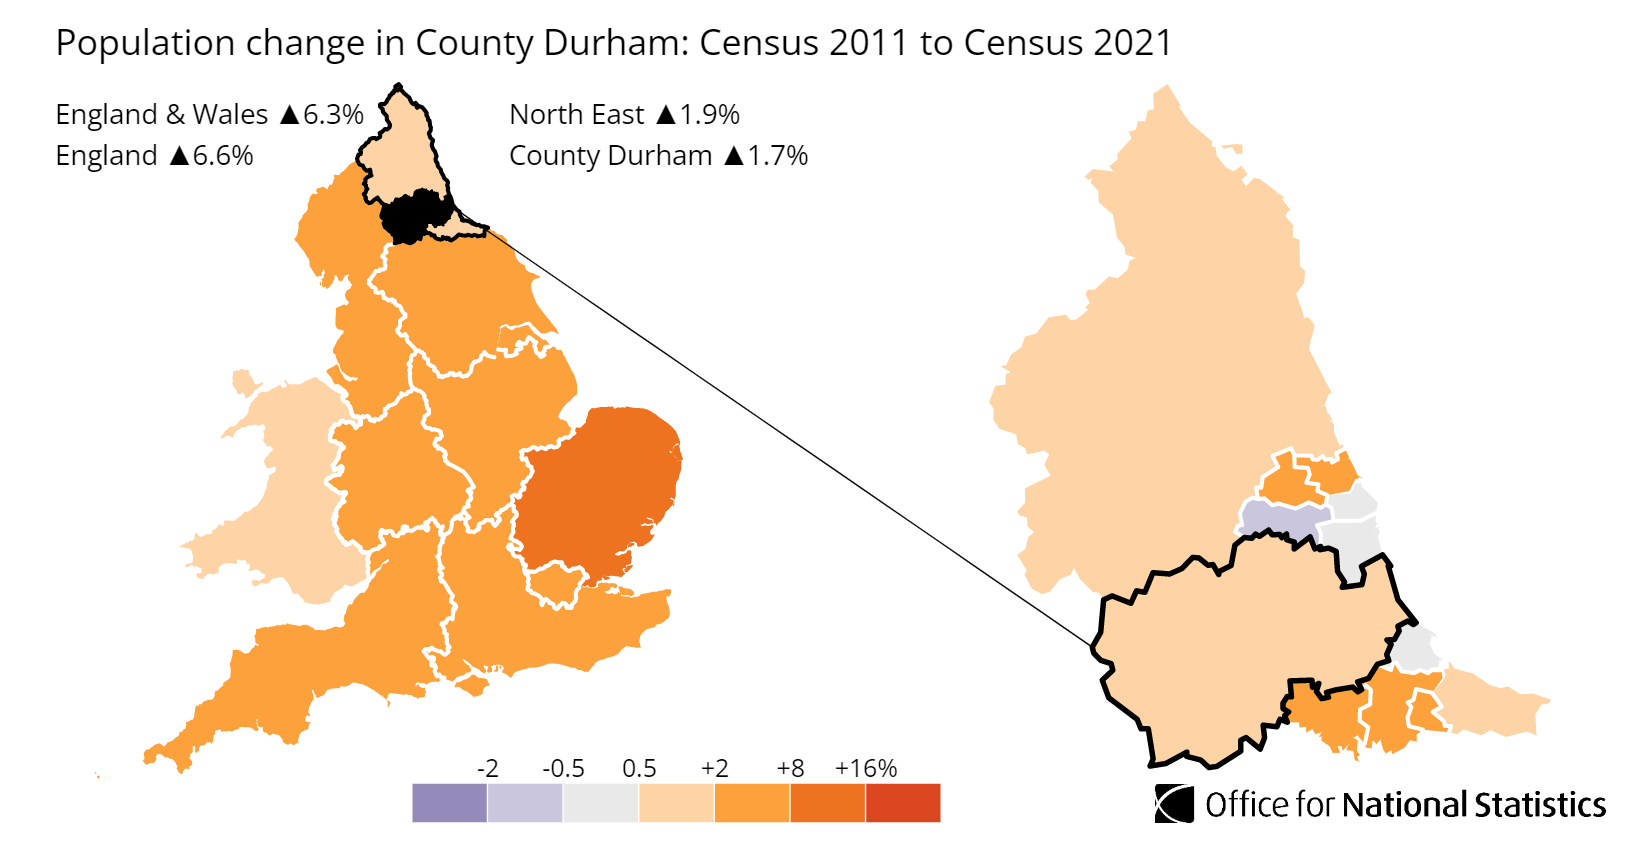
Source: Office for National Statistics - Population for County Durham
Regeneration and Investment in Durham
County Durham's regeneration is led by the council and central government rather than private developers chasing speculative returns. The money is going into town centres that lost their economic base decades ago and into building the cathedral city's knowledge economy.
- Durham City Aykley Heads and Milburngate (underway, £55m+ confirmed): An employment-led programme combining the Milburngate mixed-use riverside site with the Aykley Heads business park, aiming to create thousands of city-centre jobs. A city-centre employment hub of that scale draws young professionals into DH1, the same postcode where student demand is already strongest. Updates at Durham County Council.
- Town centre regeneration funding (approved, up to £60m over 10 years): Central government funding for high street regeneration and community infrastructure in areas including Stanley (DH9) and Crook, at up to £20m per area over a decade. Sustained public investment into town centres lifts local amenity in the streets around them, which supports rents in the DH9 and DH7 markets that already carry the county's higher yields. Updates at Durham County Council.
- Horden Numbered Streets Regeneration (planning approved, £10.7m): Council-led clearance of derelict terraced housing in East Durham and replacement with 105 new affordable homes, funded by Durham County Council (£6.2m) and the North East Combined Authority Brownfield Housing Fund (£4.5m). Wholesale rebuild of a run-down area is a marker of long-term commitment to the county's cheapest terraced markets. Updates at Durham County Council.
County Durham Property Market Analysis
Average property prices in County Durham have risen 264.8% since January 1995, from £37,213 to £135,767. The sections below break down that journey cycle by cycle, then drill into current postcode-level data for sold prices, price per square foot, asking prices, growth trends, and monthly transaction volumes.
When was the last house price crash in Durham?
County Durham's sold prices from HM Land Registry are recorded at unitary-authority level, running from January 1995 to the latest reading in March 2026. The series shows one deep crash, an unusually long trough, and a late pandemic-era recovery that only cleared the old peak in the last few years.
The 2000 to 2007 boom: County Durham started 2000 at £42,999. Cheap credit and a national housing boom then lifted prices to a peak of £118,371 by October 2007, a rise of 175.3% in under eight years. That was a stretch for an area with these wages, and it set up a hard fall.
2008 to 2009, the financial crisis: From the October 2007 peak of £118,371 prices dropped to £97,717 by April 2009, a fall of 17.4% in eighteen months. The worst year-on-year reading was -14.8% in April 2009. Every property type fell together: detached -14.5%, semi-detached -14.4%, terraced -15.1%, and flats -13.8% (April 2009 readings).
The extended trough, 2010 to 2014: This is where County Durham parts company with southern England. Prices bounced to £103,709 by January 2010, then drifted back down for four more years. The real low came in March 2014 at £87,820, well below the 2009 reading. The full peak-to-trough decline from October 2007 to March 2014 was 25.8%. Markets like London and Bristol were already past their old peaks by then; County Durham was still falling.
The slow recovery, 2015 to 2019: Growth returned at a crawl. Prices reached £91,473 by March 2015 and were still only £99,299 by December 2019, which left the county 16.1% below its October 2007 peak more than twelve years on.
2020 to 2022, the pandemic surge: The stamp duty holiday and the shift to remote working finally broke the deadlock. Prices climbed from £98,291 in January 2020 to £129,312 by November 2022, a rise of 31.6% in under three years, as buyers chased the county's extreme affordability.
The 2023 rate shock: Higher mortgage rates cooled the market. Prices eased from £129,312 in November 2022 to £124,857 by November 2023, a dip of 3.4%. That was mild set against the 2008 fall.
2024 to present: Prices recovered to £133,069 by December 2024 and reached an all-time high of £141,494 in December 2025, before easing to £135,767 by March 2026. The county now sits 14.7% above its October 2007 pre-crash peak. It took roughly seventeen years for the market to move decisively past that old high.
Long-term growth summary:
- 5 years (March 2021 to March 2026): 22.0% growth (£111,253 to £135,767)
- 10 years (March 2016 to March 2026): 42.6% growth (£95,186 to £135,767)
- 15 years (March 2011 to March 2026): 42.9% growth (£94,998 to £135,767)
- 20 years (March 2006 to March 2026): 27.6% growth (£106,391 to £135,767)
- 30 years (March 1996 to March 2026): 264.8% growth (£37,213 to £135,767)
The 2008 crash is the reference point for anyone weighing downside here. A 25.8% peak-to-trough fall that took roughly seventeen years to fully recover is a sobering record, and the county's affordability did not shield it from a deep percentage decline. What it did shield was the pound figure: prices were low in absolute terms, so the fall left the market at £87,820 rather than wiping out large sums per property. The employment base is broader now than it was in 2007, which is a different backdrop from the single-industry towns of the coalfield era.
- All property types
- Detached
- Semi-detached
- Terraced
- Flats
Source: HM Land Registry House Price Index
| Year | All property types | Detached | Semi-detached | Terraced | Flats |
|---|---|---|---|---|---|
| 1995-01 | £38,128 | £68,828 | £37,754 | £30,403 | £28,150 |
| 1995-02 | £37,704 | £67,692 | £37,570 | £30,014 | £27,838 |
| 1995-03 | £37,617 | £67,351 | £37,472 | £29,994 | £27,728 |
| 1995-04 | £37,134 | £66,260 | £37,032 | £29,636 | £27,382 |
| 1995-05 | £37,492 | £66,779 | £37,337 | £29,982 | £27,598 |
| 1995-06 | £37,891 | £67,579 | £37,806 | £30,233 | £27,998 |
| 1995-07 | £38,565 | £69,012 | £38,454 | £30,743 | £28,357 |
| 1995-08 | £37,918 | £68,286 | £37,765 | £30,165 | £27,745 |
| 1995-09 | £37,331 | £67,275 | £37,099 | £29,745 | £27,156 |
| 1995-10 | £36,894 | £66,621 | £36,777 | £29,295 | £26,954 |
| 1995-11 | £37,119 | £67,046 | £37,071 | £29,414 | £27,338 |
| 1995-12 | £37,639 | £68,064 | £37,701 | £29,742 | £27,772 |
| 1996-01 | £37,621 | £68,358 | £37,680 | £29,666 | £27,617 |
| 1996-02 | £37,730 | £68,631 | £37,839 | £29,723 | £27,487 |
| 1996-03 | £37,213 | £67,911 | £37,350 | £29,253 | £27,056 |
| 1996-04 | £37,341 | £67,812 | £37,411 | £29,461 | £27,250 |
| 1996-05 | £38,181 | £69,055 | £38,160 | £30,240 | £27,890 |
| 1996-06 | £39,104 | £70,692 | £38,998 | £31,018 | £28,690 |
| 1996-07 | £38,958 | £70,629 | £38,900 | £30,842 | £28,410 |
| 1996-08 | £38,658 | £70,542 | £38,572 | £30,527 | £28,077 |
| 1996-09 | £38,097 | £69,825 | £37,985 | £30,049 | £27,414 |
| 1996-10 | £38,680 | £70,985 | £38,584 | £30,480 | £27,794 |
| 1996-11 | £38,808 | £71,036 | £38,752 | £30,593 | £27,971 |
| 1996-12 | £38,910 | £70,939 | £38,888 | £30,716 | £28,037 |
| 1997-01 | £38,621 | £70,379 | £38,575 | £30,513 | £27,789 |
| 1997-02 | £37,671 | £68,885 | £37,621 | £29,715 | £27,072 |
| 1997-03 | £37,516 | £68,715 | £37,416 | £29,600 | £26,989 |
| 1997-04 | £37,681 | £68,796 | £37,608 | £29,773 | £27,070 |
| 1997-05 | £38,553 | £70,111 | £38,513 | £30,524 | £27,537 |
| 1997-06 | £39,456 | £71,835 | £39,442 | £31,217 | £27,980 |
| 1997-07 | £40,481 | £73,933 | £40,397 | £32,028 | £28,489 |
| 1997-08 | £40,888 | £74,977 | £40,753 | £32,308 | £28,693 |
| 1997-09 | £40,347 | £74,108 | £40,181 | £31,872 | £28,279 |
| 1997-10 | £39,613 | £72,855 | £39,486 | £31,240 | £27,874 |
| 1997-11 | £39,211 | £72,143 | £39,105 | £30,903 | £27,596 |
| 1997-12 | £39,530 | £72,733 | £39,522 | £31,093 | £27,837 |
| 1998-01 | £39,791 | £73,512 | £39,731 | £31,260 | £27,962 |
| 1998-02 | £39,455 | £72,992 | £39,440 | £30,940 | £27,910 |
| 1998-03 | £39,333 | £72,843 | £39,298 | £30,849 | £27,761 |
| 1998-04 | £39,324 | £72,466 | £39,366 | £30,893 | £27,738 |
| 1998-05 | £39,832 | £73,183 | £39,804 | £31,396 | £27,913 |
| 1998-06 | £40,139 | £73,736 | £40,046 | £31,664 | £28,291 |
| 1998-07 | £40,369 | £74,366 | £40,256 | £31,806 | £28,412 |
| 1998-08 | £40,781 | £75,444 | £40,636 | £32,071 | £28,627 |
| 1998-09 | £40,969 | £75,907 | £40,802 | £32,214 | £28,575 |
| 1998-10 | £40,754 | £75,681 | £40,605 | £31,982 | £28,580 |
| 1998-11 | £40,385 | £75,131 | £40,332 | £31,602 | £28,450 |
| 1998-12 | £40,303 | £74,879 | £40,356 | £31,493 | £28,632 |
| 1999-01 | £40,145 | £74,542 | £40,231 | £31,363 | £28,508 |
| 1999-02 | £39,637 | £73,481 | £39,745 | £30,987 | £28,131 |
| 1999-03 | £39,425 | £73,203 | £39,548 | £30,788 | £27,949 |
| 1999-04 | £39,552 | £73,093 | £39,656 | £30,997 | £28,010 |
| 1999-05 | £40,230 | £74,170 | £40,285 | £31,607 | £28,479 |
| 1999-06 | £40,983 | £75,443 | £40,977 | £32,271 | £28,960 |
| 1999-07 | £41,787 | £77,237 | £41,682 | £32,880 | £29,429 |
| 1999-08 | £42,849 | £79,396 | £42,652 | £33,718 | £30,072 |
| 1999-09 | £42,611 | £79,281 | £42,325 | £33,497 | £29,810 |
| 1999-10 | £42,713 | £79,572 | £42,538 | £33,470 | £30,079 |
| 1999-11 | £42,524 | £79,213 | £42,437 | £33,264 | £30,083 |
| 1999-12 | £43,161 | £80,192 | £43,123 | £33,771 | £30,757 |
| 2000-01 | £42,999 | £80,049 | £42,925 | £33,635 | £30,481 |
| 2000-02 | £43,150 | £80,556 | £43,073 | £33,692 | £30,550 |
| 2000-03 | £42,883 | £80,153 | £42,880 | £33,430 | £30,147 |
| 2000-04 | £43,324 | £80,628 | £43,283 | £33,865 | £30,668 |
| 2000-05 | £43,400 | £80,611 | £43,414 | £33,920 | £30,864 |
| 2000-06 | £43,964 | £81,592 | £43,967 | £34,362 | £31,508 |
| 2000-07 | £44,676 | £83,461 | £44,722 | £34,772 | £31,834 |
| 2000-08 | £45,327 | £85,128 | £45,378 | £35,155 | £32,381 |
| 2000-09 | £44,800 | £84,693 | £44,795 | £34,640 | £31,937 |
| 2000-10 | £43,765 | £82,804 | £43,838 | £33,761 | £31,412 |
| 2000-11 | £43,360 | £82,128 | £43,402 | £33,435 | £31,211 |
| 2000-12 | £43,683 | £82,494 | £43,806 | £33,672 | £31,739 |
| 2001-01 | £43,734 | £82,631 | £43,816 | £33,720 | £31,826 |
| 2001-02 | £43,437 | £81,956 | £43,561 | £33,499 | £31,579 |
| 2001-03 | £42,795 | £80,843 | £42,870 | £33,018 | £30,929 |
| 2001-04 | £43,255 | £81,541 | £43,240 | £33,454 | £31,337 |
| 2001-05 | £43,471 | £81,575 | £43,412 | £33,728 | £31,527 |
| 2001-06 | £44,453 | £83,320 | £44,388 | £34,499 | £32,464 |
| 2001-07 | £44,938 | £84,347 | £44,926 | £34,825 | £32,761 |
| 2001-08 | £46,058 | £86,914 | £45,996 | £35,610 | £33,625 |
| 2001-09 | £46,673 | £88,488 | £46,510 | £36,050 | £34,001 |
| 2001-10 | £47,152 | £89,462 | £47,000 | £36,390 | £34,475 |
| 2001-11 | £47,110 | £89,290 | £46,996 | £36,349 | £34,589 |
| 2001-12 | £46,908 | £88,573 | £46,929 | £36,170 | £34,868 |
| 2002-01 | £46,578 | £88,055 | £46,598 | £35,882 | £34,780 |
| 2002-02 | £46,356 | £87,753 | £46,315 | £35,713 | £34,668 |
| 2002-03 | £46,816 | £88,539 | £46,736 | £36,120 | £34,826 |
| 2002-04 | £47,734 | £89,966 | £47,578 | £36,921 | £35,777 |
| 2002-05 | £49,129 | £92,118 | £49,023 | £38,071 | £36,951 |
| 2002-06 | £50,051 | £93,827 | £49,902 | £38,801 | £37,810 |
| 2002-07 | £51,226 | £96,094 | £51,079 | £39,710 | £38,453 |
| 2002-08 | £51,976 | £97,638 | £51,774 | £40,288 | £39,013 |
| 2002-09 | £52,684 | £99,118 | £52,526 | £40,785 | £39,426 |
| 2002-10 | £53,653 | £100,805 | £53,620 | £41,488 | £40,315 |
| 2002-11 | £54,854 | £103,128 | £54,826 | £42,389 | £41,364 |
| 2002-12 | £56,004 | £104,830 | £56,083 | £43,309 | £42,479 |
| 2003-01 | £56,808 | £106,158 | £56,711 | £44,059 | £43,221 |
| 2003-02 | £57,427 | £107,034 | £57,363 | £44,576 | £43,827 |
| 2003-03 | £58,683 | £109,548 | £58,513 | £45,565 | £44,808 |
| 2003-04 | £60,226 | £112,126 | £60,234 | £46,728 | £46,088 |
| 2003-05 | £61,252 | £113,699 | £61,337 | £47,573 | £46,705 |
| 2003-06 | £62,691 | £115,811 | £62,770 | £48,816 | £47,928 |
| 2003-07 | £64,199 | £118,143 | £64,368 | £50,067 | £48,809 |
| 2003-08 | £66,457 | £121,834 | £66,674 | £51,915 | £50,518 |
| 2003-09 | £67,964 | £124,253 | £68,247 | £53,166 | £51,262 |
| 2003-10 | £68,956 | £125,731 | £69,104 | £54,088 | £52,144 |
| 2003-11 | £69,756 | £126,991 | £69,850 | £54,794 | £52,734 |
| 2003-12 | £71,221 | £128,686 | £71,259 | £56,185 | £54,251 |
| 2004-01 | £72,344 | £130,605 | £72,383 | £57,106 | £54,959 |
| 2004-02 | £72,282 | £129,950 | £72,353 | £57,160 | £54,893 |
| 2004-03 | £73,268 | £131,803 | £73,232 | £57,958 | £55,349 |
| 2004-04 | £75,864 | £134,623 | £75,864 | £60,386 | £57,216 |
| 2004-05 | £80,578 | £141,401 | £80,391 | £64,549 | £60,849 |
| 2004-06 | £84,485 | £147,112 | £84,378 | £67,867 | £63,965 |
| 2004-07 | £87,741 | £152,264 | £87,724 | £70,572 | £66,177 |
| 2004-08 | £89,774 | £155,908 | £89,717 | £72,219 | £67,460 |
| 2004-09 | £91,745 | £159,394 | £91,540 | £73,887 | £68,549 |
| 2004-10 | £92,990 | £162,040 | £92,424 | £74,912 | £69,942 |
| 2004-11 | £93,632 | £163,083 | £93,049 | £75,437 | £70,611 |
| 2004-12 | £94,785 | £164,487 | £94,091 | £76,519 | £71,802 |
| 2005-01 | £94,230 | £163,520 | £93,498 | £76,096 | £71,320 |
| 2005-02 | £95,677 | £166,051 | £94,989 | £77,233 | £72,364 |
| 2005-03 | £95,320 | £165,567 | £94,856 | £76,833 | £71,755 |
| 2005-04 | £97,280 | £168,204 | £97,050 | £78,470 | £72,983 |
| 2005-05 | £98,468 | £169,942 | £98,141 | £79,551 | £73,710 |
| 2005-06 | £100,118 | £171,432 | £99,626 | £81,235 | £74,889 |
| 2005-07 | £101,246 | £173,109 | £100,737 | £82,227 | £75,504 |
| 2005-08 | £102,904 | £175,709 | £102,277 | £83,693 | £76,518 |
| 2005-09 | £104,315 | £178,658 | £103,545 | £84,816 | £77,320 |
| 2005-10 | £104,466 | £178,880 | £103,437 | £85,046 | £77,662 |
| 2005-11 | £104,578 | £178,881 | £103,532 | £85,182 | £77,770 |
| 2005-12 | £105,235 | £179,349 | £104,037 | £85,869 | £78,813 |
| 2006-01 | £107,231 | £182,686 | £105,946 | £87,563 | £80,072 |
| 2006-02 | £106,788 | £181,297 | £105,395 | £87,348 | £80,073 |
| 2006-03 | £106,391 | £181,017 | £105,181 | £86,905 | £79,210 |
| 2006-04 | £106,232 | £180,021 | £105,007 | £86,933 | £79,018 |
| 2006-05 | £106,882 | £180,839 | £105,717 | £87,517 | £79,213 |
| 2006-06 | £109,574 | £184,534 | £108,277 | £89,939 | £81,257 |
| 2006-07 | £109,979 | £184,919 | £108,573 | £90,421 | £81,199 |
| 2006-08 | £111,660 | £187,754 | £110,243 | £91,860 | £81,818 |
| 2006-09 | £110,784 | £186,734 | £109,405 | £91,091 | £80,651 |
| 2006-10 | £111,333 | £188,045 | £109,994 | £91,419 | £81,268 |
| 2006-11 | £111,119 | £187,575 | £109,821 | £91,243 | £81,132 |
| 2006-12 | £112,109 | £188,280 | £110,738 | £92,247 | £82,174 |
| 2007-01 | £111,929 | £187,732 | £110,507 | £92,202 | £81,790 |
| 2007-02 | £111,438 | £186,896 | £109,914 | £91,818 | £81,807 |
| 2007-03 | £111,147 | £186,694 | £109,577 | £91,577 | £81,162 |
| 2007-04 | £111,562 | £186,610 | £109,882 | £92,111 | £81,450 |
| 2007-05 | £113,325 | £188,648 | £111,526 | £93,769 | £82,776 |
| 2007-06 | £113,654 | £188,874 | £111,754 | £94,126 | £83,202 |
| 2007-07 | £115,694 | £192,828 | £113,742 | £95,740 | £84,547 |
| 2007-08 | £116,707 | £195,343 | £114,660 | £96,564 | £84,410 |
| 2007-09 | £117,802 | £197,773 | £115,680 | £97,412 | £85,012 |
| 2007-10 | £118,371 | £199,201 | £116,175 | £97,805 | £85,662 |
| 2007-11 | £118,180 | £199,057 | £115,983 | £97,559 | £86,073 |
| 2007-12 | £117,944 | £198,631 | £115,701 | £97,363 | £86,183 |
| 2008-01 | £115,616 | £194,840 | £113,380 | £95,433 | £84,531 |
| 2008-02 | £115,186 | £194,592 | £113,039 | £94,961 | £84,152 |
| 2008-03 | £113,555 | £192,234 | £111,690 | £93,489 | £82,435 |
| 2008-04 | £114,630 | £194,471 | £112,729 | £94,367 | £82,822 |
| 2008-05 | £115,156 | £194,639 | £113,313 | £94,928 | £82,946 |
| 2008-06 | £116,308 | £196,212 | £114,303 | £96,003 | £83,876 |
| 2008-07 | £116,554 | £196,312 | £114,792 | £96,149 | £83,946 |
| 2008-08 | £116,034 | £195,766 | £114,218 | £95,704 | £83,493 |
| 2008-09 | £114,076 | £194,156 | £112,192 | £93,850 | £82,063 |
| 2008-10 | £111,120 | £189,550 | £109,368 | £91,285 | £80,061 |
| 2008-11 | £106,934 | £182,831 | £105,415 | £87,659 | £77,254 |
| 2008-12 | £104,222 | £177,046 | £102,871 | £85,588 | £75,148 |
| 2009-01 | £102,356 | £174,416 | £100,820 | £84,032 | £74,080 |
| 2009-02 | £99,489 | £169,637 | £97,961 | £81,675 | £72,203 |
| 2009-03 | £98,697 | £168,823 | £97,233 | £80,846 | £72,304 |
| 2009-04 | £97,717 | £166,277 | £96,497 | £80,133 | £71,417 |
| 2009-05 | £99,397 | £168,676 | £98,166 | £81,664 | £72,260 |
| 2009-06 | £99,491 | £168,414 | £98,366 | £81,868 | £71,598 |
| 2009-07 | £100,096 | £169,494 | £98,883 | £82,477 | £71,437 |
| 2009-08 | £101,057 | £171,501 | £99,832 | £83,254 | £71,497 |
| 2009-09 | £103,117 | £175,325 | £101,775 | £84,952 | £72,762 |
| 2009-10 | £105,080 | £178,684 | £103,830 | £86,526 | £73,866 |
| 2009-11 | £105,238 | £179,033 | £103,822 | £86,760 | £73,813 |
| 2009-12 | £105,786 | £178,837 | £104,459 | £87,493 | £73,730 |
| 2010-01 | £103,709 | £175,922 | £102,306 | £85,753 | £71,801 |
| 2010-02 | £102,731 | £174,557 | £101,640 | £84,751 | £70,688 |
| 2010-03 | £101,846 | £174,528 | £100,772 | £83,663 | £70,122 |
| 2010-04 | £102,261 | £174,705 | £101,334 | £84,031 | £70,551 |
| 2010-05 | £102,745 | £175,313 | £101,554 | £84,613 | £71,115 |
| 2010-06 | £102,652 | £174,530 | £101,419 | £84,742 | £70,740 |
| 2010-07 | £103,020 | £175,560 | £101,752 | £85,005 | £70,577 |
| 2010-08 | £104,533 | £178,722 | £103,529 | £85,988 | £71,193 |
| 2010-09 | £104,560 | £179,788 | £103,545 | £85,794 | £70,951 |
| 2010-10 | £104,350 | £179,952 | £103,389 | £85,453 | £70,949 |
| 2010-11 | £102,283 | £176,821 | £101,252 | £83,696 | £69,687 |
| 2010-12 | £101,290 | £174,902 | £100,442 | £82,816 | £69,167 |
| 2011-01 | £99,236 | £171,704 | £98,331 | £81,082 | £67,923 |
| 2011-02 | £96,909 | £167,842 | £95,969 | £79,168 | £66,405 |
| 2011-03 | £94,998 | £165,339 | £93,855 | £77,554 | £65,033 |
| 2011-04 | £95,838 | £166,563 | £94,596 | £78,353 | £65,543 |
| 2011-05 | £98,399 | £170,469 | £97,169 | £80,524 | £67,583 |
| 2011-06 | £99,062 | £170,752 | £98,011 | £81,146 | £68,166 |
| 2011-07 | £99,499 | £171,215 | £98,600 | £81,464 | £68,627 |
| 2011-08 | £98,420 | £169,584 | £97,667 | £80,511 | £67,188 |
| 2011-09 | £98,683 | £170,645 | £97,851 | £80,663 | £66,984 |
| 2011-10 | £97,379 | £169,017 | £96,599 | £79,459 | £65,732 |
| 2011-11 | £97,624 | £169,622 | £96,896 | £79,544 | £66,349 |
| 2011-12 | £97,894 | £169,702 | £97,342 | £79,736 | £66,676 |
| 2012-01 | £96,392 | £166,591 | £96,015 | £78,553 | £65,456 |
| 2012-02 | £95,177 | £164,007 | £94,814 | £77,728 | £64,087 |
| 2012-03 | £93,992 | £161,155 | £93,612 | £77,003 | £63,185 |
| 2012-04 | £95,305 | £163,527 | £94,729 | £78,111 | £64,456 |
| 2012-05 | £95,816 | £164,452 | £95,155 | £78,538 | £65,043 |
| 2012-06 | £95,449 | £164,109 | £94,586 | £78,290 | £64,703 |
| 2012-07 | £95,982 | £164,560 | £95,035 | £78,929 | £64,820 |
| 2012-08 | £96,672 | £165,487 | £95,579 | £79,700 | £64,869 |
| 2012-09 | £97,298 | £166,944 | £96,320 | £80,051 | £65,193 |
| 2012-10 | £97,662 | £167,817 | £96,725 | £80,252 | £65,464 |
| 2012-11 | £97,080 | £167,080 | £96,232 | £79,640 | £65,188 |
| 2012-12 | £96,437 | £166,141 | £95,535 | £79,117 | £64,626 |
| 2013-01 | £94,732 | £163,239 | £93,996 | £77,652 | £63,213 |
| 2013-02 | £92,995 | £160,166 | £92,323 | £76,238 | £61,920 |
| 2013-03 | £92,720 | £159,958 | £92,102 | £75,915 | £61,679 |
| 2013-04 | £92,292 | £159,308 | £91,559 | £75,620 | £61,300 |
| 2013-05 | £93,600 | £161,470 | £92,831 | £76,721 | £62,300 |
| 2013-06 | £93,774 | £161,109 | £92,989 | £77,059 | £62,400 |
| 2013-07 | £95,618 | £164,009 | £94,760 | £78,674 | £63,728 |
| 2013-08 | £96,391 | £165,316 | £95,561 | £79,319 | £63,988 |
| 2013-09 | £96,976 | £166,972 | £96,106 | £79,647 | £64,298 |
| 2013-10 | £94,277 | £162,919 | £93,490 | £77,250 | £62,295 |
| 2013-11 | £92,505 | £160,249 | £91,802 | £75,647 | £61,136 |
| 2013-12 | £92,639 | £160,036 | £92,144 | £75,740 | £61,356 |
| 2014-01 | £92,263 | £159,092 | £91,851 | £75,463 | £61,134 |
| 2014-02 | £89,993 | £155,232 | £89,521 | £73,650 | £59,449 |
| 2014-03 | £87,820 | £151,481 | £87,376 | £71,878 | £57,782 |
| 2014-04 | £89,348 | £153,786 | £88,813 | £73,277 | £58,633 |
| 2014-05 | £92,571 | £158,851 | £92,019 | £76,034 | £60,862 |
| 2014-06 | £94,809 | £162,562 | £94,249 | £77,912 | £62,251 |
| 2014-07 | £95,709 | £164,111 | £95,140 | £78,664 | £62,721 |
| 2014-08 | £96,081 | £164,966 | £95,456 | £78,964 | £62,755 |
| 2014-09 | £94,648 | £162,613 | £93,951 | £77,802 | £61,837 |
| 2014-10 | £93,702 | £161,138 | £93,061 | £76,942 | £61,377 |
| 2014-11 | £91,838 | £158,113 | £91,385 | £75,251 | £60,288 |
| 2014-12 | £91,707 | £158,163 | £91,324 | £75,030 | £60,207 |
| 2015-01 | £91,274 | £157,539 | £91,002 | £74,588 | £59,850 |
| 2015-02 | £92,045 | £158,850 | £91,663 | £75,276 | £60,443 |
| 2015-03 | £91,473 | £158,237 | £91,151 | £74,676 | £60,140 |
| 2015-04 | £93,051 | £161,200 | £92,602 | £75,984 | £61,092 |
| 2015-05 | £94,116 | £163,043 | £93,697 | £76,838 | £61,756 |
| 2015-06 | £96,606 | £166,800 | £96,189 | £79,035 | £62,984 |
| 2015-07 | £96,467 | £166,233 | £96,181 | £78,928 | £62,889 |
| 2015-08 | £96,351 | £166,135 | £96,067 | £78,828 | £62,598 |
| 2015-09 | £96,273 | £166,697 | £95,865 | £78,648 | £62,712 |
| 2015-10 | £95,407 | £165,578 | £95,000 | £77,864 | £62,014 |
| 2015-11 | £94,939 | £164,949 | £94,580 | £77,414 | £61,674 |
| 2015-12 | £94,695 | £164,442 | £94,397 | £77,223 | £61,276 |
| 2016-01 | £94,982 | £164,817 | £94,802 | £77,423 | £61,449 |
| 2016-02 | £94,934 | £164,642 | £94,815 | £77,387 | £61,250 |
| 2016-03 | £95,186 | £165,143 | £95,142 | £77,504 | £61,743 |
| 2016-04 | £94,713 | £164,286 | £94,385 | £77,293 | £61,381 |
| 2016-05 | £94,724 | £163,912 | £94,260 | £77,445 | £61,691 |
| 2016-06 | £94,996 | £164,132 | £94,294 | £77,877 | £61,701 |
| 2016-07 | £97,310 | £168,064 | £96,583 | £79,789 | £63,263 |
| 2016-08 | £98,695 | £170,816 | £97,942 | £80,849 | £64,119 |
| 2016-09 | £98,779 | £171,192 | £98,180 | £80,770 | £64,227 |
| 2016-10 | £97,154 | £169,026 | £96,700 | £79,181 | £63,468 |
| 2016-11 | £95,874 | £167,664 | £95,531 | £77,869 | £62,659 |
| 2016-12 | £95,730 | £167,724 | £95,393 | £77,665 | £62,656 |
| 2017-01 | £95,693 | £167,977 | £95,376 | £77,559 | £62,511 |
| 2017-02 | £96,080 | £168,395 | £95,610 | £77,977 | £63,164 |
| 2017-03 | £94,145 | £165,214 | £93,630 | £76,367 | £62,056 |
| 2017-04 | £93,672 | £164,007 | £93,024 | £76,125 | £61,973 |
| 2017-05 | £94,515 | £165,022 | £94,029 | £76,823 | £62,604 |
| 2017-06 | £98,150 | £170,671 | £97,587 | £79,969 | £65,140 |
| 2017-07 | £100,656 | £174,809 | £100,194 | £81,998 | £66,830 |
| 2017-08 | £101,491 | £176,144 | £100,881 | £82,813 | £67,169 |
| 2017-09 | £100,942 | £175,601 | £100,398 | £82,252 | £66,595 |
| 2017-10 | £100,077 | £174,256 | £99,654 | £81,473 | £65,765 |
| 2017-11 | £99,852 | £174,117 | £99,640 | £81,119 | £65,544 |
| 2017-12 | £99,792 | £173,704 | £99,702 | £81,091 | £65,412 |
| 2018-01 | £98,366 | £171,419 | £98,369 | £79,832 | £64,479 |
| 2018-02 | £97,732 | £170,823 | £97,673 | £79,277 | £63,680 |
| 2018-03 | £95,036 | £166,481 | £95,036 | £77,002 | £61,658 |
| 2018-04 | £96,464 | £168,729 | £96,352 | £78,341 | £62,187 |
| 2018-05 | £97,317 | £169,750 | £97,199 | £79,189 | £62,554 |
| 2018-06 | £97,842 | £170,366 | £97,803 | £79,640 | £62,984 |
| 2018-07 | £100,437 | £175,020 | £100,414 | £81,703 | £64,663 |
| 2018-08 | £100,051 | £174,422 | £100,083 | £81,331 | £64,435 |
| 2018-09 | £102,422 | £178,893 | £102,411 | £83,216 | £65,720 |
| 2018-10 | £101,587 | £177,692 | £101,627 | £82,434 | £65,180 |
| 2018-11 | £101,208 | £177,166 | £101,344 | £82,034 | £64,860 |
| 2018-12 | £100,055 | £174,891 | £100,207 | £81,141 | £64,322 |
| 2019-01 | £96,723 | £169,250 | £96,931 | £78,353 | £62,168 |
| 2019-02 | £94,866 | £166,417 | £95,062 | £76,743 | £60,902 |
| 2019-03 | £94,278 | £165,695 | £94,621 | £76,122 | £60,183 |
| 2019-04 | £97,806 | £171,528 | £98,164 | £79,097 | £62,165 |
| 2019-05 | £99,759 | £174,316 | £100,134 | £80,863 | £63,301 |
| 2019-06 | £100,842 | £175,794 | £101,141 | £81,901 | £64,093 |
| 2019-07 | £99,534 | £173,444 | £99,790 | £80,873 | £63,366 |
| 2019-08 | £100,528 | £175,165 | £100,677 | £81,771 | £63,800 |
| 2019-09 | £101,433 | £176,862 | £101,411 | £82,589 | £64,307 |
| 2019-10 | £101,186 | £176,187 | £101,401 | £82,315 | £64,089 |
| 2019-11 | £100,009 | £174,211 | £100,411 | £81,211 | £63,401 |
| 2019-12 | £99,299 | £172,783 | £99,915 | £80,567 | £62,780 |
| 2020-01 | £98,291 | £171,448 | £98,859 | £79,675 | £61,933 |
| 2020-02 | £97,891 | £170,875 | £98,485 | £79,320 | £61,521 |
| 2020-03 | £97,017 | £169,758 | £97,614 | £78,503 | £60,895 |
| 2020-04 | £95,499 | £167,222 | £95,999 | £77,333 | £59,539 |
| 2020-05 | £96,014 | £168,476 | £96,531 | £77,631 | £59,871 |
| 2020-06 | £96,899 | £169,677 | £97,486 | £78,427 | £60,283 |
| 2020-07 | £99,254 | £173,472 | £99,882 | £80,383 | £62,091 |
| 2020-08 | £99,787 | £174,276 | £100,445 | £80,876 | £62,034 |
| 2020-09 | £100,749 | £176,584 | £101,195 | £81,634 | £62,324 |
| 2020-10 | £102,776 | £180,433 | £103,083 | £83,321 | £63,198 |
| 2020-11 | £104,916 | £184,160 | £104,963 | £85,229 | £64,611 |
| 2020-12 | £106,502 | £186,646 | £106,452 | £86,684 | £65,499 |
| 2021-01 | £108,713 | £189,276 | £108,632 | £88,827 | £67,522 |
| 2021-02 | £109,855 | £190,082 | £109,739 | £90,087 | £68,799 |
| 2021-03 | £111,253 | £191,347 | £111,031 | £91,561 | £70,532 |
| 2021-04 | £110,871 | £190,774 | £110,504 | £91,314 | £70,233 |
| 2021-05 | £112,197 | £193,186 | £111,763 | £92,414 | £70,978 |
| 2021-06 | £116,340 | £199,308 | £115,766 | £96,200 | £73,454 |
| 2021-07 | £117,512 | £201,230 | £117,159 | £97,071 | £74,062 |
| 2021-08 | £118,028 | £202,233 | £117,844 | £97,406 | £73,880 |
| 2021-09 | £118,871 | £204,046 | £118,913 | £97,892 | £74,017 |
| 2021-10 | £119,954 | £207,295 | £119,802 | £98,546 | £74,287 |
| 2021-11 | £119,425 | £207,022 | £119,207 | £97,979 | £73,870 |
| 2021-12 | £116,631 | £203,289 | £116,263 | £95,498 | £71,728 |
| 2022-01 | £115,920 | £201,085 | £115,703 | £95,115 | £71,058 |
| 2022-02 | £116,984 | £202,428 | £116,856 | £96,063 | £71,846 |
| 2022-03 | £117,091 | £202,870 | £117,210 | £95,942 | £71,788 |
| 2022-04 | £119,004 | £206,002 | £118,929 | £97,677 | £72,934 |
| 2022-05 | £119,723 | £206,975 | £119,622 | £98,386 | £73,060 |
| 2022-06 | £121,286 | £209,071 | £121,066 | £99,900 | £74,165 |
| 2022-07 | £123,773 | £212,834 | £123,707 | £102,034 | £75,375 |
| 2022-08 | £126,131 | £216,656 | £125,962 | £104,131 | £76,486 |
| 2022-09 | £127,897 | £219,639 | £127,748 | £105,637 | £77,027 |
| 2022-10 | £129,172 | £222,259 | £129,019 | £106,571 | £77,736 |
| 2022-11 | £129,312 | £222,902 | £129,105 | £106,607 | £77,758 |
| 2022-12 | £129,401 | £223,058 | £129,197 | £106,662 | £78,005 |
| 2023-01 | £128,073 | £221,299 | £127,972 | £105,371 | £77,052 |
| 2023-02 | £125,194 | £216,859 | £125,306 | £102,736 | £75,286 |
| 2023-03 | £121,877 | £212,385 | £122,247 | £99,546 | £73,113 |
| 2023-04 | £119,339 | £208,390 | £119,693 | £97,375 | £71,712 |
| 2023-05 | £119,425 | £208,345 | £119,679 | £97,514 | £71,998 |
| 2023-06 | £120,457 | £209,315 | £120,375 | £98,728 | £72,535 |
| 2023-07 | £121,742 | £210,848 | £121,591 | £99,991 | £73,077 |
| 2023-08 | £123,791 | £214,066 | £123,513 | £101,868 | £73,825 |
| 2023-09 | £124,749 | £215,607 | £124,570 | £102,651 | £74,165 |
| 2023-10 | £125,255 | £216,251 | £124,985 | £103,142 | £74,664 |
| 2023-11 | £124,857 | £215,980 | £124,730 | £102,630 | £74,590 |
| 2023-12 | £125,647 | £217,178 | £125,545 | £103,264 | £75,366 |
| 2024-01 | £124,237 | £215,013 | £124,160 | £102,046 | £74,422 |
| 2024-02 | £125,048 | £215,548 | £125,048 | £102,874 | £74,839 |
| 2024-03 | £124,449 | £214,620 | £124,383 | £102,379 | £74,719 |
| 2024-04 | £123,001 | £211,314 | £122,884 | £101,369 | £74,196 |
| 2024-05 | £122,340 | £209,986 | £122,183 | £100,855 | £74,097 |
| 2024-06 | £124,320 | £212,601 | £124,021 | £102,783 | £75,122 |
| 2024-07 | £127,014 | £216,946 | £126,710 | £105,135 | £76,261 |
| 2024-08 | £127,643 | £217,809 | £127,127 | £105,887 | £76,229 |
| 2024-09 | £128,087 | £219,241 | £127,782 | £106,041 | £75,883 |
| 2024-10 | £129,900 | £222,928 | £129,482 | £107,451 | £77,081 |
| 2024-11 | £132,005 | £226,864 | £131,882 | £108,971 | £78,018 |
| 2024-12 | £133,069 | £229,045 | £132,840 | £109,861 | £78,409 |
| 2025-01 | £132,518 | £228,497 | £132,547 | £109,238 | £77,438 |
| 2025-02 | £133,074 | £229,751 | £132,995 | £109,703 | £77,729 |
| 2025-03 | £135,056 | £231,273 | £135,057 | £111,707 | £79,576 |
| 2025-04 | £132,462 | £227,774 | £132,669 | £109,216 | £77,868 |
| 2025-05 | £131,222 | £226,285 | £131,491 | £108,041 | £76,720 |
| 2025-06 | £128,609 | £223,314 | £129,038 | £105,487 | £74,333 |
| 2025-07 | £133,630 | £230,388 | £133,934 | £110,140 | £77,054 |
| 2025-08 | £133,604 | £229,581 | £134,064 | £110,266 | £76,702 |
| 2025-09 | £134,551 | £231,219 | £135,046 | £111,090 | £76,737 |
| 2025-10 | £136,302 | £234,502 | £136,985 | £112,399 | £77,382 |
| 2025-11 | £139,824 | £240,571 | £140,486 | £115,346 | £79,211 |
| 2025-12 | £141,494 | £242,502 | £142,239 | £116,948 | £80,004 |
| 2026-01 | £137,598 | £234,814 | £138,271 | £114,042 | £77,673 |
| 2026-02 | £136,805 | £233,324 | £137,533 | £113,384 | £76,967 |
| 2026-03 | £135,767 | £232,205 | £136,560 | £112,354 | £75,735 |
- All property types
- Detached
- Semi-detached
- Terraced
- Flats
Source: HM Land Registry House Price Index
| Year | All property types | Detached | Semi-detached | Terraced | Flats |
|---|---|---|---|---|---|
| 1996-01 | -1.3% | -0.7% | -0.2% | -2.4% | -1.9% |
| 1996-02 | +0.1% | +1.4% | +0.7% | -1.0% | -1.3% |
| 1996-03 | -1.1% | +0.8% | -0.3% | -2.5% | -2.4% |
| 1996-04 | +0.6% | +2.3% | +1.0% | -0.6% | -0.5% |
| 1996-05 | +1.8% | +3.4% | +2.2% | +0.9% | +1.1% |
| 1996-06 | +3.2% | +4.6% | +3.2% | +2.6% | +2.5% |
| 1996-07 | +1.0% | +2.3% | +1.2% | +0.3% | +0.2% |
| 1996-08 | +2.0% | +3.3% | +2.1% | +1.2% | +1.2% |
| 1996-09 | +2.1% | +3.8% | +2.4% | +1.0% | +0.9% |
| 1996-10 | +4.8% | +6.5% | +4.9% | +4.0% | +3.1% |
| 1996-11 | +4.5% | +6.0% | +4.5% | +4.0% | +2.3% |
| 1996-12 | +3.4% | +4.2% | +3.1% | +3.3% | +1.0% |
| 1997-01 | +2.7% | +3.0% | +2.4% | +2.9% | +0.6% |
| 1997-02 | -0.2% | +0.4% | -0.6% | 0.0% | -1.5% |
| 1997-03 | +0.8% | +1.2% | +0.2% | +1.2% | -0.2% |
| 1997-04 | +0.9% | +1.5% | +0.5% | +1.1% | -0.7% |
| 1997-05 | +1.0% | +1.5% | +0.9% | +0.9% | -1.3% |
| 1997-06 | +0.9% | +1.6% | +1.1% | +0.6% | -2.5% |
| 1997-07 | +3.9% | +4.7% | +3.8% | +3.8% | +0.3% |
| 1997-08 | +5.8% | +6.3% | +5.7% | +5.8% | +2.2% |
| 1997-09 | +5.9% | +6.1% | +5.8% | +6.1% | +3.2% |
| 1997-10 | +2.4% | +2.6% | +2.3% | +2.5% | +0.3% |
| 1997-11 | +1.0% | +1.6% | +0.9% | +1.0% | -1.3% |
| 1997-12 | +1.6% | +2.5% | +1.6% | +1.2% | -0.7% |
| 1998-01 | +3.0% | +4.5% | +3.0% | +2.4% | +0.6% |
| 1998-02 | +4.7% | +6.0% | +4.8% | +4.1% | +3.1% |
| 1998-03 | +4.8% | +6.0% | +5.0% | +4.2% | +2.9% |
| 1998-04 | +4.4% | +5.3% | +4.7% | +3.8% | +2.5% |
| 1998-05 | +3.3% | +4.4% | +3.4% | +2.9% | +1.4% |
| 1998-06 | +1.7% | +2.6% | +1.5% | +1.4% | +1.1% |
| 1998-07 | -0.3% | +0.6% | -0.4% | -0.7% | -0.3% |
| 1998-08 | -0.3% | +0.6% | -0.3% | -0.7% | -0.2% |
| 1998-09 | +1.5% | +2.4% | +1.5% | +1.1% | +1.0% |
| 1998-10 | +2.9% | +3.9% | +2.8% | +2.4% | +2.5% |
| 1998-11 | +3.0% | +4.1% | +3.1% | +2.3% | +3.1% |
| 1998-12 | +2.0% | +2.9% | +2.1% | +1.3% | +2.9% |
| 1999-01 | +0.9% | +1.4% | +1.3% | +0.3% | +2.0% |
| 1999-02 | +0.5% | +0.7% | +0.8% | +0.2% | +0.8% |
| 1999-03 | +0.2% | +0.5% | +0.6% | -0.2% | +0.7% |
| 1999-04 | +0.6% | +0.9% | +0.7% | +0.3% | +1.0% |
| 1999-05 | +1.0% | +1.3% | +1.2% | +0.7% | +2.0% |
| 1999-06 | +2.1% | +2.3% | +2.3% | +1.9% | +2.4% |
| 1999-07 | +3.5% | +3.9% | +3.5% | +3.4% | +3.6% |
| 1999-08 | +5.1% | +5.2% | +5.0% | +5.1% | +5.0% |
| 1999-09 | +4.0% | +4.4% | +3.7% | +4.0% | +4.3% |
| 1999-10 | +4.8% | +5.1% | +4.8% | +4.7% | +5.2% |
| 1999-11 | +5.3% | +5.4% | +5.2% | +5.3% | +5.7% |
| 1999-12 | +7.1% | +7.1% | +6.9% | +7.2% | +7.4% |
| 2000-01 | +7.1% | +7.4% | +6.7% | +7.2% | +6.9% |
| 2000-02 | +8.9% | +9.6% | +8.4% | +8.7% | +8.6% |
| 2000-03 | +8.8% | +9.5% | +8.4% | +8.6% | +7.9% |
| 2000-04 | +9.5% | +10.3% | +9.1% | +9.3% | +9.5% |
| 2000-05 | +7.9% | +8.7% | +7.8% | +7.3% | +8.4% |
| 2000-06 | +7.3% | +8.2% | +7.3% | +6.5% | +8.8% |
| 2000-07 | +6.9% | +8.1% | +7.3% | +5.8% | +8.2% |
| 2000-08 | +5.8% | +7.2% | +6.4% | +4.3% | +7.7% |
| 2000-09 | +5.1% | +6.8% | +5.8% | +3.4% | +7.1% |
| 2000-10 | +2.5% | +4.1% | +3.1% | +0.9% | +4.4% |
| 2000-11 | +2.0% | +3.7% | +2.3% | +0.5% | +3.7% |
| 2000-12 | +1.2% | +2.9% | +1.6% | -0.3% | +3.2% |
| 2001-01 | +1.7% | +3.2% | +2.1% | +0.3% | +4.4% |
| 2001-02 | +0.7% | +1.7% | +1.1% | -0.6% | +3.4% |
| 2001-03 | -0.2% | +0.9% | 0.0% | -1.2% | +2.6% |
| 2001-04 | -0.2% | +1.1% | -0.1% | -1.2% | +2.2% |
| 2001-05 | +0.2% | +1.2% | 0.0% | -0.6% | +2.2% |
| 2001-06 | +1.1% | +2.1% | +1.0% | +0.4% | +3.0% |
| 2001-07 | +0.6% | +1.1% | +0.5% | +0.2% | +2.9% |
| 2001-08 | +1.6% | +2.1% | +1.4% | +1.3% | +3.8% |
| 2001-09 | +4.2% | +4.5% | +3.8% | +4.1% | +6.5% |
| 2001-10 | +7.7% | +8.0% | +7.2% | +7.8% | +9.8% |
| 2001-11 | +8.6% | +8.7% | +8.3% | +8.7% | +10.8% |
| 2001-12 | +7.4% | +7.4% | +7.1% | +7.4% | +9.9% |
| 2002-01 | +6.5% | +6.6% | +6.3% | +6.4% | +9.3% |
| 2002-02 | +6.7% | +7.1% | +6.3% | +6.6% | +9.8% |
| 2002-03 | +9.4% | +9.5% | +9.0% | +9.4% | +12.6% |
| 2002-04 | +10.4% | +10.3% | +10.0% | +10.4% | +14.2% |
| 2002-05 | +13.0% | +12.9% | +12.9% | +12.9% | +17.2% |
| 2002-06 | +12.6% | +12.6% | +12.4% | +12.5% | +16.5% |
| 2002-07 | +14.0% | +13.9% | +13.7% | +14.0% | +17.4% |
| 2002-08 | +12.8% | +12.3% | +12.6% | +13.1% | +16.0% |
| 2002-09 | +12.9% | +12.0% | +12.9% | +13.1% | +16.0% |
| 2002-10 | +13.8% | +12.7% | +14.1% | +14.0% | +16.9% |
| 2002-11 | +16.4% | +15.5% | +16.7% | +16.6% | +19.6% |
| 2002-12 | +19.4% | +18.4% | +19.5% | +19.7% | +21.8% |
| 2003-01 | +22.0% | +20.6% | +21.7% | +22.8% | +24.3% |
| 2003-02 | +23.9% | +22.0% | +23.9% | +24.8% | +26.4% |
| 2003-03 | +25.3% | +23.7% | +25.2% | +26.2% | +28.7% |
| 2003-04 | +26.2% | +24.6% | +26.6% | +26.6% | +28.8% |
| 2003-05 | +24.7% | +23.4% | +25.1% | +25.0% | +26.4% |
| 2003-06 | +25.3% | +23.4% | +25.8% | +25.8% | +26.8% |
| 2003-07 | +25.3% | +22.9% | +26.0% | +26.1% | +26.9% |
| 2003-08 | +27.9% | +24.8% | +28.8% | +28.9% | +29.5% |
| 2003-09 | +29.0% | +25.4% | +29.9% | +30.4% | +30.0% |
| 2003-10 | +28.5% | +24.7% | +28.9% | +30.4% | +29.3% |
| 2003-11 | +27.2% | +23.1% | +27.4% | +29.3% | +27.5% |
| 2003-12 | +27.2% | +22.8% | +27.1% | +29.7% | +27.7% |
| 2004-01 | +27.3% | +23.0% | +27.6% | +29.6% | +27.2% |
| 2004-02 | +25.9% | +21.4% | +26.1% | +28.2% | +25.2% |
| 2004-03 | +24.9% | +20.3% | +25.2% | +27.2% | +23.5% |
| 2004-04 | +26.0% | +20.1% | +25.9% | +29.2% | +24.1% |
| 2004-05 | +31.6% | +24.4% | +31.1% | +35.7% | +30.3% |
| 2004-06 | +34.8% | +27.0% | +34.4% | +39.0% | +33.5% |
| 2004-07 | +36.7% | +28.9% | +36.3% | +41.0% | +35.6% |
| 2004-08 | +35.1% | +28.0% | +34.6% | +39.1% | +33.5% |
| 2004-09 | +35.0% | +28.3% | +34.1% | +39.0% | +33.7% |
| 2004-10 | +34.9% | +28.9% | +33.7% | +38.5% | +34.1% |
| 2004-11 | +34.2% | +28.4% | +33.2% | +37.7% | +33.9% |
| 2004-12 | +33.1% | +27.8% | +32.0% | +36.2% | +32.4% |
| 2005-01 | +30.3% | +25.2% | +29.2% | +33.3% | +29.8% |
| 2005-02 | +32.4% | +27.8% | +31.3% | +35.1% | +31.8% |
| 2005-03 | +30.1% | +25.6% | +29.5% | +32.6% | +29.6% |
| 2005-04 | +28.2% | +24.9% | +27.9% | +29.9% | +27.6% |
| 2005-05 | +22.2% | +20.2% | +22.1% | +23.2% | +21.1% |
| 2005-06 | +18.5% | +16.5% | +18.1% | +19.7% | +17.1% |
| 2005-07 | +15.4% | +13.7% | +14.8% | +16.5% | +14.1% |
| 2005-08 | +14.6% | +12.7% | +14.0% | +15.9% | +13.4% |
| 2005-09 | +13.7% | +12.1% | +13.1% | +14.8% | +12.8% |
| 2005-10 | +12.3% | +10.4% | +11.9% | +13.5% | +11.0% |
| 2005-11 | +11.7% | +9.7% | +11.3% | +12.9% | +10.1% |
| 2005-12 | +11.0% | +9.0% | +10.6% | +12.2% | +9.8% |
| 2006-01 | +13.8% | +11.7% | +13.3% | +15.1% | +12.3% |
| 2006-02 | +11.6% | +9.2% | +11.0% | +13.1% | +10.7% |
| 2006-03 | +11.6% | +9.3% | +10.9% | +13.1% | +10.4% |
| 2006-04 | +9.2% | +7.0% | +8.2% | +10.8% | +8.3% |
| 2006-05 | +8.5% | +6.4% | +7.7% | +10.0% | +7.5% |
| 2006-06 | +9.4% | +7.6% | +8.7% | +10.7% | +8.5% |
| 2006-07 | +8.6% | +6.8% | +7.8% | +10.0% | +7.5% |
| 2006-08 | +8.5% | +6.9% | +7.8% | +9.8% | +6.9% |
| 2006-09 | +6.2% | +4.5% | +5.7% | +7.4% | +4.3% |
| 2006-10 | +6.6% | +5.1% | +6.3% | +7.5% | +4.6% |
| 2006-11 | +6.3% | +4.9% | +6.1% | +7.1% | +4.3% |
| 2006-12 | +6.5% | +5.0% | +6.4% | +7.4% | +4.3% |
| 2007-01 | +4.4% | +2.8% | +4.3% | +5.3% | +2.1% |
| 2007-02 | +4.4% | +3.1% | +4.3% | +5.1% | +2.2% |
| 2007-03 | +4.5% | +3.1% | +4.2% | +5.4% | +2.5% |
| 2007-04 | +5.0% | +3.7% | +4.6% | +6.0% | +3.1% |
| 2007-05 | +6.0% | +4.3% | +5.5% | +7.1% | +4.5% |
| 2007-06 | +3.7% | +2.4% | +3.2% | +4.7% | +2.4% |
| 2007-07 | +5.2% | +4.3% | +4.8% | +5.9% | +4.1% |
| 2007-08 | +4.5% | +4.0% | +4.0% | +5.1% | +3.2% |
| 2007-09 | +6.3% | +5.9% | +5.7% | +6.9% | +5.4% |
| 2007-10 | +6.3% | +5.9% | +5.6% | +7.0% | +5.4% |
| 2007-11 | +6.4% | +6.1% | +5.6% | +6.9% | +6.1% |
| 2007-12 | +5.2% | +5.5% | +4.5% | +5.5% | +4.9% |
| 2008-01 | +3.3% | +3.8% | +2.6% | +3.5% | +3.4% |
| 2008-02 | +3.4% | +4.1% | +2.8% | +3.4% | +2.9% |
| 2008-03 | +2.2% | +3.0% | +1.9% | +2.1% | +1.6% |
| 2008-04 | +2.8% | +4.2% | +2.6% | +2.5% | +1.7% |
| 2008-05 | +1.6% | +3.2% | +1.6% | +1.2% | +0.2% |
| 2008-06 | +2.3% | +3.9% | +2.3% | +2.0% | +0.8% |
| 2008-07 | +0.7% | +1.8% | +0.9% | +0.4% | -0.7% |
| 2008-08 | -0.6% | +0.2% | -0.4% | -0.9% | -1.1% |
| 2008-09 | -3.2% | -1.8% | -3.0% | -3.7% | -3.5% |
| 2008-10 | -6.1% | -4.8% | -5.9% | -6.7% | -6.5% |
| 2008-11 | -9.5% | -8.2% | -9.1% | -10.1% | -10.2% |
| 2008-12 | -11.6% | -10.9% | -11.1% | -12.1% | -12.8% |
| 2009-01 | -11.5% | -10.5% | -11.1% | -11.9% | -12.4% |
| 2009-02 | -13.6% | -12.8% | -13.3% | -14.0% | -14.2% |
| 2009-03 | -13.1% | -12.2% | -12.9% | -13.5% | -12.3% |
| 2009-04 | -14.8% | -14.5% | -14.4% | -15.1% | -13.8% |
| 2009-05 | -13.7% | -13.3% | -13.4% | -14.0% | -12.9% |
| 2009-06 | -14.5% | -14.2% | -13.9% | -14.7% | -14.6% |
| 2009-07 | -14.1% | -13.7% | -13.9% | -14.2% | -14.9% |
| 2009-08 | -12.9% | -12.4% | -12.6% | -13.0% | -14.4% |
| 2009-09 | -9.6% | -9.7% | -9.3% | -9.5% | -11.3% |
| 2009-10 | -5.4% | -5.7% | -5.1% | -5.2% | -7.7% |
| 2009-11 | -1.6% | -2.1% | -1.5% | -1.0% | -4.5% |
| 2009-12 | +1.5% | +1.0% | +1.5% | +2.2% | -1.9% |
| 2010-01 | +1.3% | +0.9% | +1.5% | +2.0% | -3.1% |
| 2010-02 | +3.3% | +2.9% | +3.8% | +3.8% | -2.1% |
| 2010-03 | +3.2% | +3.4% | +3.6% | +3.5% | -3.0% |
| 2010-04 | +4.7% | +5.1% | +5.0% | +4.9% | -1.2% |
| 2010-05 | +3.4% | +3.9% | +3.5% | +3.6% | -1.6% |
| 2010-06 | +3.2% | +3.6% | +3.1% | +3.5% | -1.2% |
| 2010-07 | +2.9% | +3.6% | +2.9% | +3.1% | -1.2% |
| 2010-08 | +3.4% | +4.2% | +3.7% | +3.3% | -0.4% |
| 2010-09 | +1.4% | +2.5% | +1.7% | +1.0% | -2.5% |
| 2010-10 | -0.7% | +0.7% | -0.4% | -1.2% | -3.9% |
| 2010-11 | -2.8% | -1.2% | -2.5% | -3.5% | -5.6% |
| 2010-12 | -4.3% | -2.2% | -3.8% | -5.3% | -6.2% |
| 2011-01 | -4.3% | -2.4% | -3.9% | -5.4% | -5.4% |
| 2011-02 | -5.7% | -3.8% | -5.6% | -6.6% | -6.1% |
| 2011-03 | -6.7% | -5.3% | -6.9% | -7.3% | -7.3% |
| 2011-04 | -6.3% | -4.7% | -6.6% | -6.8% | -7.1% |
| 2011-05 | -4.2% | -2.8% | -4.3% | -4.8% | -5.0% |
| 2011-06 | -3.5% | -2.2% | -3.4% | -4.2% | -3.6% |
| 2011-07 | -3.4% | -2.5% | -3.1% | -4.2% | -2.8% |
| 2011-08 | -5.8% | -5.1% | -5.7% | -6.4% | -5.6% |
| 2011-09 | -5.6% | -5.1% | -5.5% | -6.0% | -5.6% |
| 2011-10 | -6.7% | -6.1% | -6.6% | -7.0% | -7.4% |
| 2011-11 | -4.6% | -4.1% | -4.3% | -5.0% | -4.8% |
| 2011-12 | -3.4% | -3.0% | -3.1% | -3.7% | -3.6% |
| 2012-01 | -2.9% | -3.0% | -2.4% | -3.1% | -3.6% |
| 2012-02 | -1.8% | -2.3% | -1.2% | -1.8% | -3.5% |
| 2012-03 | -1.1% | -2.5% | -0.3% | -0.7% | -2.8% |
| 2012-04 | -0.6% | -1.8% | +0.1% | -0.3% | -1.7% |
| 2012-05 | -2.6% | -3.5% | -2.1% | -2.5% | -3.8% |
| 2012-06 | -3.6% | -3.9% | -3.5% | -3.5% | -5.1% |
| 2012-07 | -3.5% | -3.9% | -3.6% | -3.1% | -5.5% |
| 2012-08 | -1.8% | -2.4% | -2.1% | -1.0% | -3.5% |
| 2012-09 | -1.4% | -2.2% | -1.6% | -0.8% | -2.7% |
| 2012-10 | +0.3% | -0.7% | +0.1% | +1.0% | -0.4% |
| 2012-11 | -0.6% | -1.5% | -0.7% | +0.1% | -1.8% |
| 2012-12 | -1.5% | -2.1% | -1.9% | -0.8% | -3.1% |
| 2013-01 | -1.7% | -2.0% | -2.1% | -1.1% | -3.4% |
| 2013-02 | -2.3% | -2.3% | -2.6% | -1.9% | -3.4% |
| 2013-03 | -1.4% | -0.7% | -1.6% | -1.4% | -2.4% |
| 2013-04 | -3.2% | -2.6% | -3.3% | -3.2% | -4.9% |
| 2013-05 | -2.3% | -1.8% | -2.4% | -2.3% | -4.2% |
| 2013-06 | -1.8% | -1.8% | -1.7% | -1.6% | -3.6% |
| 2013-07 | -0.4% | -0.3% | -0.3% | -0.3% | -1.7% |
| 2013-08 | -0.3% | -0.1% | 0.0% | -0.5% | -1.4% |
| 2013-09 | -0.3% | 0.0% | -0.2% | -0.5% | -1.4% |
| 2013-10 | -3.5% | -2.9% | -3.3% | -3.7% | -4.8% |
| 2013-11 | -4.7% | -4.1% | -4.6% | -5.0% | -6.2% |
| 2013-12 | -3.9% | -3.7% | -3.5% | -4.3% | -5.1% |
| 2014-01 | -2.6% | -2.5% | -2.3% | -2.8% | -3.3% |
| 2014-02 | -3.2% | -3.1% | -3.0% | -3.4% | -4.0% |
| 2014-03 | -5.3% | -5.3% | -5.1% | -5.3% | -6.3% |
| 2014-04 | -3.2% | -3.5% | -3.0% | -3.1% | -4.3% |
| 2014-05 | -1.1% | -1.6% | -0.9% | -0.9% | -2.3% |
| 2014-06 | +1.1% | +0.9% | +1.4% | +1.1% | -0.2% |
| 2014-07 | +0.1% | +0.1% | +0.4% | 0.0% | -1.6% |
| 2014-08 | -0.3% | -0.2% | -0.1% | -0.4% | -1.9% |
| 2014-09 | -2.4% | -2.6% | -2.2% | -2.3% | -3.8% |
| 2014-10 | -0.6% | -1.1% | -0.5% | -0.4% | -1.5% |
| 2014-11 | -0.7% | -1.3% | -0.5% | -0.5% | -1.4% |
| 2014-12 | -1.0% | -1.2% | -0.9% | -0.9% | -1.9% |
| 2015-01 | -1.1% | -1.0% | -0.9% | -1.2% | -2.1% |
| 2015-02 | +2.3% | +2.3% | +2.4% | +2.2% | +1.7% |
| 2015-03 | +4.2% | +4.5% | +4.3% | +3.9% | +4.1% |
| 2015-04 | +4.1% | +4.8% | +4.3% | +3.7% | +4.2% |
| 2015-05 | +1.7% | +2.6% | +1.8% | +1.1% | +1.5% |
| 2015-06 | +1.9% | +2.6% | +2.1% | +1.4% | +1.2% |
| 2015-07 | +0.8% | +1.3% | +1.1% | +0.3% | +0.3% |
| 2015-08 | +0.3% | +0.7% | +0.6% | -0.2% | -0.3% |
| 2015-09 | +1.7% | +2.5% | +2.0% | +1.1% | +1.4% |
| 2015-10 | +1.8% | +2.8% | +2.1% | +1.2% | +1.0% |
| 2015-11 | +3.4% | +4.3% | +3.5% | +2.9% | +2.3% |
| 2015-12 | +3.3% | +4.0% | +3.4% | +2.9% | +1.8% |
| 2016-01 | +4.1% | +4.6% | +4.2% | +3.8% | +2.7% |
| 2016-02 | +3.1% | +3.6% | +3.4% | +2.8% | +1.3% |
| 2016-03 | +4.1% | +4.4% | +4.4% | +3.8% | +2.7% |
| 2016-04 | +1.8% | +1.9% | +1.9% | +1.7% | +0.5% |
| 2016-05 | +0.6% | +0.5% | +0.6% | +0.8% | -0.1% |
| 2016-06 | -1.7% | -1.6% | -2.0% | -1.5% | -2.0% |
| 2016-07 | +0.9% | +1.1% | +0.4% | +1.1% | +0.6% |
| 2016-08 | +2.4% | +2.8% | +2.0% | +2.6% | +2.4% |
| 2016-09 | +2.6% | +2.7% | +2.4% | +2.7% | +2.4% |
| 2016-10 | +1.8% | +2.1% | +1.8% | +1.7% | +2.3% |
| 2016-11 | +1.0% | +1.6% | +1.0% | +0.6% | +1.6% |
| 2016-12 | +1.1% | +2.0% | +1.1% | +0.6% | +2.3% |
| 2017-01 | +0.7% | +1.9% | +0.6% | +0.2% | +1.7% |
| 2017-02 | +1.2% | +2.3% | +0.8% | +0.8% | +3.1% |
| 2017-03 | -1.1% | 0.0% | -1.6% | -1.5% | +0.5% |
| 2017-04 | -1.1% | -0.2% | -1.4% | -1.5% | +1.0% |
| 2017-05 | -0.2% | +0.7% | -0.2% | -0.8% | +1.5% |
| 2017-06 | +3.3% | +4.0% | +3.5% | +2.7% | +5.6% |
| 2017-07 | +3.4% | +4.0% | +3.7% | +2.8% | +5.6% |
| 2017-08 | +2.8% | +3.1% | +3.0% | +2.4% | +4.8% |
| 2017-09 | +2.2% | +2.6% | +2.3% | +1.8% | +3.7% |
| 2017-10 | +3.0% | +3.1% | +3.1% | +2.9% | +3.6% |
| 2017-11 | +4.1% | +3.8% | +4.3% | +4.2% | +4.6% |
| 2017-12 | +4.2% | +3.6% | +4.5% | +4.4% | +4.4% |
| 2018-01 | +2.8% | +2.0% | +3.1% | +2.9% | +3.1% |
| 2018-02 | +1.7% | +1.4% | +2.2% | +1.7% | +0.8% |
| 2018-03 | +0.9% | +0.8% | +1.5% | +0.8% | -0.6% |
| 2018-04 | +3.0% | +2.9% | +3.6% | +2.9% | +0.3% |
| 2018-05 | +3.0% | +2.9% | +3.4% | +3.1% | -0.1% |
| 2018-06 | -0.3% | -0.2% | +0.2% | -0.4% | -3.3% |
| 2018-07 | -0.2% | +0.1% | +0.2% | -0.4% | -3.2% |
| 2018-08 | -1.4% | -1.0% | -0.8% | -1.8% | -4.1% |
| 2018-09 | +1.5% | +1.9% | +2.0% | +1.2% | -1.3% |
| 2018-10 | +1.5% | +2.0% | +2.0% | +1.2% | -0.9% |
| 2018-11 | +1.4% | +1.8% | +1.7% | +1.1% | -1.0% |
| 2018-12 | +0.3% | +0.7% | +0.5% | +0.1% | -1.7% |
| 2019-01 | -1.7% | -1.3% | -1.5% | -1.9% | -3.6% |
| 2019-02 | -2.9% | -2.6% | -2.7% | -3.2% | -4.4% |
| 2019-03 | -0.8% | -0.5% | -0.4% | -1.1% | -2.4% |
| 2019-04 | +1.4% | +1.7% | +1.9% | +1.0% | 0.0% |
| 2019-05 | +2.5% | +2.7% | +3.0% | +2.1% | +1.2% |
| 2019-06 | +3.1% | +3.2% | +3.4% | +2.8% | +1.8% |
| 2019-07 | -0.9% | -0.9% | -0.6% | -1.0% | -2.0% |
| 2019-08 | +0.5% | +0.4% | +0.6% | +0.5% | -1.0% |
| 2019-09 | -1.0% | -1.1% | -1.0% | -0.8% | -2.1% |
| 2019-10 | -0.4% | -0.8% | -0.2% | -0.1% | -1.7% |
| 2019-11 | -1.2% | -1.7% | -0.9% | -1.0% | -2.2% |
| 2019-12 | -0.8% | -1.2% | -0.3% | -0.7% | -2.4% |
| 2020-01 | +1.6% | +1.3% | +2.0% | +1.7% | -0.4% |
| 2020-02 | +3.2% | +2.7% | +3.6% | +3.4% | +1.0% |
| 2020-03 | +2.9% | +2.5% | +3.2% | +3.1% | +1.2% |
| 2020-04 | -2.4% | -2.5% | -2.2% | -2.2% | -4.2% |
| 2020-05 | -3.8% | -3.4% | -3.6% | -4.0% | -5.4% |
| 2020-06 | -3.9% | -3.5% | -3.6% | -4.2% | -5.9% |
| 2020-07 | -0.3% | 0.0% | +0.1% | -0.6% | -2.0% |
| 2020-08 | -0.7% | -0.5% | -0.2% | -1.1% | -2.8% |
| 2020-09 | -0.7% | -0.2% | -0.2% | -1.2% | -3.1% |
| 2020-10 | +1.6% | +2.4% | +1.7% | +1.2% | -1.4% |
| 2020-11 | +4.9% | +5.7% | +4.5% | +4.9% | +1.9% |
| 2020-12 | +7.3% | +8.0% | +6.5% | +7.6% | +4.3% |
| 2021-01 | +10.6% | +10.4% | +9.9% | +11.5% | +9.0% |
| 2021-02 | +12.2% | +11.2% | +11.4% | +13.6% | +11.8% |
| 2021-03 | +14.7% | +12.7% | +13.7% | +16.6% | +15.8% |
| 2021-04 | +16.1% | +14.1% | +15.1% | +18.1% | +18.0% |
| 2021-05 | +16.9% | +14.7% | +15.8% | +19.0% | +18.6% |
| 2021-06 | +20.1% | +17.5% | +18.8% | +22.7% | +21.8% |
| 2021-07 | +18.4% | +16.0% | +17.3% | +20.8% | +19.3% |
| 2021-08 | +18.3% | +16.0% | +17.3% | +20.4% | +19.1% |
| 2021-09 | +18.0% | +15.6% | +17.5% | +19.9% | +18.8% |
| 2021-10 | +16.7% | +14.9% | +16.2% | +18.3% | +17.5% |
| 2021-11 | +13.8% | +12.4% | +13.6% | +15.0% | +14.3% |
| 2021-12 | +9.5% | +8.9% | +9.2% | +10.2% | +9.5% |
| 2022-01 | +6.6% | +6.2% | +6.5% | +7.1% | +5.2% |
| 2022-02 | +6.5% | +6.5% | +6.5% | +6.6% | +4.4% |
| 2022-03 | +5.2% | +6.0% | +5.6% | +4.8% | +1.8% |
| 2022-04 | +7.3% | +8.0% | +7.6% | +7.0% | +3.8% |
| 2022-05 | +6.7% | +7.1% | +7.0% | +6.5% | +2.9% |
| 2022-06 | +4.3% | +4.9% | +4.6% | +3.8% | +1.0% |
| 2022-07 | +5.3% | +5.8% | +5.6% | +5.1% | +1.8% |
| 2022-08 | +6.9% | +7.1% | +6.9% | +6.9% | +3.5% |
| 2022-09 | +7.6% | +7.6% | +7.4% | +7.9% | +4.1% |
| 2022-10 | +7.7% | +7.2% | +7.7% | +8.1% | +4.6% |
| 2022-11 | +8.3% | +7.7% | +8.3% | +8.8% | +5.3% |
| 2022-12 | +10.9% | +9.7% | +11.1% | +11.7% | +8.8% |
| 2023-01 | +10.5% | +10.1% | +10.6% | +10.8% | +8.4% |
| 2023-02 | +7.0% | +7.1% | +7.2% | +6.9% | +4.8% |
| 2023-03 | +4.1% | +4.7% | +4.3% | +3.8% | +1.8% |
| 2023-04 | +0.3% | +1.2% | +0.6% | -0.3% | -1.7% |
| 2023-05 | -0.2% | +0.7% | 0.0% | -0.9% | -1.5% |
| 2023-06 | -0.7% | +0.1% | -0.6% | -1.2% | -2.2% |
| 2023-07 | -1.6% | -0.9% | -1.7% | -2.0% | -3.0% |
| 2023-08 | -1.9% | -1.2% | -1.9% | -2.2% | -3.5% |
| 2023-09 | -2.5% | -1.8% | -2.5% | -2.8% | -3.7% |
| 2023-10 | -3.0% | -2.7% | -3.1% | -3.2% | -4.0% |
| 2023-11 | -3.4% | -3.1% | -3.4% | -3.7% | -4.1% |
| 2023-12 | -2.9% | -2.6% | -2.8% | -3.2% | -3.4% |
| 2024-01 | -3.0% | -2.8% | -3.0% | -3.2% | -3.4% |
| 2024-02 | -0.1% | -0.6% | -0.2% | +0.1% | -0.6% |
| 2024-03 | +2.1% | +1.1% | +1.7% | +2.8% | +2.2% |
| 2024-04 | +3.1% | +1.4% | +2.7% | +4.1% | +3.5% |
| 2024-05 | +2.4% | +0.8% | +2.1% | +3.4% | +2.9% |
| 2024-06 | +3.2% | +1.6% | +3.0% | +4.1% | +3.6% |
| 2024-07 | +4.3% | +2.9% | +4.2% | +5.1% | +4.4% |
| 2024-08 | +3.1% | +1.7% | +2.9% | +3.9% | +3.3% |
| 2024-09 | +2.7% | +1.7% | +2.6% | +3.3% | +2.3% |
| 2024-10 | +3.7% | +3.1% | +3.6% | +4.2% | +3.2% |
| 2024-11 | +5.7% | +5.0% | +5.7% | +6.2% | +4.6% |
| 2024-12 | +5.9% | +5.5% | +5.8% | +6.4% | +4.0% |
| 2025-01 | +6.7% | +6.3% | +6.8% | +7.0% | +4.1% |
| 2025-02 | +6.4% | +6.6% | +6.4% | +6.6% | +3.9% |
| 2025-03 | +8.5% | +7.8% | +8.6% | +9.1% | +6.5% |
| 2025-04 | +7.7% | +7.8% | +8.0% | +7.7% | +4.9% |
| 2025-05 | +7.3% | +7.8% | +7.6% | +7.1% | +3.6% |
| 2025-06 | +3.5% | +5.0% | +4.0% | +2.6% | -1.0% |
| 2025-07 | +5.2% | +6.2% | +5.7% | +4.8% | +1.1% |
| 2025-08 | +4.7% | +5.4% | +5.5% | +4.1% | +0.6% |
| 2025-09 | +5.0% | +5.5% | +5.7% | +4.8% | +1.1% |
| 2025-10 | +4.9% | +5.2% | +5.8% | +4.6% | +0.4% |
| 2025-11 | +5.9% | +6.0% | +6.5% | +5.9% | +1.5% |
| 2025-12 | +6.3% | +5.9% | +7.1% | +6.5% | +2.0% |
| 2026-01 | +3.8% | +2.8% | +4.3% | +4.4% | +0.3% |
| 2026-02 | +2.8% | +1.6% | +3.4% | +3.4% | -1.0% |
| 2026-03 | +0.5% | +0.4% | +1.1% | +0.6% | -4.8% |
Sold House Prices in Durham
The average sold price across all property types in County Durham is £135,767, which is 53.2% below the England average of £289,946 as of March 2026. That discount runs across every property type, but it is deepest at the bottom of the ladder. Flats sit 64.7% below England while detached houses are 50.6% below, so the gap widens the smaller and cheaper the home.
| Property Type | County Durham Average | England Average | Difference |
|---|---|---|---|
| Detached houses | £232,205 | £470,492 | -50.6% |
| Semi-detached houses | £136,560 | £288,185 | -52.6% |
| Terraced houses | £112,354 | £243,788 | -53.9% |
| Flats and maisonettes | £75,735 | £214,563 | -64.7% |
| All property types | £135,767 | £289,946 | -53.2% |
Detached houses at £232,205 carry the smallest discount at 50.6% below England's £470,492, though a discount of half the national figure is still striking. County Durham's detached stock concentrates near the city in DH1, in the rural fringes of DH7 and DH8, and in the established residential streets of Chester-le-Street in DH2 and DH3. Detached homes under £240,000 have become rare across most of England outside the North East. Annual change on detached stock was +0.4% in the latest reading, pointing to a steady market rather than a hot one.
Semi-detached houses at £136,560 sit 52.6% below England's £288,185 and land almost exactly on the county-wide average. Semis are the workhorse of County Durham's towns and dominate the mid-market in DH6, DH7, DH8, and DH9, with the deepest concentration in DH6 where half of all stock is semi-detached. Annual growth of 1.1% on this type led all property types in the latest reading.
Terraced houses at £112,354 offer a 53.9% discount to England's £243,788. The Victorian and Edwardian terraces of the former mining towns are the backbone of the county's rental stock, and they make up 47.5% of homes in DH9 (Stanley) alone. These are the properties most often let to working tenants, and their annual change of +0.6% keeps pace with the wider market.
Flats and maisonettes at £75,735 show the deepest discount at 64.7% below England's £214,563. At that price a flat generates a meaningful yield even from a modest rent, but the county's flat stock is overwhelmingly ex-council or converted, not premium city-centre apartments. Annual change of -4.8% on flats was the one negative reading among property types, and lease terms, service charges, and block management vary far more widely here than for houses, so individual due diligence matters most on this type.
Price Per Square Foot in Durham
Just £118 per square foot separates County Durham's cheapest postcode from its most expensive, with DH9 at £113 and DH1 at £231. Price per square foot strips out the effect of property size and gives a cleaner read on what you are paying for location. DH1 sits at more than double DH9, and that gap is the difference between a university city and a former mining town.
| Rank | Area | Price Per Sq Ft |
|---|---|---|
| 1 | DH9 (Stanley, Dipton) | £113 |
| 2 | DH6 (Coxhoe, Bowburn) | £149 |
| 3 | DH8 (Consett, Shotley Bridge) | £155 |
| 4 | DH7 (Brandon, Langley Park) | £158 |
| 5 | DH2 (Chester-le-Street, Ouston) | £174 |
| 6 | DH3 (Birtley, Great Lumley) | £191 |
| 7 | DH1 (City Centre, Gilesgate) | £231 |
DH9 at £113 per square foot is the cheapest space in County Durham and among the cheapest anywhere in England. Stanley's housing is predominantly terraced and ex-council, and that low per-foot cost sits alongside a 5.5% gross yield and 21.7% five-year growth, which is the combination that puts DH9 at the front of the county's tables. The figure is drawn from 785 transactions analysed in the postcode.
DH8, DH6, and DH7 cluster between £149 and £158 per square foot. Consett, Coxhoe, and Brandon are mid-market towns where family houses trade at roughly a third less per square foot than the cathedral city. Space is cheap across this band, and it is where the county's higher yields concentrate.
DH1 at £231 per square foot is the clear premium, the only postcode trading above £200. The university and cathedral city effect is visible in the number: student lets and professional rentals near the centre command per-room premiums that support the higher space cost, and 813 transactions analysed confirm the gap over the rest of the county.
Figures reflect averages across all property types and ages. Individual values depend on condition, location within the postcode, and building age.
For Sale Asking Prices in Durham
County Durham's asking prices run from £137,249 in DH9 to £296,669 in DH1, and the mean across the seven postcodes is £190,986. Asking prices are not sold prices; they reflect what sellers and agents think the market will pay, and they tend to run ahead of what transacts. Strip out the DH1 university premium and the other six postcodes sit inside a tight £73,000 band.
| Rank | Area | Asking Price |
|---|---|---|
| 1 | DH9 (Stanley, Dipton) | £137,249 |
| 2 | DH6 (Coxhoe, Bowburn) | £162,416 |
| 3 | DH2 (Chester-le-Street, Ouston) | £165,997 |
| 4 | DH7 (Brandon, Langley Park) | £169,436 |
| 5 | DH8 (Consett, Shotley Bridge) | £194,240 |
| 6 | DH3 (Birtley, Great Lumley) | £210,893 |
| 7 | DH1 (City Centre, Gilesgate) | £296,669 |
Four postcodes cluster between £137,249 and £169,436. DH9, DH6, DH2, and DH7 all sit within £33,000 of each other, so for a buyer the asking price across these four is broadly similar and the decision turns on yield, tenant profile, and growth rather than affordability. DH9 is the cheapest way into the county by a clear £25,000.
DH3 at £210,893 and DH8 at £194,240 form the middle tier. Birtley and Great Lumley in DH3 benefit from proximity to the A1(M) and the Tyne and Wear border, which pulls commuter demand up from Sunderland and Newcastle and lifts asking prices above the towns further west.
DH1 at £296,669 is a different market. The university, the cathedral, and the city-centre amenity push asking prices to more than double the DH9 figure, and DH1 is the only postcode where the asking price clears £250,000. The premium buys tenant quality and demand certainty from the student and professional markets rather than a higher rental return.

House Price Growth in Durham
Growth data shows where prices have moved over one, three, and five years. For buy-to-let, the five-year figure carries the most weight because it captures a full market cycle and filters out the noise a handful of transactions can create in a single year.
DH9 (Stanley) leads County Durham's five-year growth at 21.7%, followed by DH2 (Chester-le-Street) at 14.3% and DH8 (Consett) at 13.2%. DH9 is one of three postcodes positive across all three windows, at 5.7% over one year and 10.3% over three, alongside DH1 and DH3. A home there that cost around £113,000 five years ago now asks £137,249, and it did that from the lowest per-square-foot base in the county.
| Area | 1 Year | 3 Years | 5 Years |
|---|---|---|---|
| DH9 (Stanley, Dipton) | 5.7% | 10.3% | 21.7% |
| DH2 (Chester-le-Street, Ouston) | -8.7% | -5.2% | 14.3% |
| DH8 (Consett, Shotley Bridge) | -5.1% | 10.3% | 13.2% |
| DH6 (Coxhoe, Bowburn) | -4.4% | -1.4% | 8.3% |
| DH7 (Brandon, Langley Park) | -1.7% | 10.5% | 7.9% |
| DH1 (City Centre, Gilesgate) | 0.3% | 4.6% | 2.1% |
| DH3 (Birtley, Great Lumley) | 2.9% | 14.1% | 1.2% |
DH9 is the standout at every timeframe. One-year growth of 5.7% is the strongest positive reading in the county, and the three and five-year figures of 10.3% and 21.7% confirm that Stanley has been re-pricing steadily from a very low base rather than spiking once. At £137,249 it still sits well below the county mean of £190,986.
Five postcodes posted negative one-year readings. DH2 (-8.7%), DH8 (-5.1%), DH6 (-4.4%), DH7 (-1.7%), and the wider softening all follow the post-pandemic surge and the 2023 rate rises. In most of these the five-year figure stays firmly positive, so the recent dip reads as a correction off the surge rather than a longer decline. DH2's 14.3% over five years alongside its -8.7% over one year is the clearest example.
DH3 at 1.2% over five years is the weakest medium-term reading. Birtley and Great Lumley rose through the pandemic on commuter demand then gave much of it back, which is why the three-year figure of 14.1% sits above the five-year one. DH1 tells a related story from the other end: at 2.1% over five years the university city has been flat, because its asking prices are already stretched against local wages and the university drives rental demand rather than capital growth.
Monthly Property Sales in Durham
County Durham's monthly sales range from 24 in DH3 to 44 in DH8, with 254 transactions a month across the seven postcodes. Transaction volume shows which areas have the deepest buyer pools, and turnover, monthly sales as a share of the homes advertised for sale, shows how quickly a market clears its listings. Turnover here runs from 12% in DH1 up to 23% in DH2.
| Area | Sales Per Month | Turnover | Asking Price |
|---|---|---|---|
| DH8 (Consett, Shotley Bridge) | 44 | 16% | £194,240 |
| DH6 (Coxhoe, Bowburn) | 42 | 22% | £162,416 |
| DH9 (Stanley, Dipton) | 41 | 18% | £137,249 |
| DH7 (Brandon, Langley Park) | 38 | 15% | £169,436 |
| DH1 (City Centre, Gilesgate) | 34 | 12% | £296,669 |
| DH2 (Chester-le-Street, Ouston) | 31 | 23% | £165,997 |
| DH3 (Birtley, Great Lumley) | 24 | 15% | £210,893 |
DH8 and DH6 lead on volume with 44 and 42 sales a month. Consett covers the former steelworks town in the north-west, and Coxhoe covers the A177 corridor south of the city including Bowburn, home to the Amazon fulfilment centre. Both are active markets with deep buyer pools, which matters when it comes time to sell.
DH2 posts the highest turnover at 23% despite only 31 sales a month, because Chester-le-Street has a smaller total stock, so a given number of sales represents a larger share of it. DH6 pairs high volume with 22% turnover, the busiest combination in the county on both measures.
DH1 at 12% turnover on 34 sales a month reflects a tight city market. Durham's centre has limited stock relative to demand, and student-let properties in particular tend to be held once bought, so a decent monthly sales count still represents only a small slice of the total stock.
How Long Properties Take to Sell in Durham
Selling speed splits the county sharply: DH2 (Chester-le-Street) clears fastest at about 113 days, while DH1 (City Centre, Gilesgate) is slowest at roughly 254 days. Days on market is the typical number of days a home is up for sale before it sells; the months of unsold stock shows how much for-sale supply is sitting there at the current rate of sales.
| Area | Avg Days to Sell | Months of Unsold Stock | Market |
|---|---|---|---|
| DH2 (Chester-le-Street, Ouston) | 113 | 3.7 | Seller's market |
| DH6 (Coxhoe, Bowburn) | 138 | 4.5 | Seller's market |
| DH9 (Stanley, Dipton) | 190 | 6.3 | Balanced market |
| DH3 (Birtley, Great Lumley) | 203 | 6.7 | Balanced market |
| DH8 (Consett, Shotley Bridge) | 203 | 6.7 | Balanced market |
| DH7 (Brandon, Langley Park) | 217 | 7.1 | Balanced market |
| DH1 (City Centre, Gilesgate) | 254 | 8.3 | Balanced market |
A yield figure says nothing about how quickly you can get back out. DH2 at 3.7 months of unsold stock and DH6 at 4.5 both sit in seller's-market territory, so a resale there tends to move. DH1's 8.3 months is more than double DH2's, so the university city that commands the highest rents also asks for the most patience on exit. That trade-off is worth weighing against DH1's headline demand story.
What Type of Property Can You Buy in Durham?
The housing mix flips across the county: semis and detached houses dominate DH6 and DH8, while terraced homes make up nearly half of DH9 (47.5%) and more than a third of DH2 (34.5%). The stock in each postcode shapes which strategies fit, and the figures below are drawn from 2021 Census records for each postcode.
| Area | Detached | Semi-detached | Terraced | Flats |
|---|---|---|---|---|
| DH1 (City Centre, Gilesgate) | 35.4% | 36.0% | 14.9% | 7.7% |
| DH2 (Chester-le-Street, Ouston) | 23.4% | 38.3% | 34.5% | 3.6% |
| DH3 (Birtley, Great Lumley) | 33.1% | 34.8% | 27.2% | 4.6% |
| DH6 (Coxhoe, Bowburn) | 26.5% | 50.0% | 21.1% | 2.0% |
| DH7 (Brandon, Langley Park) | 39.9% | 26.3% | 30.1% | 3.4% |
| DH8 (Consett, Shotley Bridge) | 50.9% | 27.3% | 19.3% | 2.1% |
| DH9 (Stanley, Dipton) | 22.1% | 27.2% | 47.5% | 2.8% |
DH1 holds the largest share of flats at 7.7%, well ahead of any other postcode, and that smaller-unit stock lines up with the student and young-professional lettings the city centre supports. It is also the most balanced postcode, with detached, semi, and terraced stock each taking a sizeable slice.
DH9 is the county's terraced heartland at 47.5%, the highest share anywhere in the guide, which fits its position as the cheapest postcode by every price measure and the source of its low per-square-foot figure. DH2 is close behind at 34.5% terraced. This is the stock that most often forms the working-tenant rental market across the former mining towns.
DH8 is the most detached-dominated postcode at 50.9%, with DH7 next at 39.9%. Detached and semi-detached houses together account for more than three-quarters of the stock in both, which weights them towards owner-occupier family homes rather than the smaller units that drive rental income.
Flats combine purpose-built and converted units. A small share of mobile and temporary dwellings is not shown, so rows may not total 100%.
Durham Rental Market Analysis
Monthly rents in County Durham range from £633 in DH9 to £1,187 in DH1, with gross rental yields from 4.6% to 5.5% across all seven postcodes. For investors asking whether buy-to-let still works as an investment in the North East, the sections below break down rents, yields, and tenant affordability postcode by postcode. If you are looking at how to start a property business, County Durham's low asking prices and yields of 5% or more in four of its seven postcodes make it one of the more accessible markets in England. Browse available buy-to-let property across the region.
Average Rent & Gross Rental Yields in Durham
Gross rental yields in County Durham run from 4.6% in DH3 and DH8 up to 5.5% in DH7 and DH9. Gross yield is calculated from the average asking price and average monthly rent for each postcode. It does not account for void periods, maintenance, management fees, or mortgage costs, so it is a starting point for comparison rather than a profit forecast. The yield spread across the county is 0.9 percentage points, which is tighter than many cities and reflects how uniformly prices and rents move together here.
| Area | Average Monthly Rent | Asking Price | Gross Yield |
|---|---|---|---|
| DH7 (Brandon, Langley Park) | £780 | £169,436 | 5.5% |
| DH9 (Stanley, Dipton) | £633 | £137,249 | 5.5% |
| DH6 (Coxhoe, Bowburn) | £718 | £162,416 | 5.3% |
| DH2 (Chester-le-Street, Ouston) | £695 | £165,997 | 5.0% |
| DH1 (City Centre, Gilesgate) | £1,187 | £296,669 | 4.8% |
| DH3 (Birtley, Great Lumley) | £800 | £210,893 | 4.6% |
| DH8 (Consett, Shotley Bridge) | £741 | £194,240 | 4.6% |
DH7 and DH9 share the top yield at 5.5%, but they reach it differently. DH7 pairs a £780 rent with a £169,436 asking price, while DH9 pairs the county's lowest rent of £633 with its lowest asking price of £137,249. For a capital-constrained investor, DH9 hits the same 5.5% return from the smallest outlay in the county.
Four postcodes sit between 4.8% and 5.5%. DH7, DH9, DH6, and DH2 form a tight band where the income return is broadly similar, so the choice between them turns on tenant profile, growth record, and how fast the market moves rather than on yield alone.
DH1 at 4.8% is a puzzle on first read. It carries the county's highest rent at £1,187 a month, nearly double the DH9 figure, but its £296,669 asking price absorbs that premium and the yield lands mid-table. The single-let figure also understates what student HMOs near the university achieve, where per-room rents lift the effective return above the headline number.
DH8 and DH3 sit at the bottom at 4.6%. Consett's rents do not quite keep pace with its £194,240 asking price, and DH3's Tyne-and-Wear-border commuter demand lifts asking prices faster than rents, which is where the price-to-rent balance tilts hardest against income.
Is Durham Rent High?
Monthly rents in County Durham consume between 22.7% and 42.6% of the local median gross monthly salary. The widely cited threshold for rent affordability is 30% of gross income. Only DH1 sits above that line; the other six postcodes fall below it, and five sit below 27%. That is unusually affordable for a county with yields above 4.6%.
The median gross weekly salary in County Durham is £643.00, which equates to £2,786 per month or £33,436 per year. This is below the North East regional median of £669.90 per week and the Great Britain median of £752.40 per week. Data from the Nomis Labour Market Profile (ASHE 2025).
| Rank | Area | Rent as % of Income |
|---|---|---|
| 1 | DH1 (City Centre, Gilesgate) | 42.6% |
| 2 | DH3 (Birtley, Great Lumley) | 28.7% |
| 3 | DH7 (Brandon, Langley Park) | 28.0% |
| 4 | DH8 (Consett, Shotley Bridge) | 26.6% |
| 5 | DH6 (Coxhoe, Bowburn) | 25.8% |
| 6 | DH2 (Chester-le-Street, Ouston) | 24.9% |
| 7 | DH9 (Stanley, Dipton) | 22.7% |
DH1 at 42.6% looks stretched on paper, but the county median salary is the wrong yardstick for it. Durham city-centre rents are driven by students, postgraduates, and young professionals working in the city, most of whom sit outside the local median-wage picture, so the figure overstates the real pressure on DH1 tenants.
Six of seven postcodes sit below 30%, and DH9 at 22.7% is the most affordable, consistent with its position as the cheapest postcode on every price measure. Low rent-to-income ratios mean tenants can absorb modest rent rises without stress, which tends to translate into fewer arrears, longer tenancies, and less void for landlords.
How Big Is Durham's Private Rented Sector?
The private rented sector is deepest in DH8 at 24.6% of households and shallowest in DH2 at 12.2%. The share of homes already rented privately is a guide to the size of the established tenant pool and the local lettings market. The table below shows household tenure by postcode.
| Area | Owned Outright | Owned with Mortgage | Private Rented | Social Rented |
|---|---|---|---|---|
| DH8 (Consett, Shotley Bridge) | 39.7% | 29.6% | 24.6% | 6.1% |
| DH1 (City Centre, Gilesgate) | 42.4% | 31.6% | 18.2% | 7.6% |
| DH9 (Stanley, Dipton) | 38.5% | 29.3% | 17.1% | 14.9% |
| DH7 (Brandon, Langley Park) | 46.2% | 31.3% | 15.6% | 6.6% |
| DH3 (Birtley, Great Lumley) | 40.8% | 28.6% | 14.9% | 15.4% |
| DH6 (Coxhoe, Bowburn) | 36.2% | 29.5% | 13.3% | 20.6% |
| DH2 (Chester-le-Street, Ouston) | 36.7% | 35.4% | 12.2% | 15.0% |
DH8 has the deepest private rented sector in the county at 24.6% of households, and Consett pairs that with the county's second-highest sales volume, which points to an active lettings and resale market in the same postcode. DH1 and DH9 follow at 18.2% and 17.1%, and in DH1 that established tenant pool sits alongside the university demand.
DH2 and DH6 have the smallest private rented sectors at 12.2% and 13.3%, and both carry above-average social-rented shares, with DH6 the highest in the county at 20.6%. A smaller private rented base points to more owner-occupation and a thinner existing tenant pool, which is a different signal from yield: DH6 still delivers a 5.3% gross return, it just has fewer homes already let privately to buy into.
Where the rental listing volume is thick enough to read, the balance currently sits with landlords rather than tenants. In DH1, DH6, DH7, and DH9 homes were letting in roughly 32 to 76 days on average, which points to firm tenant demand across those four postcodes. The other three have too few live rental listings at any one time to read reliably.
Local Housing Allowance Rates in Durham
The seven postcodes in this guide fall within the Durham Broad Rental Market Area, where Local Housing Allowance runs from £90.50 a week for a shared room to £151.86 a week for a four-bedroom home. Local Housing Allowance sets the maximum housing support a tenant on benefits can receive, so it is one read on the paying power of the benefit-supported end of the market. The rates below apply across all seven postcodes. To check the current rate for a specific address, you can use the government's official Local Housing Allowance calculator.
| Property Size | Weekly LHA Rate | Monthly Equivalent |
|---|---|---|
| Shared accommodation | £90.50 | £392 |
| 1 bedroom | £90.50 | £392 |
| 2 bedrooms | £92.05 | £399 |
| 3 bedrooms | £109.32 | £474 |
| 4 bedrooms | £151.86 | £658 |
The two-bedroom LHA rate of £92.05 a week works out at about £399 a month, which sits below the £633 to £1,187 open-market rents recorded across the county's postcodes. A benefit-backed tenancy at the LHA rate therefore lands under County Durham's market rents, and the stock that fits within these rates is concentrated in the cheaper terraced markets of DH9 and DH6. The rates are identical across all seven postcodes because they are set across the whole Durham market area.
Buy-to-Let Considerations
Are House Prices High in Durham? Price-to-Earnings Ratios
Purchasing a property in County Durham requires between 4.1 and 8.9 times the median annual salary. This is based on the Nomis Labour Market Profile for County Durham showing the median gross annual income for County Durham residents is £33,436.
For a yardstick, England's average sold price of £289,946 sits at 7.4 times the Great Britain median salary of £39,125. Six of County Durham's seven postcodes come in below that 7.4x mark, so they are more affordable against local wages than the country as a whole is against national wages.
| Rank | Area | Price-to-Earnings Ratio |
|---|---|---|
| 1 | DH9 (Stanley, Dipton) | 4.1x |
| 2 | DH6 (Coxhoe, Bowburn) | 4.9x |
| 3 | DH2 (Chester-le-Street, Ouston) | 5.0x |
| 4 | DH7 (Brandon, Langley Park) | 5.1x |
| 5 | DH8 (Consett, Shotley Bridge) | 5.8x |
| 6 | DH3 (Birtley, Great Lumley) | 6.3x |
| 7 | DH1 (City Centre, Gilesgate) | 8.9x |
DH9 at 4.1x is the most affordable entry in the county, where property costs a little over four years of the local median salary. That kind of ratio is virtually extinct in southern England, and it sits alongside DH9's 5.5% yield and 21.7% five-year growth. The four cheapest postcodes all fall below 5.2x, and each of them clears a 5.0% gross yield, which is the affordability-and-return combination income-focused investors tend to look for.
DH1 at 8.9x is the only postcode above the national benchmark. The university and cathedral city command a premium that pushes it well past the affordability profile of the rest of the county, and buyers there are typically drawn by the demand certainty of the student and professional markets rather than by an affordable asking price.
Deposit Requirements in Durham
A 30% deposit on a buy-to-let property in County Durham ranges from £41,175 in DH9 to £89,001 in DH1. The table below uses a 30% deposit rather than the lender minimum because it typically unlocks better interest rates, which matters for cash flow in a yield-driven market. Six of the seven postcodes need a deposit under £64,000.
Beyond the deposit, budget for the stamp duty calculation and other ongoing rental costs that make up the total capital required.
| Rank | Area | 30% Deposit Required |
|---|---|---|
| 1 | DH9 (Stanley, Dipton) | £41,175 |
| 2 | DH6 (Coxhoe, Bowburn) | £48,725 |
| 3 | DH2 (Chester-le-Street, Ouston) | £49,799 |
| 4 | DH7 (Brandon, Langley Park) | £50,831 |
| 5 | DH8 (Consett, Shotley Bridge) | £58,272 |
| 6 | DH3 (Birtley, Great Lumley) | £63,268 |
| 7 | DH1 (City Centre, Gilesgate) | £89,001 |
DH9 at £41,175 is the lowest deposit in the county and it also delivers the strongest five-year growth at 21.7% alongside a 5.5% yield. For a capital-constrained investor, there is no cheaper way into County Durham that also clears a 5% return. Stepping up to DH6, DH2, or DH7 costs between £7,500 and £9,700 more, and that band buys a similar yield with a different mix of growth record and tenant profile rather than a materially different return.
A clear gap separates the sub-£59,000 tier from DH3 and DH1. DH3 at £63,268 and DH1 at £89,001 sit in a different capital bracket, and DH1 is the only postcode where a 30% deposit clears £89,000. That premium buys access to Durham's strongest and most certain rental demand from the student and professional markets, at the cost of the county's tightest exit and its lowest capital growth.
What the Durham Data Tells Buy-to-Let Investors
In County Durham the cheapest way in is also one of the two highest-yielding postcodes. DH9 (Stanley) shares the top yield at 5.5%, carries the lowest asking price for investment property in Durham at £137,249, and is the most affordable against local earnings at 4.1 times income. A 30% deposit there is £41,175, the lowest in the county, for a home renting at £633 a month.
DH9 also led five-year growth at 21.7% and was one of three postcodes positive across every window. That pairing of the top yield and the strongest growth in the same, cheapest postcode is the clearest signal in the data. DH7 matches its 5.5% yield from a slightly higher £169,436 base with a firmer three-year growth record, and DH6 and DH2 fill out the sub-£166,000, sub-5.1x band with yields of 5.3% and 5.0%.
DH1 sits at the other end. Asking prices of £296,669 and a deposit of £89,001 put it in a different capital bracket. Its 4.8% yield lands mid-table and its 2.1% five-year growth is the flattest in the county. What DH1 offers instead is a Russell Group university, replenishing student demand every September, and the option to run HMO lets at per-room rates above the single-let figures. DH3 and DH8 sit at the bottom of the yield table at 4.6%, where commuter-driven and steelworks-town prices have outrun rents. Investors who want to come in below asking often look through off-market property in Durham channels.
How Durham Compares
County Durham's mean asking price of £190,986 is the third of four North East locations compared here, yet its top yield of 5.5% is well below the other three. The comparison below places Durham alongside three nearby locations, each with a different investor profile. The mean asking price and mean monthly rent are simple averages across all postcodes with data. Top gross yield is the single highest postcode yield in each location.
| Location | Mean Asking Price | Mean Monthly Rent | Mean Gross Yield | Top Yield (postcode) |
|---|---|---|---|---|
| Sunderland | £163,026 | £698 | 5.1% | 12.0% (SR1) |
| Middlesbrough | £187,754 | £743 | 4.7% | 8.2% (TS1, TS3) |
| Durham | £190,986 | £793 | 5.0% | 5.5% (DH7, DH9) |
| Newcastle | £262,699 | £1,122 | 5.1% | 9.3% (NE1) |
Durham's mean asking price of £190,986 sits just above Middlesbrough's £187,754 and below Newcastle's £262,699. Sunderland is the cheapest of the four to buy into, and Middlesbrough lands almost level with Durham on price. Durham does carry the highest mean rent of the three cheaper markets at £793.
The yield gap is the story here. Durham's top yield of 5.5% is well short of Middlesbrough's 8.2%, Newcastle's 9.3%, and the thin-market 12.0% that tops Sunderland's table. Those higher headline figures come from specific postcodes with very high rents relative to their asking prices. Durham's yield band of 4.6% to 5.5% is narrower and more even, and every postcode in the county clears 4.6%, so the trade is consistency of return against a lower top number.
Durham's distinguishing feature is its university. None of the other three has a Russell Group institution the size of Durham's. That creates a tenant base funded externally through student loans and family support, replenished every September and largely insulated from the local economic cycle. For an investor weighing demand certainty against a headline yield, that institutional anchor is what Durham offers in place of the higher returns further up the coast. For a data-driven comparison across all UK locations, see our best places to invest in buy-to-let guide.
Frequently Asked Questions
What are the best areas in Durham for buy-to-let?
The postcodes split fairly cleanly by what you are after. DH9 (Stanley and Dipton) is the cheapest way in at £137,249, shares the top yield at 5.5%, and led five-year growth at 21.7%, so it does the most across income and growth from the smallest outlay. DH7 (Brandon and Langley Park) matches that 5.5% yield from a slightly higher base with a firmer three-year record. DH6 (Coxhoe and Bowburn) and DH2 (Chester-le-Street) fill out the affordable band at 5.3% and 5.0%. At the top end, DH1 is Durham City itself, where the university drives demand and landlords can run HMOs at per-room rates above the headline single-let figure. If income is the priority, DH9 and DH7 lead on yield and price; if it is the student market, DH1 is where the demand sits.
Why is Durham property so cheap?
County Durham's low prices reflect its economic history. The coalfield closures of the 1980s and 1990s removed the primary employer from dozens of towns, and the terraced housing built for mining families remained long after the jobs went. That stock still makes up nearly half of DH9. Distance from major employment centres plays a part too: Durham City is well connected, but outlying towns like Stanley and Consett sit further from the pull of Newcastle and Teesside. Lower local wages, a median of £33,436 against £39,125 nationally, cap what buyers and tenants can pay. The result is sold prices 53.2% below the England average. The question that matters is whether rents hold up against those prices, and the yield data across this guide shows that they do, with six of seven postcodes above 4.8%.
How do student accommodation demand, costs and returns compare in Durham?
Durham University is a Russell Group institution with more than 21,000 students across its collegiate system. Many first-years live in college accommodation, but second and third-year students typically rent in the private sector, and the core student letting areas are in DH1 near the city centre, Gilesgate, and the Viaduct. The headline single-let yield of 4.8% in DH1 understates what HMO landlords achieve per room. A sample of live DH1 room adverts puts a double with a shared bathroom at around £140 a week, with most between £110 and £180 across 21 adverts. Summer voids and more hands-on management come with the territory, though Durham's growing postgraduate population softens the seasonal risk. For the purpose-built end of the market, see our guide to purpose-built student accommodation.
Do I need a licence to let a property in Durham?
You may do. Durham County Council operates a selective licensing scheme that designates a number of areas across the county where landlords of privately rented homes must hold a licence. The scheme came into effect on 1 April 2022 and runs to 31 March 2027, and it targets areas with low housing demand, anti-social behaviour, or deprivation, several of which sit within the postcodes in this guide. The council runs a postcode checker so you can confirm whether a specific property falls inside a designated area before you buy. Larger shared houses may also need an HMO licence separately. Always check the current position with the council directly, because designated areas and scheme terms change.
Can I find buy-to-let property in Durham under £100,000?
The average asking prices in this guide run from £137,249 in DH9 up to £296,669 in DH1, but these are postcode averages across all property types. Individual terraced houses in DH9 (Stanley) and DH6 (Coxhoe) do list below £100,000, and flats across several postcodes appear well under £80,000. County Durham's average flat price of £75,735 on the Land Registry index confirms that sub-£100,000 stock exists in volume. At that price a 30% deposit is under £30,000. Due diligence on actual tenant demand, property condition, and the specific street matters most at the lower end of the market.
What are average house prices in Durham?
The average sold price across County Durham is £135,767 on the Land Registry index, about 53.2% below the England average of £289,946 as of March 2026. Asking prices by postcode run from £137,249 in DH9 (Stanley, Dipton) up to £296,669 in DH1 (City Centre, Gilesgate), with a county mean of £190,986. By type, detached homes average £232,205, semi-detached £136,560, terraced £112,354, and flats £75,735. Through a buy-to-let lens, DH9 is the cheapest entry and shares the top yield at 5.5%, while DH8 and DH3 sit at the bottom of the yield table at 4.6%.
What type of property is most common in Durham?
It varies by postcode more than in most markets. Semi-detached houses make up half of DH6's stock and are the largest single type in DH1 and DH2, while detached houses dominate DH8 at 50.9% and DH7 at 39.9%. Terraced homes are the story at the cheaper end, making up 47.5% of DH9 (Stanley) and 34.5% of DH2 (Chester-le-Street), which is the stock that most often forms the working-tenant rental market. Flats are scarce everywhere outside DH1, where they reach 7.7%.
How do I buy an investment property in Durham?
Start by deciding whether you are buying for income or for the student market, because that points you at a different postcode. DH9 (Stanley, Dipton) is the cheapest entry at £137,249 and shares the top yield at 5.5%, and DH7 (Brandon, Langley Park) matches that yield from a slightly higher base. DH1 (City Centre, Gilesgate) is where the university and HMO demand sits, at a higher price and a 4.8% single-let yield. Budget for a 30% deposit, which runs from £41,175 in DH9 to £89,001 in DH1, and check whether the specific property falls inside the council's selective licensing area. Beyond what is listed openly, plenty of experienced investors buy below asking through off-market property and below market value properties. To see what is available now, browse investment properties or buy-to-let opportunities.
Ready to buy property?
Browse investment properties with prices and gross yields shown for each opportunity.
Get property alerts