Where to Buy Property Investments in Poole: Yields of 4.9%
Poole is a coastal town in Dorset, on England's south coast within the Bournemouth, Christchurch and Poole unitary authority. The top gross rental yield sits at 4.9% in BH12 (Upper Parkstone, Newtown), with average sold prices across the local authority area recorded at £309,673. That is 6.1% above the England average of £291,865 and 2.8% above the South West regional average of £301,226. The town's population reached 400,200 in the 2021 Census, a 5.6% increase from 2011.
Poole is one of the few locations in this series where sold prices sit above both national and regional benchmarks. The headline figure is pulled upward by BH13 (Canford Cliffs, Sandbanks), where average prices reach £665,122. Strip that postcode out and the remaining seven postcodes average £412,132. Entry-level asking prices start from £325,043 in BH15 (Town Centre, Hamworthy), and six of the eight postcodes carry rental data with monthly rents ranging from £1,228 to £1,876.
Poole is a coastal town in Dorset, South West England. This guide covers eight postcodes across the Bournemouth, Christchurch and Poole unitary authority (ONS code E14001429). It includes areas from Sandbanks and Canford Cliffs in the south to Wimborne Minster in the north, plus Broadstone, Canford Heath, and the town centre around buy-to-let properties in the harbour area. Neighbouring Bournemouth shares the same unitary authority. Poole sits within the South West investment region.
Article updated: March 2026
Poole Buy-to-Let Market Overview 2026
Poole's property market sits above the England average, with a wide spread between premium coastal postcodes and more affordable inland areas where yields are strongest.
- Average sold price: £309,673 (6.1% above England's £291,865)
- Asking price range: £325,043 (BH15) to £665,122 (BH13)
- Rental yields: 3.0% (BH14) to 4.9% (BH12) across 6 postcodes with rental data
- Rental income: Monthly rents from £1,228 (BH17) to £1,876 (BH13)
- Price per sq ft: House prices from £353/sq ft (BH12) to £433/sq ft (BH13)
- Market activity: Sales ranging from 12 per month (BH13) to 42 per month (BH15)
- Deposit requirements: 30% deposits range from £97,513 (BH15) to £199,536 (BH13)
- Affordability ratios: Property prices from 8.7 to 17.7 times Poole's median annual salary of £37,493
Contents

-
by Robert Jones, Founder of Property Investments UK
With two decades in UK property, Rob has been investing in buy-to-let since 2005, and uses property data to develop tools for property market analysis.

Property Data Sources
Our location guide relies on diverse, authoritative datasets including:
- HM Land Registry UK House Price Index
- Ministry of Housing, Communities and Local Government
- Ordnance Survey Data Hub
- Propertydata.co.uk
We update our property data quarterly to ensure accuracy. Last update: March 2026. All data is presented as provided by our sources without adjustments or amendments.
Why Invest in Poole?
Poole has a population of 400,200 (2021 Census), a 5.6% increase from 378,900 in 2011. The town sits on one of the largest natural harbours in the world, with a local economy built around financial services, marine engineering, advanced manufacturing, and tourism. Bournemouth University and Arts University Bournemouth both draw students to the wider conurbation, supporting year-round rental demand across the BH postcode area.
The median gross annual salary for Poole residents is £37,493. That places local earnings marginally below the South West regional median of £37,544 per year and below the Great Britain median of £39,125 per year. The employment rate stands at 77.3%, with unemployment at 4.9%.
Poole Economic Summary
- Population: 400,200 (2021 Census). Growth of 5.6% from 2011.
- Median annual salary: £37,493 (local), £37,544 (South West), £39,125 (Great Britain)
- Employment rate: 77.3% (local), 76.0% (South West), 75.4% (Great Britain)
- Unemployment rate: 4.9% (local), 3.4% (South West), 4.0% (Great Britain)
- Key employment sectors: Financial services, marine engineering, advanced manufacturing, tourism, higher education
Source: ONS Census 2021, Nomis Labour Market Profile (ASHE 2025, Employment Oct 2024-Sep 2025)
Regeneration and Investment in Poole
Over £75m of confirmed investment is targeted at Poole's waterfront and town centre, with plans for more than 1,170 new homes across three major schemes. Public and private money is flowing into former industrial land, harbour-side sites, and the High Street.
- Holes Bay Regeneration (Funding secured, £5m Local Growth Fund): The South West's largest brownfield regeneration site at 40 acres on Poole Harbour, purchased by BCP Council with £5m from the Dorset LEP. The scheme is planned to deliver up to 830 new homes alongside employment land and commercial space in BH15. Updates at BCP Council.
- West Quay Marina (Planning approved, £69m): A £69m waterfront residential scheme at West Quay Road delivering approximately 300 new homes across multiple blocks in BH15, backed by Octopus Real Estate and Sirius Property Finance. The development replaces a surface car park on the harbour edge. Updates at London Land Group.
- Poole High Street Heritage Action Zone (In progress, £1.2m): A four-year programme funded by Historic England and BCP Council to restore listed buildings, improve shopfronts and facades, and increase footfall to the High Street. The wider town centre regeneration includes a £25m Levelling Up bid for a covered market, food hall, and up to 40 new homes. Updates at BCP Council.

Poole Property Market Analysis
When was the last house price crash in Poole?
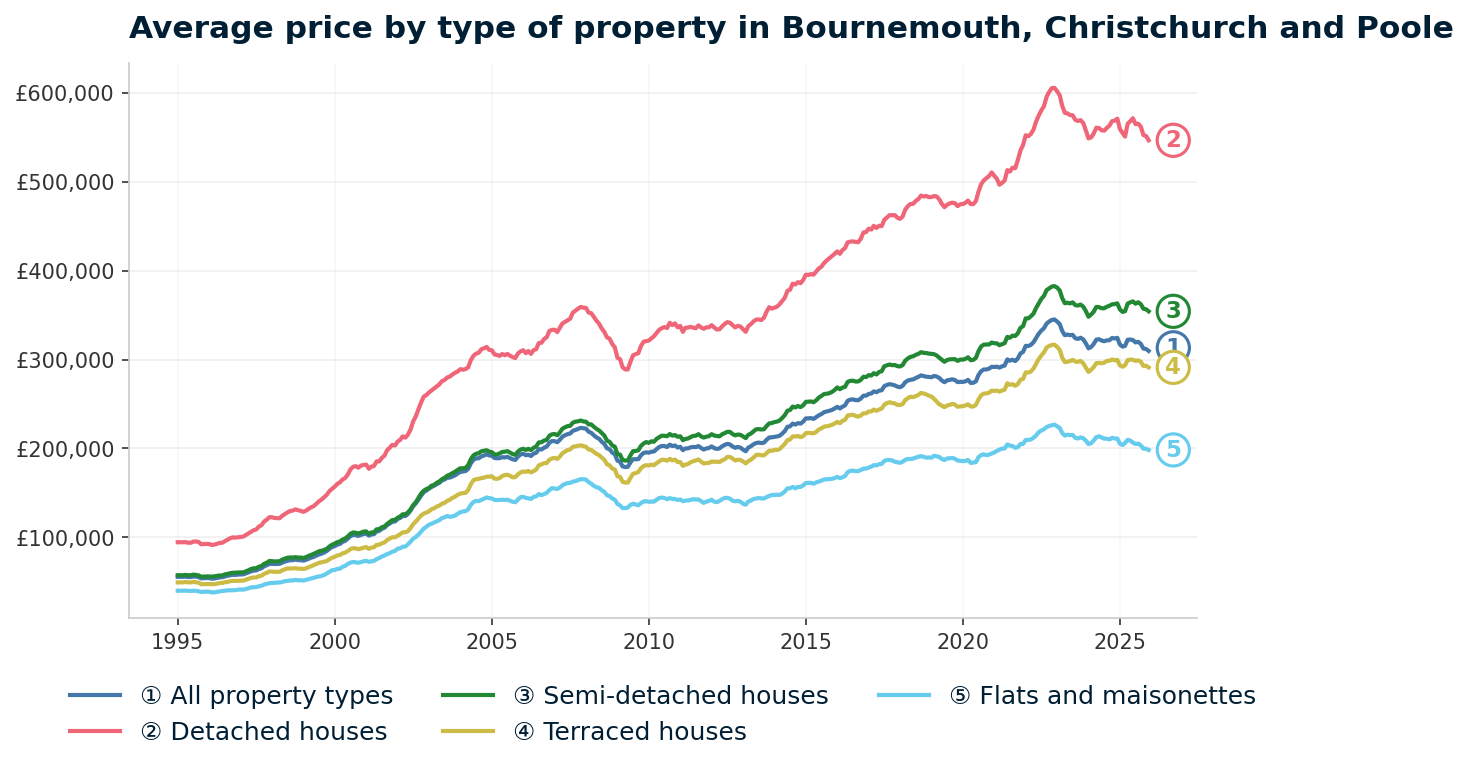
Poole sits within the Bournemouth, Christchurch and Poole unitary authority, so all sold property prices from HM Land Registry are available at this level. The data covers January 1995 to December 2025, a 30-year window during which average prices rose from £55,465 to £309,673. That window includes two full boom-bust cycles and the pandemic surge.
1995-2007: In January 1995, the average property in BCP sold for £55,465. By November 2007, that figure had climbed to £223,171, a 302.4% increase across 12 years. Sustained economic growth, low interest rates, and strong coastal demand drove the run. Prices passed £100,000 in mid-2000 and £150,000 by late 2002.
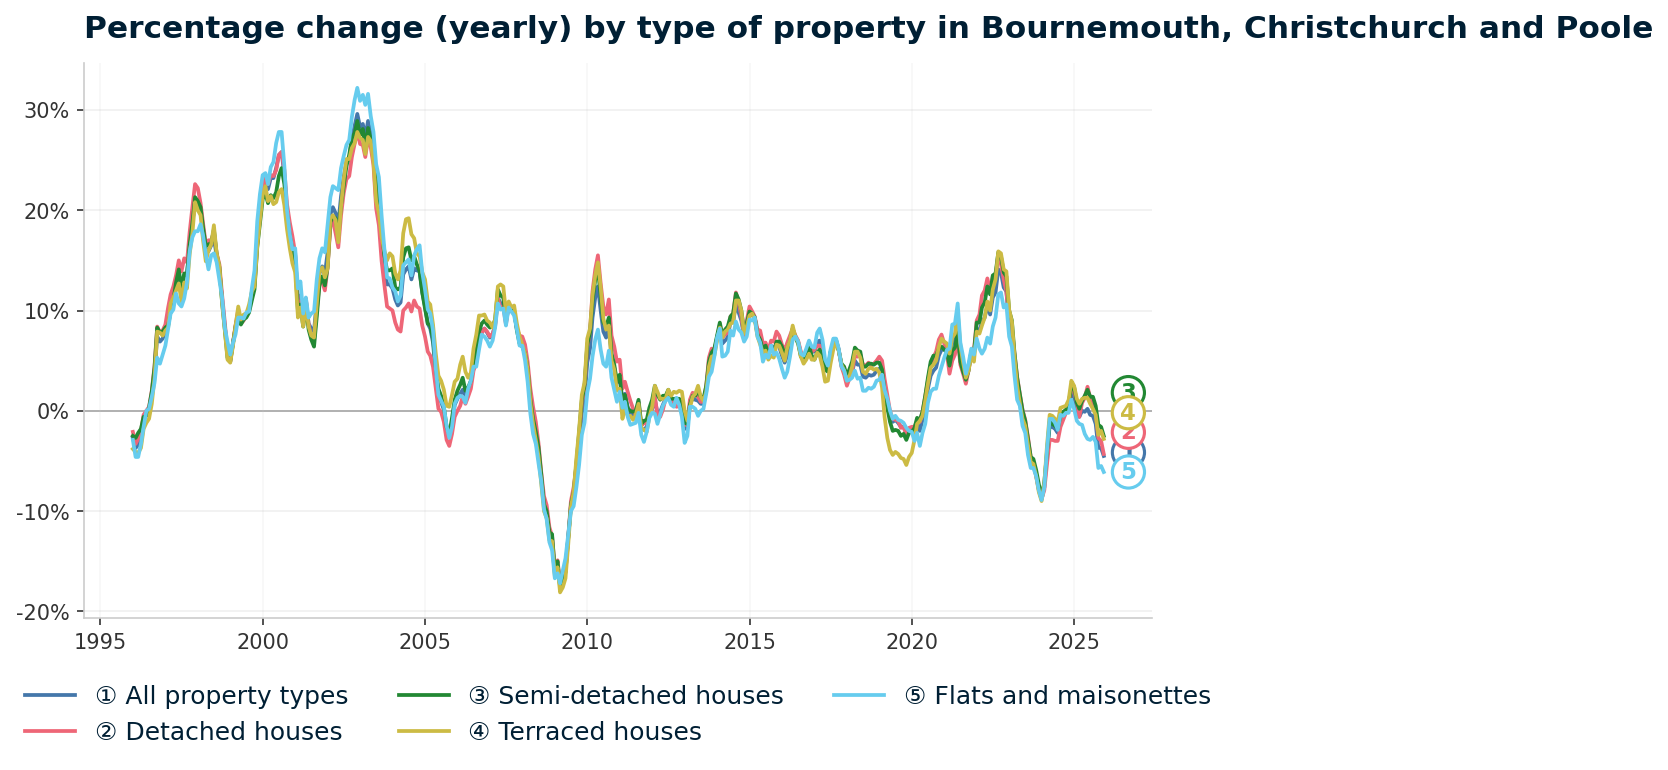
2008-2009 crash: Prices peaked at £223,171 in November 2007 and fell to a trough of £179,039 by April 2009. A decline of 19.8% over 17 months. The worst annual change reading hit -17.4% in March 2009. For comparison, England's worst reading was -15.5% (March 2009) and the South West's worst was -16.6% (January 2009). BCP fell harder than both benchmarks.
2010-2013 stagnation: Partial recovery to £195,201 by January 2010, then a stall. Between January 2010 and January 2013, the average price moved from £195,201 to £198,590. Three years of near-zero growth.
Recovery came in June 2014, when the average reached £224,321 and first matched the pre-crash peak. That was five years and two months from the April 2009 trough. By January 2016, prices had reached £246,749. Steady gains continued to £280,099 by January 2019, driven by Poole's lifestyle appeal and the ongoing shortage of coastal housing stock.
2020-2022 pandemic surge: Prices dipped briefly to £274,812 in January 2020 before surging to a peak of £345,134 in December 2022. A 25.6% increase in under three years, amplified by the stamp duty holiday and the post-pandemic coastal relocation trend.
Since December 2022, higher mortgage rates have triggered a 10.3% correction. Prices fell from £345,134 to £309,673 in December 2025. The annual change reading stood at -4.5%.
Long-term growth summary:
- 5 years (Dec 2020 to Dec 2025): 6.1% growth (£291,844 to £309,673)
- 10 years (Dec 2015 to Dec 2025): 26.5% growth (£244,834 to £309,673)
- 15 years (Dec 2010 to Dec 2025): 54.0% growth (£201,067 to £309,673)
- 20 years (Dec 2005 to Dec 2025): 60.3% growth (£193,211 to £309,673)
- 30 years (Dec 1995 to Dec 2025): 472.2% growth (£54,123 to £309,673)
BCP prices are back to levels last seen in early 2021. Mortgage rates were below 2% in 2020-2021 and sit above 4% in 2026. That shift in borrowing costs is the primary driver of the pullback, not a structural change in Poole's housing demand.
Source: HM Land Registry House Price Index for Bournemouth, Christchurch and Poole, January 1995 to December 2025.
Thinking of Buying?
We have off-market investment properties averaging 8%+ annual yield.
View Property DealsSold House Prices in Poole
The average sold price across all property types in the Bournemouth, Christchurch and Poole area is £309,673, which is 6.1% above the England average of £291,865. That above-average headline masks a split. Detached, semi-detached, and terraced properties all carry premiums over England. Flats are the exception, sitting 9.6% below. The difference tells you about Poole's housing mix and its coastal flat stock.
| Property Type | Poole Average | England Average | Difference |
|---|---|---|---|
| Detached houses | £546,702 | £471,667 | +15.9% |
| Semi-detached houses | £354,270 | £289,135 | +22.5% |
| Terraced houses | £291,215 | £244,830 | +18.9% |
| Flats and maisonettes | £198,290 | £219,340 | -9.6% |
| All property types | £309,673 | £291,865 | +6.1% |
Detached houses in Poole sell for £546,702 on average, 15.9% above England's £471,667. The Sandbanks and Canford Cliffs market in BH13 pushes this figure upward. Away from the peninsula, detached stock in BH15 and BH17 transacts at substantially lower levels, but the Land Registry aggregates all BCP sales into a single figure.
Semi-detached properties carry the largest premium at 22.5% above England. At £354,270 against England's £289,135, this reflects the scarcity of semi-detached stock in a coastal market where period homes and 1930s suburbs command higher prices per unit.
Terraced houses at £291,215 sit 18.9% above England's £244,830. The Victorian and Edwardian terraces in Poole's town centre and Parkstone neighbourhoods make up the bulk of this stock. These are the property types that feed directly into the BH15 and BH12 rental market.
Flats and maisonettes at £198,290 are the only property type below England's average, sitting 9.6% lower than the national £219,340. Poole's flat market includes a mix of retirement-heavy coastal blocks and ex-holiday lets. Lower flat prices against a higher overall average create a different entry point for investors looking at the BH15 and BH12 postcodes where yields are strongest.
Property Data Sources
Our location guide relies on diverse, authoritative datasets including:
- HM Land Registry UK House Price Index
- Ministry of Housing, Communities and Local Government
- Ordnance Survey Data Hub
- Propertydata.co.uk
We update our property data quarterly to ensure accuracy. Last update: March 2026. All data is presented as provided by our sources without adjustments or amendments.
Price Per Square Foot in Poole
Price per square foot strips out the effect of property size and shows where you pay most and least for each unit of floor space. Across Poole's eight postcodes, transaction-based sold prices range from £353 per square foot in BH12 (Upper Parkstone, Newtown) to £433 per square foot in BH13 (Canford Cliffs, Sandbanks). That is a spread of £80 per square foot between the cheapest and most expensive areas.
| Rank | Area | Price per sq ft |
|---|---|---|
| 1 | BH12 (Upper Parkstone, Newtown) | £353 |
| 2 | BH15 (Town Centre, Hamworthy) | £361 |
| 3 | BH16 (Upton, Turlin Moor) | £374 |
| 4 | BH17 (Canford Heath, Creekmoor) | £397 |
| 5 | BH21 (Wimborne Minster) | £409 |
| 6 | BH14 (Lower Parkstone, Penn Hill) | £413 |
| 7 | BH18 (Broadstone) | £420 |
| 8 | BH13 (Canford Cliffs, Sandbanks) | £433 |
BH12 and BH15 offer the lowest cost per square foot at £353 and £361 respectively. These are the same two postcodes that top the yield rankings. The correlation is direct: cheaper floor space combined with solid rental income produces the strongest returns. BH13's £433 per square foot is the premium end, but the gap between cheapest and most expensive is narrower than in many cities. An investor in BH12 pays 18.5% less per square foot than one in BH13, while collecting a significantly higher yield.
For Sale Asking Prices in Poole
Asking prices reflect what sellers are listing at today, rather than the completed transaction prices in the Land Registry data. The gap between Poole's cheapest and most expensive postcodes is £340,079, from £325,043 in BH15 (Town Centre, Hamworthy) to £665,122 in BH13 (Canford Cliffs, Sandbanks). The mean asking price across all eight postcodes is £443,756.
| Rank | Area | Asking Price |
|---|---|---|
| 1 | BH15 (Town Centre, Hamworthy) | £325,043 |
| 2 | BH17 (Canford Heath, Creekmoor) | £327,497 |
| 3 | BH12 (Upper Parkstone, Newtown) | £332,900 |
| 4 | BH16 (Upton, Turlin Moor) | £344,494 |
| 5 | BH21 (Wimborne Minster) | £498,052 |
| 6 | BH14 (Lower Parkstone, Penn Hill) | £519,779 |
| 7 | BH18 (Broadstone) | £537,163 |
| 8 | BH13 (Canford Cliffs, Sandbanks) | £665,122 |
Four postcodes cluster below £345,000: BH15, BH17, BH12, and BH16. These represent Poole's accessible entry points. The remaining four postcodes jump above £498,000. There is no middle ground. This two-tier structure is the defining feature of Poole's property market. Investors looking for below market value properties or repossessed houses for sale will find the widest scope in BH15 and BH12, where asking prices sit 51% and 50% below BH13 respectively.

House Price Growth in Poole
Five-year growth across Poole's postcodes ranges from -22.8% in BH13 (Canford Cliffs, Sandbanks) to +19.4% in BH12 (Upper Parkstone, Newtown). The premium postcodes have pulled back sharply from pandemic highs, while the more affordable areas have held value or grown. This is the reverse of the usual pattern: the cheapest postcodes have outperformed the most expensive over five years.
| Area | 1 Year | 3 Years | 5 Years |
|---|---|---|---|
| BH12 (Upper Parkstone, Newtown) | +7.1% | +0.2% | +19.4% |
| BH17 (Canford Heath, Creekmoor) | -0.5% | -6.2% | +15.5% |
| BH16 (Upton, Turlin Moor) | +0.1% | -10.1% | +14.5% |
| BH18 (Broadstone) | +5.5% | -5.1% | +14.4% |
| BH15 (Town Centre, Hamworthy) | -0.7% | -1.0% | +9.4% |
| BH14 (Lower Parkstone, Penn Hill) | +11.4% | -0.5% | +5.9% |
| BH21 (Wimborne Minster) | -2.2% | -8.7% | +5.9% |
| BH13 (Canford Cliffs, Sandbanks) | -16.3% | -26.3% | -22.8% |
BH12 leads with 19.4% five-year growth and is the only postcode showing positive movement across all three timeframes, including +7.1% over one year and +0.2% over three years. BH17, BH16, and BH18 all show solid five-year growth between 14.4% and 15.5%, though their three-year figures are negative, reflecting the post-pandemic correction.
BH13 stands alone as the major outlier. A 22.8% decline over five years and a 16.3% fall in the last twelve months make it the weakest-performing postcode by a wide margin. Pandemic-era demand for premium coastal properties inflated BH13 prices to levels that could not be sustained once mortgage rates rose. This correction is specific to the ultra-premium segment and does not reflect broader market conditions across Poole's other seven postcodes.
Monthly Property Sales in Poole
BH15 (Town Centre, Hamworthy) records the highest sales volume at 42 transactions per month, with a turnover rate of 27%. Sales volume matters because it tells you how quickly you could resell or refinance. Low-volume postcodes mean thinner markets where pricing a sale takes longer.
| Area | Sales per Month | Turnover | Asking Price |
|---|---|---|---|
| BH15 (Town Centre, Hamworthy) | 42 | 27% | £325,043 |
| BH21 (Wimborne Minster) | 35 | 7% | £498,052 |
| BH12 (Upper Parkstone, Newtown) | 34 | 28% | £332,900 |
| BH14 (Lower Parkstone, Penn Hill) | 28 | 6% | £519,779 |
| BH17 (Canford Heath, Creekmoor) | 25 | 46% | £327,497 |
| BH16 (Upton, Turlin Moor) | 14 | 35% | £344,494 |
| BH18 (Broadstone) | 13 | 21% | £537,163 |
| BH13 (Canford Cliffs, Sandbanks) | 12 | 4% | £665,122 |
BH17 has the highest turnover rate at 46%, despite a mid-range sales volume of 25 per month. A high turnover rate indicates that a larger share of the total housing stock changes hands each year. For an investor, this means a more liquid market when it comes time to sell. BH13, at the other end, has just 12 sales per month and a 4% turnover rate. That is a market where individual sales can take months and pricing power sits with the buyer.
Property Data Sources
Our location guide relies on diverse, authoritative datasets including:
- HM Land Registry UK House Price Index
- Ministry of Housing, Communities and Local Government
- Ordnance Survey Data Hub
- Propertydata.co.uk
We update our property data quarterly to ensure accuracy. Last update: March 2026. All data is presented as provided by our sources without adjustments or amendments.

Poole Rental Market Analysis
For investors weighing up whether rental property is a worthwhile investment in Poole, the data below breaks down average monthly rents and gross rental yields across the town's postcodes.
Six of Poole's eight postcodes carry rental data, with monthly rents ranging from £1,228 (BH17) to £1,876 (BH13) and gross yields from 3.0% to 4.9%. BH16 and BH18 have insufficient rental transaction data for reliable figures. If you are looking to build a property portfolio in the South West, Poole's combination of coastal tenant demand and a spread of entry-level postcodes below £345,000 creates a different profile from neighbouring Bournemouth.
Average Rent & Gross Rental Yields in Poole
Gross rental yields in Poole range from 3.0% in BH14 (Lower Parkstone, Penn Hill) to 4.9% in BH12 (Upper Parkstone, Newtown). The three postcodes with the strongest yields are all in the sub-£345,000 price bracket. Higher rents in BH13 and BH21 do not translate to higher yields because the asking prices are proportionally greater.
| Area | Average Monthly Rent | Asking Price | Gross Yield |
|---|---|---|---|
| BH12 (Upper Parkstone, Newtown) | £1,365 | £332,900 | 4.9% |
| BH15 (Town Centre, Hamworthy) | £1,298 | £325,043 | 4.8% |
| BH17 (Canford Heath, Creekmoor) | £1,228 | £327,497 | 4.5% |
| BH21 (Wimborne Minster) | £1,573 | £498,052 | 3.8% |
| BH13 (Canford Cliffs, Sandbanks) | £1,876 | £665,122 | 3.4% |
| BH14 (Lower Parkstone, Penn Hill) | £1,317 | £519,779 | 3.0% |
| BH16 (Upton, Turlin Moor) | Not enough data | £344,494 | Not enough data |
| BH18 (Broadstone) | Not enough data | £537,163 | Not enough data |
BH12 at 4.9% delivers the highest gross yield and also posted the strongest five-year growth at 19.4%. That combination is uncommon. In most markets, the highest-yielding postcodes are the cheapest because capital growth is weak. In Poole, BH12 combines above-average growth with top-tier yield, supported by its proximity to the Parkstone area and strong tenant demand from young professionals priced out of Sandbanks and Canford Cliffs.
BH15 follows at 4.8% with the highest sales volume in the area (42 per month). The town centre location, harbour proximity, and access to the Holes Bay regeneration site all contribute to rental demand. BH17 at 4.5% completes the top three, with the highest turnover rate (46%) in Poole and the lowest monthly rent at £1,228.
Is Poole Rent High?
Rent as a percentage of income measures how much of a tenant's gross salary goes toward housing costs. Across the six postcodes with rental data, Poole rents consume between 39.3% and 60.1% of the local median gross monthly salary. Every postcode sits above the commonly cited 30% affordability threshold, which reflects the structural gap between Poole's coastal property values and local wage levels.
The median gross weekly salary in Poole is £721, which equates to £3,124 per month or £37,493 per year. This is below the South West regional median of £722 per week and the Great Britain median of £752.40 per week. Data from the Nomis Labour Market Profile (ASHE 2025).
| Rank | Area | Rent as % of Income |
|---|---|---|
| 1 | BH13 (Canford Cliffs, Sandbanks) | 60.1% |
| 2 | BH21 (Wimborne Minster) | 50.3% |
| 3 | BH12 (Upper Parkstone, Newtown) | 43.7% |
| 4 | BH14 (Lower Parkstone, Penn Hill) | 42.2% |
| 5 | BH15 (Town Centre, Hamworthy) | 41.6% |
| 6 | BH17 (Canford Heath, Creekmoor) | 39.3% |
| — | BH16 (Upton, Turlin Moor) | Not enough data |
| — | BH18 (Broadstone) | Not enough data |
BH13's 60.1% figure reflects the Sandbanks and Canford Cliffs tenant profile. Tenants in BH13 are typically higher earners or dual-income households where the local authority median salary is not the relevant benchmark. The ratio is the highest, but the tenant base in that postcode is fundamentally different from BH15 or BH17.
BH17 at 39.3% is the most affordable postcode for tenants relative to income. At £1,228 per month against a £3,124 gross monthly salary, it is also the postcode with the lowest absolute rent. Lower rent-to-income ratios generally correlate with more reliable tenant retention. The four postcodes between 39% and 44% all sit in the sub-£345,000 price bracket.
Thinking of Buying?
We have off-market investment properties averaging 8%+ annual yield.
View Property DealsBuy-to-Let Considerations
Are House Prices High in Poole? Price-to-Earnings Ratios
Purchasing a property in Poole requires between 8.7 and 17.7 times the median annual salary. This is based on the Nomis Labour Market Profile for Poole showing the median gross annual income for Poole residents is £37,493.
Every postcode sits above the national benchmark of 7.5x (England average price of £291,865 divided by Great Britain median salary of £39,125). Even BH15 and BH17 at 8.7x exceed the national figure. That reflects the structural premium of the Dorset coast, where property values outpace local earnings at every price tier.
| Rank | Area | Price-to-Earnings Ratio |
|---|---|---|
| 1 | BH15 (Town Centre, Hamworthy) | 8.7x |
| 2 | BH17 (Canford Heath, Creekmoor) | 8.7x |
| 3 | BH12 (Upper Parkstone, Newtown) | 8.9x |
| 4 | BH16 (Upton, Turlin Moor) | 9.2x |
| 5 | BH21 (Wimborne Minster) | 13.3x |
| 6 | BH14 (Lower Parkstone, Penn Hill) | 13.9x |
| 7 | BH18 (Broadstone) | 14.3x |
| 8 | BH13 (Canford Cliffs, Sandbanks) | 17.7x |
The table splits cleanly into two groups. BH15, BH17, BH12, and BH16 cluster between 8.7x and 9.2x. BH21, BH14, BH18, and BH13 range from 13.3x to 17.7x. That is the same two-tier structure visible in the asking price and deposit data.
The lower tier sits 16-23% above the national benchmark. The upper tier is 77-136% above it. This gap widened during the pandemic when premium coastal postcodes surged faster than the affordable core.
Deposit Requirements in Poole
A 30% deposit is the standard requirement for buy-to-let mortgages. In Poole, 30% deposits range from £97,513 in BH15 (Town Centre, Hamworthy) to £199,536 in BH13 (Canford Cliffs, Sandbanks). That is a £102,023 difference between the cheapest and most expensive entry points. Factoring in additional buy-to-let costs like stamp duty and legal fees increases the total capital required.
| Rank | Area | 30% Deposit Required |
|---|---|---|
| 1 | BH15 (Town Centre, Hamworthy) | £97,513 |
| 2 | BH17 (Canford Heath, Creekmoor) | £98,249 |
| 3 | BH12 (Upper Parkstone, Newtown) | £99,870 |
| 4 | BH16 (Upton, Turlin Moor) | £103,348 |
| 5 | BH21 (Wimborne Minster) | £149,416 |
| 6 | BH14 (Lower Parkstone, Penn Hill) | £155,934 |
| 7 | BH18 (Broadstone) | £161,149 |
| 8 | BH13 (Canford Cliffs, Sandbanks) | £199,536 |
The first three postcodes sit within £2,357 of each other: BH15 at £97,513, BH17 at £98,249, and BH12 at £99,870. All three are below £100,000. For an investor with that capital available, the choice between these three postcodes comes down to yield preference (BH12 at 4.9%), sales volume (BH15 at 42/month), or turnover liquidity (BH17 at 46%). Each postcode leads a different metric. Investors with less capital can explore buy-to-let with no deposit options, while those looking for renovation property for sale may find discounted stock in BH15's older harbour-side terraces.

What the Poole Data Tells Buy-to-Let Investors
BH12 (Upper Parkstone, Newtown) tops the yield table at 4.9%, leads five-year growth at 19.4%, and requires a 30% deposit of £99,870. It also ranks as the cheapest per square foot at £353. The combination of yield, growth, and relative affordability in a single postcode makes BH12 the strongest all-round data profile in Poole. Monthly rent of £1,365 is collected from a tenant base that includes young professionals and families priced out of the harbour-side postcodes. Investment property in this postcode benefits from 34 sales per month and 28% turnover.
BH15 (Town Centre, Hamworthy) at 4.8% yield has the highest liquidity in Poole with 42 sales per month. The Holes Bay regeneration immediately to the north is planned for 830 new homes, and the West Quay Marina scheme adds a further 300 units at the waterfront. BH17 (Canford Heath, Creekmoor) at 4.5% offers the lowest rent at £1,228 and the highest turnover at 46%, which may suit off-market property buyers looking for volume rather than premium rental income.
BH13 (Canford Cliffs, Sandbanks) has declined 22.8% over five years and 16.3% in the last twelve months. Sales volume is 12 per month with a 4% turnover rate. BH14 (Lower Parkstone, Penn Hill) carries a 3.0% yield. BH16 and BH18 have no published rental data. These four postcodes account for prices between £344,494 and £665,122 with yield data that is either low or absent.
The BCP local authority area falls under a single selective licensing scheme framework. Investors should check current licensing requirements with BCP Council before purchasing rental property in any Poole postcode.
How Poole Compares
Poole's mean asking price of £443,756 is the highest of the five locations compared here, at £40,168 above the next most expensive (Salisbury at £403,588). That premium reflects the Sandbanks and Canford Cliffs postcodes pulling the average upward. Poole's top yield of 4.9% sits below Bournemouth (7.7%), Bristol (8.2%), and Exeter (5.6%), but above Salisbury (4.3%).
| Location | Mean Asking Price | Mean Monthly Rent | Top Gross Yield |
|---|---|---|---|
| Bournemouth | £355,164 | £1,408 | 7.7% |
| Bristol | £372,904 | £1,777 | 8.2% |
| Exeter | £387,814 | £1,284 | 5.6% |
| Salisbury | £403,588 | £1,282 | 4.3% |
| Poole | £443,756 | £1,443 | 4.9% |
Neighbouring Bournemouth shares the same BCP unitary authority but produces a different investment profile. A mean asking price of £355,164 is £88,592 cheaper than Poole's, with a top yield of 7.7% that is well above Poole's 4.9%. Bournemouth's higher yields come from its larger stock of purpose-built flats and HMO conversions near the university campuses. Full postcode analysis in our Bournemouth buy-to-let guide.
Bristol at £372,904 has the highest rents in the group at £1,777 per month and the highest top yield at 8.2%. It is a larger market with deeper liquidity, more diverse tenant demand, and stronger employment drivers. See our Bristol investment guide for the full postcode breakdown.
Exeter at £387,814 and Salisbury at £403,588 sit between Bournemouth and Poole on price. Exeter's top yield of 5.6% outperforms Poole's, driven by student and professional demand around the university. Salisbury at 4.3% is the only location with a lower top yield than Poole. Full analysis in our Exeter and Salisbury buy-to-let guides. For a wider view, see our best buy-to-let locations ranking.
Frequently Asked Questions
What are the main areas of Poole for property investment?
Eight postcodes, two tiers. BH15 (Town Centre, Hamworthy), BH17 (Canford Heath, Creekmoor), BH12 (Upper Parkstone, Newtown), and BH16 (Upton, Turlin Moor) have asking prices between £325,043 and £344,494. BH21 (Wimborne Minster), BH14 (Lower Parkstone, Penn Hill), BH18 (Broadstone), and BH13 (Canford Cliffs, Sandbanks) range from £498,052 to £665,122. The lower tier carries yields between 4.5% and 4.9% where data is available. The upper tier ranges from 3.0% to 3.8%. BH16 and BH18 have no published rental data.
What houses are for sale in Poole and what do they cost?
Asking prices for houses for sale in Poole range from £325,043 in BH15 (Town Centre, Hamworthy) to £665,122 in BH13 (Canford Cliffs, Sandbanks). Four postcodes sit below £345,000: BH15, BH17, BH12, and BH16. The remaining four all exceed £498,000. Flats and maisonettes across the BCP area average £198,290, which is 9.6% below the England average of £219,340. Detached houses average £546,702. The range reflects Poole's split between harbour-side premium stock and the more affordable Parkstone and Canford Heath suburbs.
Is Poole a nice place to live?
Poole has a population of 400,200 (2021 Census) and sits on one of the largest natural harbours in the world. The town has direct access to the Jurassic Coast, Sandbanks beach, and Brownsea Island. Bournemouth University and Arts University Bournemouth sit in the wider conurbation.
The employment rate is 77.3% and the median annual salary is £37,493, marginally below the South West regional average. Rents consume between 39.3% and 60.1% of the local median gross monthly income depending on postcode.
How does Poole compare to Bournemouth for buy-to-let?
Bournemouth is £88,592 cheaper on average, with a mean asking price of £355,164 compared to Poole's £443,756. Bournemouth's top gross yield of 7.7% is higher than Poole's 4.9%. Mean monthly rents are similar: £1,408 in Bournemouth versus £1,443 in Poole. The two share the same BCP unitary authority and Land Registry data area. Bournemouth's yield advantage comes from a higher concentration of purpose-built flats and HMO properties near its university campuses.
What happened to Poole house prices during the 2008 crash?
Prices fell 19.8% in 17 months. The average property price in the BCP area peaked at £223,171 in November 2007 and hit a trough of £179,039 by April 2009. The worst annual change reading was -17.4% in March 2009, steeper than both the England decline of -15.5% and the South West's -16.6%. Prices did not return to their pre-crash peak until June 2014, when the average reached £224,321.
Are there flats to rent in Poole and what are the yields?
Six of Poole's eight postcodes have published rental data, with average monthly rents ranging from £1,228 in BH17 (Canford Heath, Creekmoor) to £1,876 in BH13 (Canford Cliffs, Sandbanks). Gross yields range from 3.0% (BH14) to 4.9% (BH12). Flats and maisonettes across the BCP area sell for an average of £198,290, which is 9.6% below the England average. BH16 (Upton, Turlin Moor) and BH18 (Broadstone) have insufficient rental data for reliable figures. Holiday let properties in Poole fall under different tax and regulation rules. Our guide to the best areas to buy a holiday let in the UK covers the wider context.