Where to Buy Property Investments in Truro: Yields of 4.4%
Truro is a city in the South West of England and Cornwall's only city. Gross rental yields reach 4.4% in TR1, with rental data available for 3 of the city's 4 postcodes. Cornwall's average sold price sits 5.0% below the England average, and the county's population grew 7.1% to 570,305 between the 2011 and 2021 censuses.
Truro's mean asking price of £442,300 makes it one of the most expensive entry points in the South West for buy-to-let investors. That is 56.7% above nearby Plymouth and 14.0% above Exeter. Asking prices range from £335,513 in TR1 to £509,412 in TR2, and all four postcodes are currently showing negative one-year price growth.
This guide covers all 4 Truro postcodes from TR1 to TR4 under the Cornwall unitary authority (ONS code E06000052). Truro is Cornwall's only city, the administrative centre of Cornwall Council and the county's commercial hub. Investors comparing options in the region may also consider Bournemouth or Bath. Browse all our South West location guides.
Article updated: March 2026
Truro Buy-to-Let Market Overview 2026
Truro is Cornwall's only city and the county's administrative centre, with premium pricing that reflects lifestyle demand rather than rental income fundamentals.
- Average sold price: £277,318 (5.0% below England's £291,865)
- Asking price range: £335,513 (TR1) to £509,412 (TR2)
- Rental yields: 3.1% (TR3) to 4.4% (TR1) across postcodes with rental data
- Rental income: Monthly rents from £1,134 (TR4) to £1,330 (TR3)
- Price per sq ft: Sold prices from £323/sq ft (TR1) to £371/sq ft (TR3)
- Market activity: Sales ranging from 8 per month (TR3) to 21 per month (TR1)
- Deposit requirements: 30% deposits range from £100,654 (TR1) to £152,824 (TR2)
- Affordability ratios: Property prices from 9.6 to 14.6 times Cornwall's median annual salary of £35,002
Contents

-
by Robert Jones, Founder of Property Investments UK
With two decades in UK property, Rob has been investing in buy-to-let since 2005, and uses property data to develop tools for property market analysis.

Property Data Sources
Our location guide relies on diverse, authoritative datasets including:
- HM Land Registry UK House Price Index
- Ministry of Housing, Communities and Local Government
- Ordnance Survey Data Hub
- Propertydata.co.uk
We update our property data quarterly to ensure accuracy. Last update: March 2026. All data is presented as provided by our sources without adjustments or amendments.
Why Invest in Truro?
Truro is Cornwall's only city and the service hub for a county of 570,305 people. Cornwall Council, the Royal Cornwall Hospital, and the county's main professional services firms are based here. For a city of its size, Truro punches above its weight as the administrative, retail, and commercial centre for England's most south-westerly county.
The Royal Cornwall Hospital at Treliske is the county's main acute hospital and one of Truro's largest employers. Healthcare workers create reliable year-round rental demand in the TR1 and TR4 postcodes closest to the site. Falmouth University's Penryn campus (TR10) is roughly 10 miles south and brings students into the wider area, while the planned Pydar Street campus in Truro city centre (TR1) will bring student and staff demand directly into the city.
Between the 2011 and 2021 censuses, Cornwall's population grew from 532,273 to 570,305, a rise of 7.1%. That growth reflects both natural increase and significant inward migration, particularly from retirees and remote workers relocating from London and the South East during and after the pandemic. Cornwall's coastal lifestyle premium drives demand but also inflates prices relative to local wages.
Earnings in Cornwall sit below both the regional and national averages. The median annual salary is £35,002, compared to £37,544 across the South West and £39,125 for Great Britain. That gap between property prices and local wages defines the Truro market. Asking prices averaging £442,300 are being set by buyers with wealth from outside Cornwall, not by what local workers can afford.
Cornwall's economy has historically relied on tourism, agriculture, and public services. The growth of Falmouth University, the expansion of the Spaceport Cornwall initiative at Newquay, and the county's emerging tech sector are gradually diversifying the employment base. For landlords, the hospital and council remain the most dependable sources of tenant demand.
Truro Economic Summary
- Population: 570,305 (2021 Census, Cornwall). Growth of 7.1% from 2011.
- Median annual salary: £35,002 (Cornwall), £37,544 (South West), £39,125 (Great Britain)
- Employment rate: 77.7% (Cornwall), 79.3% (South West), 75.6% (Great Britain)
- Unemployment rate: 3.8% (Cornwall), 3.3% (South West), 4.3% (Great Britain)
- Key employment sectors: Healthcare, public administration, tourism, higher education, agriculture
Source: ONS Census 2021, Nomis Labour Market Profile (ASHE 2025, Employment Oct 2024-Sep 2025)
Cornwall's employment rate of 77.7% sits below the South West's 79.3% but above the Great Britain average of 75.6%. The unemployment rate of 3.8% is higher than the region's 3.3% but still below the national 4.3%. Seasonal employment in tourism creates fluctuations that these annual figures smooth over. For buy-to-let investors, the hospital and council payrolls provide the steady, non-seasonal tenant base that matters most.
Regeneration and Investment in Truro
Over £180m of confirmed investment is targeting Truro's city centre and waterfront. The projects below address housing supply and aim to diversify the local economy beyond tourism.
- Pydar Street Regeneration (underway, £170m): Cornwall Council's largest regeneration project will transform a city-centre site into 320 homes, 450 student beds for Falmouth University, retail space, and a health and wellbeing hub. The student accommodation alone will create a new rental market in Truro that currently does not exist at scale. Updates at Cornwall Council.
- Truro Waterside (underway, £11.7m from £23.6m Town Deal): A harbour and quay improvement programme funded through the Government's Towns Fund, with work beginning in January 2026. The project includes public realm improvements and commercial space designed to strengthen the city centre as a destination. Updates at Truro City Council.
- Treyew Road Housing (planning approved, 116 homes): Treveth, Cornwall Council's housing development company, secured planning consent for 116 homes on the former council offices site. The scheme includes affordable housing, adding to the city's limited supply. Updates at Treveth.

Truro Property Market Analysis
When Was the Last House Price Crash in Truro?
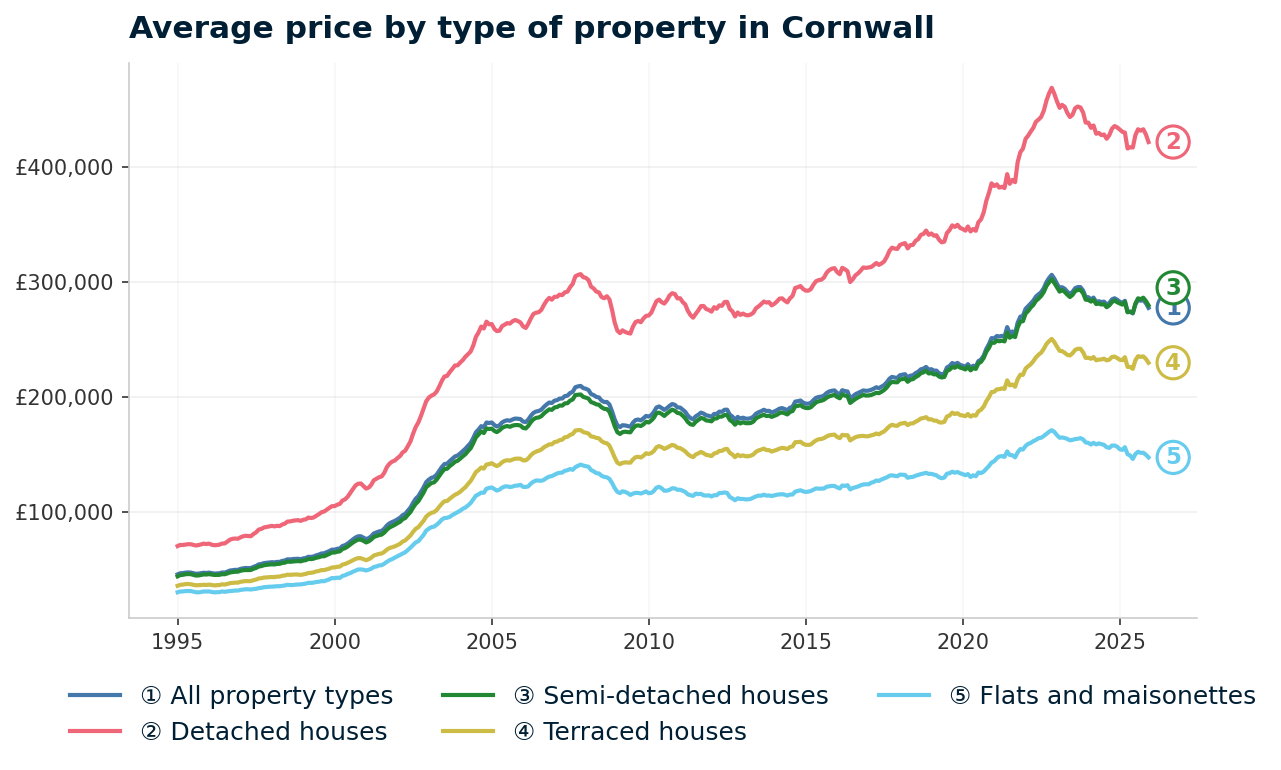
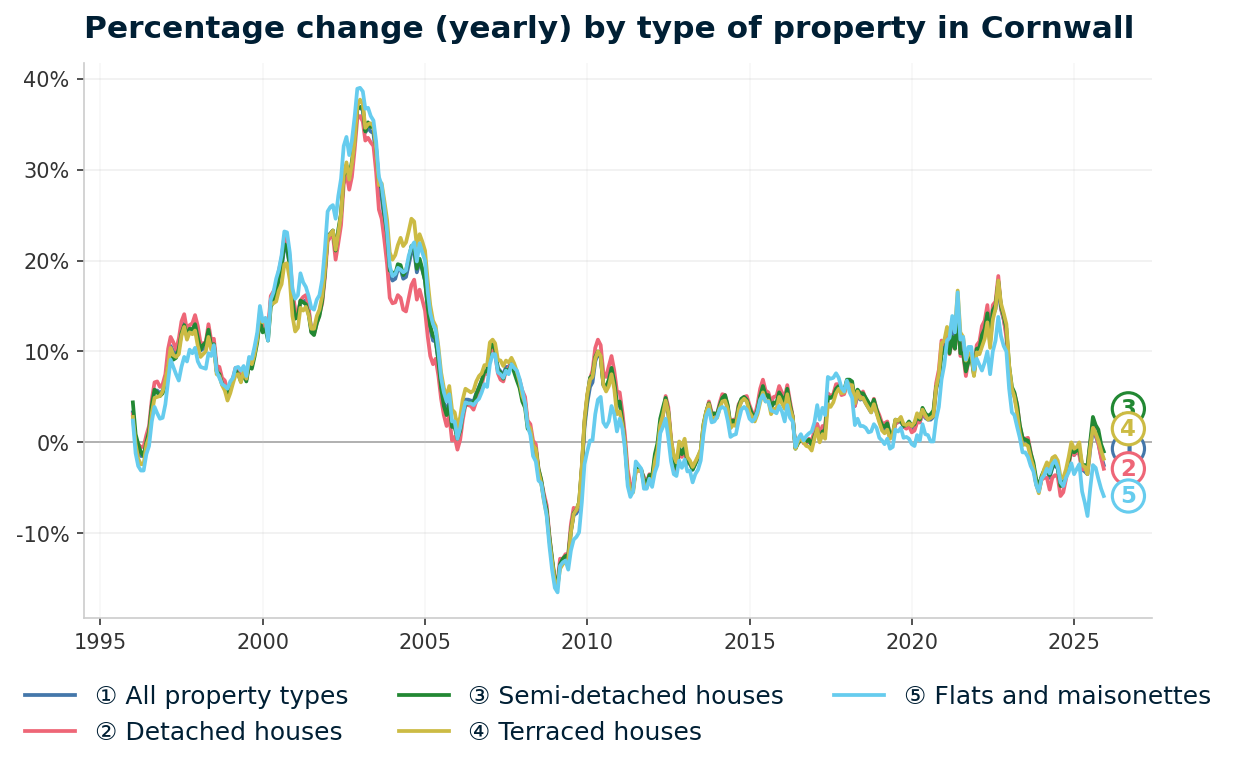
Cornwall property prices have risen 507.1% since January 1995, from £45,680 to £277,318, but the current annual change of -2.5% shows a market still correcting from its pandemic peak. Truro sits within the Cornwall unitary authority, so all sold property prices from the HM Land Registry House Price Index are reported at the Cornwall level. The data runs from January 1995 to December 2025.
- 1995-2000 (Lifestyle discovery): Cornwall began 1995 at £45,680. By January 2000, prices had risen to £67,129, with annual growth hitting 12.8%. Steady appreciation driven by lifestyle buyers beginning to discover Cornwall's coast, though prices remained well below national levels.
- 2000-2007 (The boom): Cornwall caught the full force of the UK housing boom. Prices more than tripled from £67,129 in January 2000 to a peak of £209,501 in November 2007. Growth exceeded 36% annually in early 2003. Cheap credit and the second-home market pushed prices far beyond what local wages could support.
- 2007-2009 (The financial crisis): From the peak of £209,501 in November 2007 to the trough of £173,660 in February 2009, Cornwall lost 17.1% of its value in 15 months. The worst annual change reading was -15.7% in February 2009. Flats were hit hardest at -16.5%, followed by terraced houses at -15.8%, semi-detached at -15.5%, and detached at -15.3%. Cornwall's decline of 17.1% was less severe than both the South West region (-19.4%) and England overall (-18.2%).
- 2009-2013 (Slow recovery): Cornwall bounced off the trough quickly. By December 2010, prices had recovered to £190,822. But then growth stalled. Annual changes turned negative in mid-2011, and prices oscillated between £180,000 and £191,000 for three years. By December 2013, the average was £186,367. Still 11.0% below the pre-crash peak.
- 2014-2017 (Recovery): Growth returned at a modest pace. Annual changes of 3-5% gradually closed the gap. Prices finally passed the pre-crash peak in July 2017 at £210,216. That recovery took nearly 10 years from the November 2007 peak. Cornwall was slower to recover than London and the South East, where prices passed pre-crash levels by 2013-2014.
- 2017-2019 (Steady growth): Prices rose from £210,216 in July 2017 to £227,758 by December 2019. Consistent growth of 2-4% per year. Cornwall's market ticked upward without the volatility of the boom years, supported by continued lifestyle demand.
- 2020-2022 (Pandemic surge): The stamp duty holiday and the remote working shift transformed Cornwall's market. Prices jumped from £228,403 in March 2020 to £302,791 by December 2022. That is 32.6% growth in under three years. Cornwall was one of the biggest beneficiaries of the pandemic relocation trend, as remote workers and lifestyle buyers flooded in from London and the South East.
- 2023-2025 (Correction): Interest rate rises and the end of the stamp duty holiday hit Cornwall harder than most. Prices fell from £302,791 in December 2022 to £286,752 by December 2023, a decline of 5.3%. The correction has continued into 2025, with prices reaching £277,318 by December 2025. Annual change stands at -2.5%. Cornwall has given back much of the pandemic gains and is still declining.
Long-Term Property Value Growth in Cornwall
- 5 years (2020-2025): +10.5% (£251,061 to £277,318)
- 10 years (2015-2025): +34.9% (£205,613 to £277,318)
- 15 years (2010-2025): +45.3% (£190,822 to £277,318)
- 20 years (2005-2025): +53.5% (£180,646 to £277,318)
- 30 years (1995-2025): +507.1% (£45,680 to £277,318)
The 2008 crash is the reference point for Cornwall investors assessing downside risk. A 17.1% decline took nearly 10 years to recover. Cornwall fared slightly better than the South West and England during the crash itself, but the recovery was longer.
The current correction is different in character. Prices are deflating after a 32.6% pandemic surge that pushed values well beyond local fundamentals. Whether that correction continues depends on mortgage rates and the balance between lifestyle demand and local affordability.
Source: HM Land Registry House Price Index for Cornwall, January 1995 to December 2025.
Thinking of Buying?
We have off-market investment properties averaging 8%+ annual yield.
View Property DealsSold House Prices in Truro
The latest sold house price index from the Land Registry covers Cornwall as a whole. The headline figure of £277,318 is 5.0% below England's £291,865 and 7.9% below the South West's £301,226. That sounds like a modest discount, but it masks a wide spread across property types.
Flats in Cornwall average £147,342, a 32.8% discount to England's £219,340. That is the widest gap in Cornwall's market and reflects a stock profile dominated by smaller coastal conversions and ex-local authority flats rather than the new-build apartment blocks that inflate flat prices in cities like Bristol or Exeter.
| Property Type | Cornwall Average | England Average | Difference |
|---|---|---|---|
| Detached houses | £421,509 | £471,667 | -10.6% |
| Semi-detached houses | £279,544 | £289,135 | -3.3% |
| Terraced houses | £229,622 | £244,830 | -6.2% |
| Flats and maisonettes | £147,342 | £219,340 | -32.8% |
| All property types | £277,318 | £291,865 | -5.0% |
Semi-detached houses show the narrowest discount at just 3.3%. Cornwall's semis at £279,544 sit close to England's £289,135, reflecting strong demand from families and owner-occupiers in the county's residential towns. In Truro, semi-detached stock in TR1 and TR4 forms the core of the family rental market.
Detached houses sit 10.6% below England at £421,509. That gap is narrower than you might expect for a rural county. Cornwall's detached stock includes a significant proportion of period properties and coastal homes that command lifestyle premiums, pulling the average closer to the national figure.
Terraced houses average £229,622, a 6.2% discount. Truro's terraced stock is concentrated in the city centre and older residential areas of TR1. These are the properties most likely to serve the traditional buy-to-let market. Older terraced houses that need updating are where many investors start. For strategies on sourcing them, see our guide to finding renovation properties.
Flats at £147,342 represent the largest discount at 32.8%. Cornwall does not have the dense urban flat market that cities offer. Flat stock is thinner, older, and concentrated in coastal towns. For investors, the flat discount creates entry points below £150,000 in a county where the average across all types approaches £280,000.
Property Data Sources
Our location guide relies on diverse, authoritative datasets including:
- HM Land Registry UK House Price Index
- Ministry of Housing, Communities and Local Government
- Ordnance Survey Data Hub
- Propertydata.co.uk
We update our property data quarterly to ensure accuracy. Last update: March 2026. All data is presented as provided by our sources without adjustments or amendments.
Price Per Square Foot in Truro
Truro's price per square foot ranges from £323 in TR1 to £371 in TR3, a spread of just £48 across four postcodes. That is remarkably narrow. Most cities have a 2x or 3x gap between cheapest and most expensive. In Truro, you are paying roughly the same rate for space everywhere. The asking price differences between postcodes are driven by property size, not by underlying land value.
| Rank | Area | Price Per Sq Ft |
|---|---|---|
| 1 | TR1 (Truro City Centre) | £323 |
| 2 | TR4 (Redruth, Camborne) | £343 |
| 3 | TR2 (Roseland Peninsula) | £356 |
| 4 | TR3 (Falmouth, Penryn) | £371 |
TR1 at £323 per square foot is the cheapest space in the Truro area. This is the city centre postcode where smaller terraced houses and older stock keep per-foot costs lower. TR1 also delivers the highest yield at 4.4%, making it the postcode where price per square foot and rental returns align most favourably.
TR3 at £371 is the most expensive per square foot. The Falmouth and Penryn area commands higher rates due to university demand and coastal proximity. TR2 (Roseland Peninsula) at £356 includes some of Cornwall's most sought-after rural and coastal villages, where lifestyle premiums push per-foot values above the city centre despite much lower transaction volumes.
Figures reflect averages across all property types and ages. Individual values depend on condition, location within the postcode, and building age.
For Sale Asking Prices in Truro
Truro's asking prices range from £335,513 in TR1 to £509,412 in TR2, a spread of £174,000 across just four postcodes. With all four postcodes showing negative one-year growth, asking prices may sit above what eventually transacts. TR2 and TR3 both exceed £500,000, placing them firmly in premium territory where owner-occupiers and second-home buyers set the pace.
| Rank | Area | Average Asking Price |
|---|---|---|
| 1 | TR1 (Truro City Centre) | £335,513 |
| 2 | TR4 (Redruth, Camborne) | £417,418 |
| 3 | TR3 (Falmouth, Penryn) | £506,856 |
| 4 | TR2 (Roseland Peninsula) | £509,412 |
TR1 is the only postcode below £350,000. The city centre's smaller, older housing stock keeps it more accessible than the surrounding areas. At £335,513, TR1 requires a 30% deposit of £100,654. That is still a six-figure entry point, which puts Truro in a different league from Plymouth (deposits from £59,837) or most northern cities.
TR2 and TR3 both sit above £500,000 and serve different markets. TR2 covers the Roseland Peninsula, where properties are large, rural, and traded infrequently (9 sales per month with no rental data). TR3 includes Falmouth and Penryn, where the university creates some rental demand but asking prices of £506,856 compress yields to 3.1%. TR4 at £417,418 covers the Redruth and Camborne area, the most industrial part of the Truro postcodes.
The mean asking price across all four Truro postcodes is £442,300. That figure appears in the comparison section, where Truro is measured against Plymouth, Exeter, Bournemouth, and Bath.

House Price Growth in Truro
Growth data shows where prices have moved over 1, 3, and 5 years. All four Truro postcodes show negative one-year growth, and all four show negative three-year growth. Three of four retain positive five-year growth, with only TR2 in negative territory at -4.0%. This is a market in correction after the pandemic surge, not a market in distress.
| Area | 1 Year | 3 Years | 5 Years |
|---|---|---|---|
| TR3 (Falmouth, Penryn) | -2.7% | -11.0% | 15.6% |
| TR4 (Redruth, Camborne) | -0.6% | -8.2% | 11.1% |
| TR1 (Truro City Centre) | -4.4% | -2.5% | 7.6% |
| TR2 (Roseland Peninsula) | -9.9% | -4.9% | -4.0% |
TR3 leads on five-year growth at 15.6%, driven by the Falmouth university expansion. That growth is concentrated in the early part of the five-year window. The three-year figure of -11.0% shows that prices have been falling since the pandemic peak. An investor who bought in TR3 five years ago has made gains. An investor who bought three years ago has lost ground.
TR2 is the only postcode with negative five-year growth at -4.0%. The Roseland Peninsula is a low-volume, high-value market (9 sales per month) where price swings are amplified by small sample sizes. A handful of high-value sales or their absence can move the average significantly. The -9.9% one-year decline is the steepest in the Truro area.
TR4 at -0.6% has the shallowest one-year decline. The Redruth and Camborne area, historically Cornwall's most affordable corridor, is showing more price resilience than the premium postcodes. The 11.1% five-year growth and -0.6% one-year figure suggest this postcode has largely absorbed the post-pandemic correction already. In a falling market, repossessed houses occasionally appear below the averages shown here.
Monthly Property Sales in Truro
How easy is it to sell? Truro manages just 50 property transactions per month across all four postcodes. Plymouth, an hour's drive east, has 281. That tells you everything about market depth in Cornwall's only city.
| Area | Sales Per Month | Turnover | Asking Price |
|---|---|---|---|
| TR1 (Truro City Centre) | 21 | 8% | £335,513 |
| TR4 (Redruth, Camborne) | 12 | 10% | £417,418 |
| TR2 (Roseland Peninsula) | 9 | 41% | £509,412 |
| TR3 (Falmouth, Penryn) | 8 | 8% | £506,856 |
TR1 at 21 sales per month is the most active postcode, but turnover of just 8% tells a different story. Low turnover means a large stock of properties that rarely come to market. That is typical of a city centre where landlords and owner-occupiers hold long-term. For investors buying in TR1, liquidity on exit is adequate but not fast.
TR2's turnover of 41% stands out against its modest 9 sales per month. That high turnover reflects a small total stock base on the Roseland Peninsula. Properties that do come to market sell relatively quickly, but the absolute volume is thin. With no rental data for TR2, this is predominantly an owner-occupier and second-home market.
TR3 at 8 sales per month is the quietest postcode. Combined with £506,856 asking prices and 3.1% yields, the Falmouth and Penryn area offers limited liquidity for buy-to-let investors. Selling in a thin market at premium prices may require patience.
Property Data Sources
Our location guide relies on diverse, authoritative datasets including:
- HM Land Registry UK House Price Index
- Ministry of Housing, Communities and Local Government
- Ordnance Survey Data Hub
- Propertydata.co.uk
We update our property data quarterly to ensure accuracy. Last update: March 2026. All data is presented as provided by our sources without adjustments or amendments.

Truro Rental Market Analysis
For investors weighing up whether rental property is a worthwhile investment in Truro, the data below breaks down average monthly rents and gross rental yields across the city's postcodes.
Rental data is available for 3 of 4 postcodes. TR2 (Roseland Peninsula) has insufficient current listings for reliable figures. For the three with data, monthly rents range from £1,134 in TR4 to £1,330 in TR3 and gross yields range from 3.1% to 4.4%. If you are looking to build a property portfolio in the South West, Truro's yields are below average for the region, reflecting high asking prices relative to rents.
Average Rent & Gross Rental Yields in Truro
Most cities in our guides have at least one postcode above 5%. Truro's highest gross yield is 4.4% in TR1, where monthly rents of £1,239 meet asking prices of £335,513. At 3.1%, TR3 has the lowest yield of the three postcodes with data. The yield spread is just 1.3 percentage points, and the absolute levels reflect Cornwall's high asking prices absorbing the rental income.
| Area | Average Monthly Rent | Average Asking Price | Gross Yield |
|---|---|---|---|
| TR1 (Truro City Centre) | £1,239 | £335,513 | 4.4% |
| TR4 (Redruth, Camborne) | £1,134 | £417,418 | 3.3% |
| TR3 (Falmouth, Penryn) | £1,330 | £506,856 | 3.1% |
| TR2 (Roseland Peninsula) | Not enough data | £509,412 | Not enough data |
TR1 at 4.4% is the only postcode approaching a conventional buy-to-let yield. It combines the lowest asking price in the area with rents of £1,239 per month. The city centre benefits from hospital workers, council employees, and the closest proximity to the Pydar Street development. For investors who need a property to cover its costs, TR1 is where the numbers are most likely to work.
TR3 commands the highest absolute rent at £1,330 per month but delivers the lowest yield at 3.1%. Asking prices of £506,856 absorb the rental income. The Falmouth university market creates demand, but at these prices, the investment case depends on capital growth rather than cash flow. The -11.0% three-year growth figure does not support that case at present.
TR4 sits between them at 3.3% yield with rents of £1,134. The Redruth and Camborne corridor is the most working-class area in the Truro postcodes. Rents are lower than TR1 and TR3, but asking prices of £417,418 prevent the yield from reaching levels seen in more affordable South West locations.
Is Truro Rent High?
The median gross weekly salary in Cornwall is £673.10, which equates to £2,917 per month or £35,002 per year. This is below the South West regional median of £722.00 per week and the Great Britain median of £752.40 per week. Data from the Nomis Labour Market Profile (ASHE 2025).
Every Truro postcode with rental data exceeds the 30% affordability benchmark, ranging from 38.9% in TR4 to 45.6% in TR3. That does not mean tenants cannot pay. It means Truro's rental market depends on tenants earning above the local median. Hospital staff, council workers, and university employees fit that profile. Seasonal workers and retail staff do not.
| Rank | Area | Rent as % of Income |
|---|---|---|
| 1 | TR3 (Falmouth, Penryn) | 45.6% |
| 2 | TR1 (Truro City Centre) | 42.5% |
| 3 | TR4 (Redruth, Camborne) | 38.9% |
| — | TR2 (Roseland Peninsula) | Not enough data |
TR3 at 45.6% is the most stretched. Rents of £1,330 against a monthly median income of £2,917 leave tenants with limited headroom. The Falmouth student market operates differently from standard lets. Students fund rent through loans and parental support rather than local wages, so the affordability ratio is less meaningful for that segment. Standard lets in TR3 face genuine affordability pressure.
TR4 at 38.9% is the least stretched of the three, but still well above the 30% benchmark. Cornwall's low wages create structural affordability pressure across all postcodes. TR1 at 42.5% sits in the middle. The hospital and council workforce provides a tenant base that earns above the county median, which partially offsets the headline affordability figure.
Thinking of Buying?
We have off-market investment properties averaging 8%+ annual yield.
View Property DealsTruro Buy-to-Let Considerations
Are Truro House Prices High? Price-to-Earnings Ratios
Purchasing a property in Truro requires between 9.6 and 14.6 times the median annual salary of £35,002. The national benchmark is 7.5x (England's average sold price of £291,865 against Great Britain's median salary of £39,125). Not a single Truro postcode comes close. Data from the Nomis Labour Market Profile for Cornwall.
TR1 at 9.6x is the most accessible, but that is still 28% above the national benchmark. This is the defining characteristic of the Truro market. Property prices are set by wealth from outside Cornwall, not by what local workers earn.
| Rank | Area | Price-to-Earnings Ratio |
|---|---|---|
| 1 | TR1 (Truro City Centre) | 9.6x |
| 2 | TR4 (Redruth, Camborne) | 11.9x |
| 3 | TR3 (Falmouth, Penryn) | 14.5x |
| 4 | TR2 (Roseland Peninsula) | 14.6x |
TR2 and TR3 at 14.5x and 14.6x are nearly double the national benchmark. These are lifestyle-driven markets where local earnings have almost no bearing on property values. The Roseland Peninsula and Falmouth coast attract buyers relocating from higher-value regions who are not dependent on Cornwall wages. For buy-to-let investors, high P/E ratios signal that rental yields will be compressed because rents are anchored to what local tenants can pay while prices are set by a different buyer pool entirely.
TR1 at 9.6x is the most accessible in relative terms. It is still expensive by national standards, but the city centre's working population provides a tenant base that can sustain rents closer to the asking price level. TR4 at 11.9x covers the Redruth and Camborne area, where industrial heritage keeps prices lower than the coastal postcodes but the ratio still exceeds the benchmark by 59%.
Deposit Requirements in Truro
Every Truro postcode requires a six-figure deposit at 30%, ranging from £100,654 in TR1 to £152,824 in TR2. The table below uses 30% rather than the typical minimum 25% because the better interest rates available at 70% LTV matter more in a low-yield market. In Plymouth, deposits start at £59,837. In Truro, the cheapest postcode needs £100,654.
| Rank | Area | 30% Deposit Required |
|---|---|---|
| 1 | TR1 (Truro City Centre) | £100,654 |
| 2 | TR4 (Redruth, Camborne) | £125,225 |
| 3 | TR3 (Falmouth, Penryn) | £152,057 |
| 4 | TR2 (Roseland Peninsula) | £152,824 |
The gap between TR1 and the rest is significant. TR1's deposit of £100,654 is £24,571 less than TR4 and over £50,000 less than TR2 and TR3. For investors determined to enter the Cornwall market, TR1 represents the lowest capital requirement. It also delivers the highest yield (4.4%) and the most liquid market (21 sales per month). The alignment of those three factors in a single postcode is the clearest pattern in this data.
TR2 and TR3 both require deposits above £150,000. At that level, the same capital could secure two properties in cities like Plymouth, Sunderland, or Stoke. Whether the Cornwall lifestyle premium justifies the higher entry cost depends on the investor's strategy. Rental yields of 3.1% to 3.3% in those postcodes mean cash flow will be negative after mortgage costs at current interest rates.
Deposit is only part of the upfront cost. Budget for stamp duty (use our stamp duty calculator for an accurate figure), legal fees, and survey costs. For a full breakdown, see our guide to buy-to-let costs. If six-figure deposits are out of reach, our guide to investing in property with no deposit covers alternative strategies.
What the Truro Data Tells Buy-to-Let Investors
For yield, TR1 at 4.4% is the only postcode where the numbers approach viability for a standard buy-to-let. It has the lowest asking price (£335,513), the lowest deposit (£100,654), and the most active market (21 sales per month). TR4 at 3.3% and TR3 at 3.1% are below the level where a mortgaged investment property covers its costs at current interest rates.
Growth across Truro is negative in the short term. All four postcodes show negative one-year change, and all four show negative three-year change. The five-year figures remain positive for TR1, TR3, and TR4 because the pandemic surge was large enough to offset the subsequent correction. TR2 at -4.0% over five years is the exception. Investors looking for buy-to-let property with strong growth momentum will not find it in the current Truro data.
TR2 has no rental data, 9 sales per month, and negative five-year growth. The Roseland Peninsula is a second-home and lifestyle market, not a rental market. TR3 has rental data but yields of 3.1%, negative three-year growth of -11.0%, and just 8 sales per month. Both postcodes have data profiles that reflect owner-occupier and lifestyle demand rather than investment fundamentals.
Cornwall does not operate a selective licensing scheme, but the county has specific restrictions on second homes and holiday lets. A council tax premium of up to 100% on second homes was introduced in April 2025. Investors considering holiday lets should factor in the evolving regulatory landscape.
How Truro Buy-to-Let Compares to Nearby Areas
Truro's top yield of 4.4% is the lowest of five South West locations compared here. Bournemouth leads at 7.7%, with Plymouth and Exeter both at 5.6%. The table below compares mean asking prices, mean monthly rents, and top single-postcode gross yield.
| Location | Mean Asking Price | Mean Monthly Rent | Top Gross Yield |
|---|---|---|---|
| Truro | £442,300 | £1,234 | 4.4% |
| Plymouth | £282,189 | £1,002 | 5.6% |
| Exeter | £387,814 | £1,284 | 5.6% |
| Bournemouth | £355,164 | £1,408 | 7.7% |
| Bath | £450,726 | £1,782 | 5.8% |
Truro is the second most expensive entry point in this group but has the lowest top yield by a wide margin. At 4.4%, Truro's top yield is 1.2 percentage points below Plymouth and Exeter (both 5.6%), and 3.3 percentage points below Bournemouth (7.7%). Only Bath has a higher mean asking price (£450,726), but Bath's top yield of 5.8% is significantly stronger.
Plymouth offers the most favourable numbers for yield-focused investors. Mean asking prices of £282,189 are £160,000 below Truro, with a higher top yield and lower deposits. Exeter sits between the two: more expensive than Plymouth but with yields that significantly outperform Truro. Bournemouth delivers the highest top yield in the group at 7.7% with a mean asking price £87,000 below Truro.
Truro's position in this table reflects the Cornwall lifestyle premium. Investors are paying for location and quality of life, not for rental income. For those comparing the best buy-to-let areas in the South West purely on yield and affordability, the data favours the other four locations in this group. Truro's case rests on long-term capital preservation and lifestyle appeal rather than cash flow or off-market deals at volume.
Frequently Asked Questions
How does Truro compare to Plymouth for buy-to-let?
Plymouth has lower entry costs, higher yields, and a deeper market. Truro's mean asking price of £442,300 is 56.7% above Plymouth's £282,189, and Plymouth's top yield of 5.6% (PL2) exceeds Truro's 4.4% (TR1). Plymouth has 281 monthly sales across 9 postcodes; Truro has 50 across 4. Deposits in Plymouth start at £59,837 compared to Truro's £100,654.
The two markets serve different investor profiles. Plymouth has the numbers for conventional buy-to-let. Truro has Cornwall's lifestyle premium with lower rental returns.
Is Truro a good place to live?
Truro is Cornwall's administrative and commercial centre, with a cathedral, independent retail scene, and both Cornish coasts within 20-30 minutes. The Royal Cornwall Hospital and county council headquarters provide stable public sector employment. Cornwall's population grew 7.1% between censuses to 570,305.
The trade-off is cost. The median annual salary of £35,002 is below the South West average of £37,544 and the national £39,125. The lowest price-to-earnings ratio across Truro's postcodes is 9.6x (TR1), well above the national 7.5x benchmark.
What impact will the Pydar Street development have on Truro?
The £170m Pydar Street scheme includes 320 homes, 450 student beds for Falmouth University, and commercial space. The student accommodation is the most significant element for the rental market. Truro currently has no large-scale student housing, so this development creates a rental segment that does not yet exist in the city. Construction is underway, with demolition completed and building works progressing. The timeline for completion and full occupancy will determine when and whether the impact appears in rental demand data for TR1. The project is led by Cornwall Council as part of the Truro Town Deal.
Can I use a property in Truro as a holiday let?
Cornwall's proximity to beaches and coastal villages makes holiday lets a consideration. Cornwall Council introduced a council tax premium of up to 100% on second homes from April 2025, and the Government's short-term lets registration scheme is expected to add regulatory requirements. Holiday lets in Cornwall have historically generated higher per-night income than standard lets, particularly during summer months, but with higher void rates in winter and increased running costs. The postcode-level data in this guide covers standard residential lets only.
What flats are available to rent or buy in Truro?
Cornwall's flat stock is thinner than in most cities. Flats and maisonettes in Cornwall average £147,342, a 32.8% discount to England's £219,340. In Truro, flat stock is concentrated in TR1 (city centre conversions and smaller blocks) and to a lesser extent TR4. Flats to rent in Truro appear most frequently in TR1, where proximity to the hospital and council offices supports demand from single professionals and couples. TR3 (Falmouth, Penryn) has some student-oriented flat stock near the university campus. Purpose-built rental flats are scarce compared to cities like Plymouth or Exeter. The Pydar Street development will add 320 homes and 450 student beds, which may expand the flat rental market in TR1 when complete.
Are there property investment companies operating in Cornwall?
Several firms market investment properties in Cornwall, particularly new-build and holiday let developments. Cornwall's lifestyle appeal makes it a target for companies selling off-plan stock at premium prices. The data in this guide covers the open market. Any property sold through an investment company can be benchmarked against these figures.
Asking prices, yields, and growth rates vary significantly across Truro's four postcodes. Individual properties need individual due diligence. For investors looking for below market value properties, the current price correction across all four postcodes may create opportunities as sellers adjust expectations.