Where to Buy Property Investments in Crawley: Yields of 4.8%
Crawley is a town in West Sussex in the South East of England. Gross rental yields range from 3.3% to 4.8% across its three postcodes, with RH11 delivering the highest returns. Average sold prices sit 15.2% above the England average but 11.2% below the South East regional average, and the town's population grew 11.2% to 118,493 between the 2011 and 2021 censuses.
Crawley's average sold price of £336,354 places it in an unusual position for buy-to-let investors. It is more expensive than the England average but substantially cheaper than the wider South East, where the regional average sits at £378,800. That 11.2% discount within the region creates relative value for investors priced out of Guildford, Brighton, or the Surrey commuter belt. Asking prices range from £346,533 in RH11 to £481,499 in RH6, and all three postcodes have rental data.
This guide covers all 3 Crawley postcodes (RH6, RH10, RH11) under the Crawley borough council (ONS code E07000226). Crawley sits in West Sussex, built around Gatwick Airport and the Manor Royal Business District. Investors comparing options in the region may also consider Brighton, Reading, or Maidstone. Browse all our South East location guides.
Article updated: March 2026
Crawley Buy-to-Let Market Overview 2026
Crawley offers South East commuter belt access at a discount to the regional average, anchored by Gatwick Airport and one of the largest business parks in the South East.
- Average sold price: £336,354 (15.2% above England's £291,865)
- Asking price range: £346,533 (RH11) to £481,499 (RH6)
- Rental yields: 3.3% (RH6) to 4.8% (RH11) across all 3 postcodes
- Rental income: Monthly rents from £1,324 (RH6) to £1,391 (RH10, RH11)
- Price per sq ft: Sold prices from £396/sq ft (RH11) to £452/sq ft (RH6)
- Market activity: Sales ranging from 33 per month (RH6) to 59 per month (RH10)
- Deposit requirements: 30% deposits range from £103,960 (RH11) to £144,450 (RH6)
- Affordability ratios: Property prices from 8.8 to 12.3 times Crawley's median annual salary of £39,237
Contents

-
by Robert Jones, Founder of Property Investments UK
With two decades in UK property, Rob has been investing in buy-to-let since 2005, and uses property data to develop tools for property market analysis.

Property Data Sources
Our location guide relies on diverse, authoritative datasets including:
- HM Land Registry UK House Price Index
- Ministry of Housing, Communities and Local Government
- Ordnance Survey Data Hub
- Propertydata.co.uk
We update our property data quarterly to ensure accuracy. Last update: March 2026. All data is presented as provided by our sources without adjustments or amendments.
Why Invest in Crawley?
Gatwick Airport directly employs around 24,000 people and Manor Royal Business District adds another 30,000+ jobs, making Crawley one of the most employment-dense towns in the South East. Crawley was designated a New Town in 1947 and grew around the airport, which today handles over 32 million passengers per year. Add the supply chain, ground transport, hotels, and logistics, and Gatwick-linked employment dominates the local economy. That creates reliable, year-round rental demand from airport workers, airline crew, and ground staff. It also means Crawley's fortunes are tied to aviation in a way that few other UK towns experience.
The second pillar is Manor Royal Business District, one of the largest single-site business parks in the South East. Over 500 businesses operate across 240 acres, employing more than 30,000 people. Major occupiers include Virgin Atlantic's head office, Thales, and Varian Medical Systems. Manor Royal generates a tenant pool of mid-career professionals who need housing close to work but are priced out of the surrounding Surrey and Sussex countryside.
Between the 2011 and 2021 censuses, Crawley's population grew from 106,597 to 118,493, a rise of 11.2%. That is strong growth for a town of Crawley's size and reflects both employment-driven migration and new housing development on the town's edges.
Earnings in Crawley sit above the Great Britain median but below the South East regional average. The median annual salary is £39,237, compared to £800.30 per week (£41,616 per year) across the South East and £752.40 per week (£39,125 per year) for Great Britain. Local wages are higher than the national average but lower than many South East commuter towns, which compresses the gap between what tenants earn and what they pay in rent.
Crawley Economic Summary
- Population: 118,493 (2021 Census). Growth of 11.2% from 2011.
- Median annual salary: £39,237 (Crawley), £41,616 (South East), £39,125 (Great Britain)
- Employment rate: 78.5% (Crawley), 79.6% (South East), 75.6% (Great Britain)
- Key employment sectors: Aviation and airport services, advanced manufacturing, logistics, business services, healthcare
Source: ONS Census 2021, Nomis Labour Market Profile (ASHE 2025, Employment Oct 2024-Sep 2025)
Crawley's employment rate of 78.5% sits close to the South East average of 79.6% and above the Great Britain figure of 75.6%. The unemployment rate is suppressed in the latest Annual Population Survey data due to small sample size, which is common for smaller local authorities. For investors, the employment rate and the nature of the employers matter more than headline unemployment. Gatwick and Manor Royal provide structural employment that is not going away.
Source: Office for National Statistics - Population for Crawley
Regeneration and Investment in Crawley
Crawley has over £67m in committed regeneration funding across its two largest active projects, with a third major masterplan in the planning stage. The investment is coming from central government funding, the council, and the private sector.
- Crawley Growth Programme (underway, £60m): Major infrastructure investment across Crawley including junction upgrades, cycling and walking routes, traffic signal modernisation, and bus facility improvements. Over £3.5m is directed at Manor Royal Business District, which employs 30,000+ people and generates substantial tenant demand in surrounding postcodes. Updates at Manor Royal BID.
- Station Gateway Regeneration (under construction, £7.4m): Public realm transformation of the Martlets, Haslett Avenue West and Friary Way, plus bus station improvements and pedestrian infrastructure connecting the train and bus stations. Funded by Towns Fund and the Crawley Growth Programme, with construction underway in 2026 on a 24-month build programme. Updates at UK Property Forums.
- Town Centre East Masterplan (planning stage): Mixed-use development strategy for six key sites including the Former Town Hall, County Buildings, and Crawley College Northern Parcel. The masterplan integrates residential, commercial, cultural and public realm uses across the eastern side of the town centre, aligned with Crawley's Local Plan 2023-2040. Updates at Architects' Journal.
Regeneration areas often produce renovation properties as older stock is upgraded around new infrastructure. The Station Gateway and Town Centre East projects both sit in established residential areas where existing housing and new build development may benefit from improved public realm and transport connections.

Crawley Property Market Analysis
When Was the Last House Price Crash in Crawley?
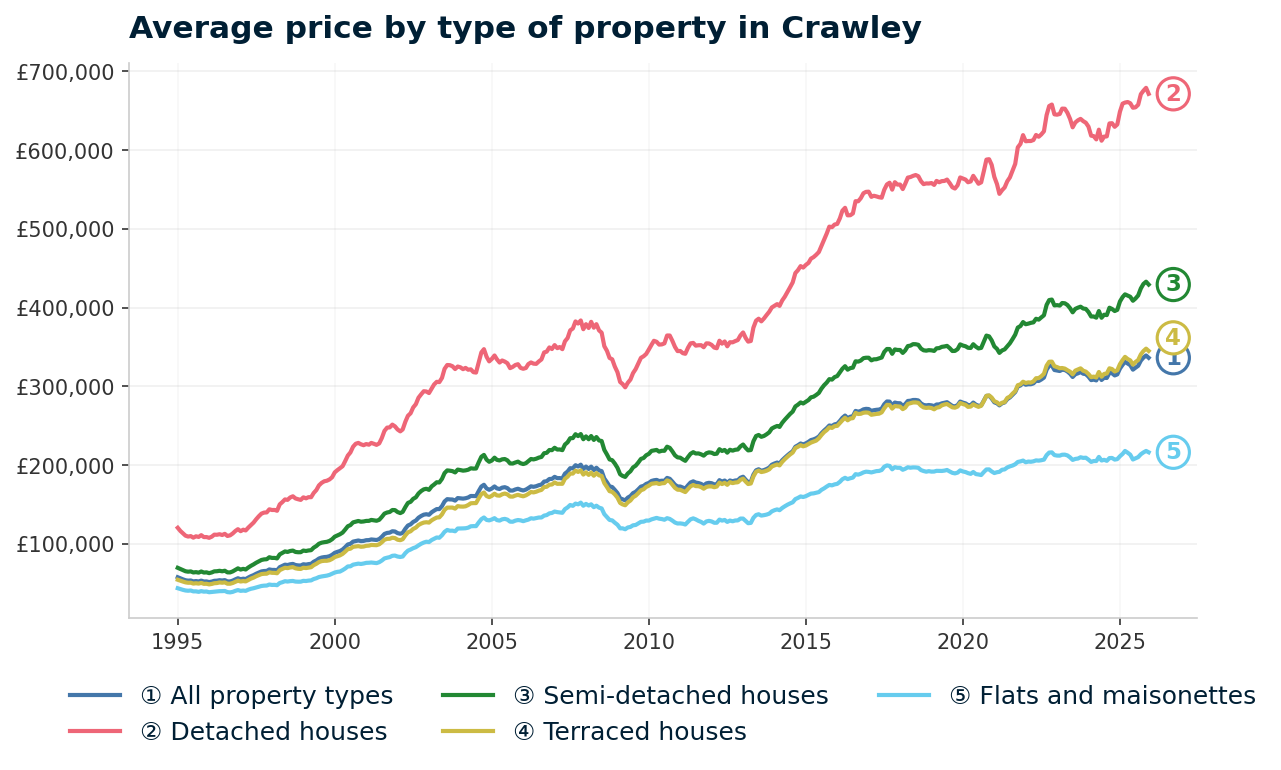
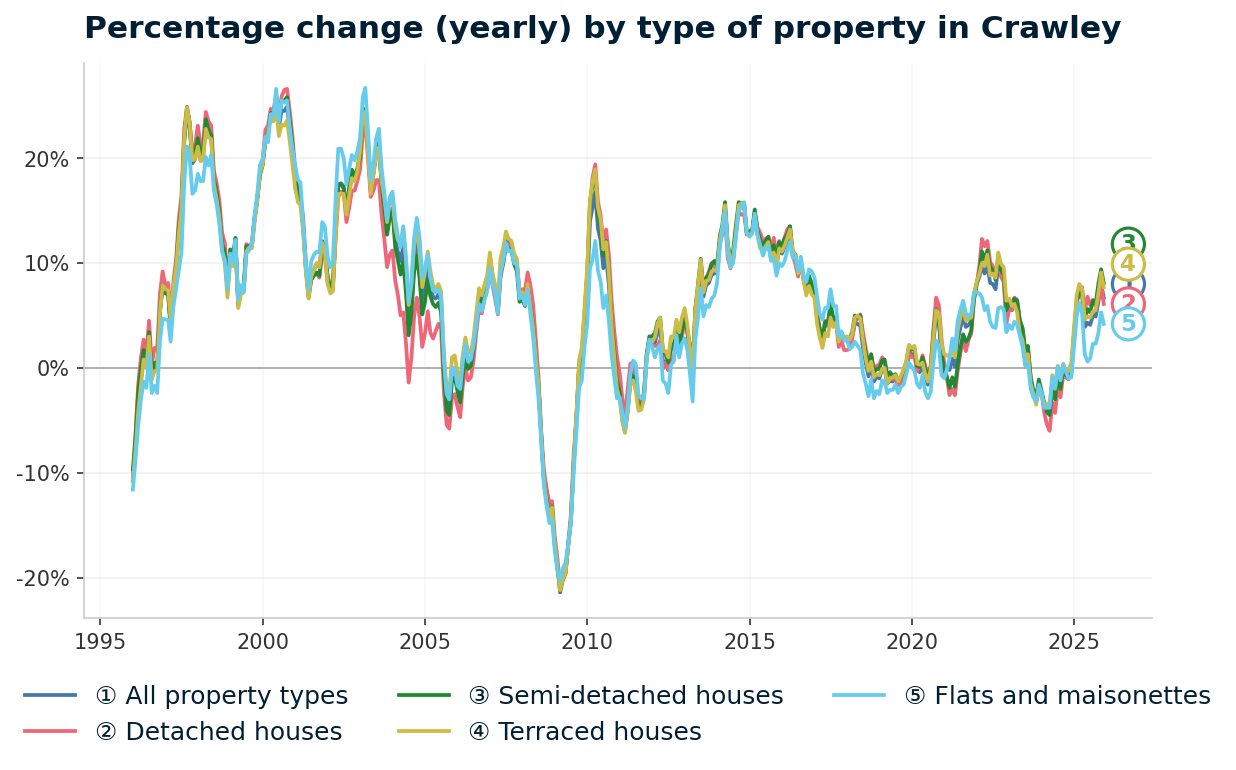
Crawley property prices fell 22.5% during the 2008 financial crisis, dropping from £200,604 to £155,372 in 17 months, and took 6 years and 2 months to recover. The full house price history from the HM Land Registry House Price Index runs from January 1995 to December 2025. Crawley fell harder than both the national and regional averages, followed by a prolonged recovery and a sharp pandemic-era surge.
- 1995-2000 (Gradual growth): Crawley began 1995 at £57,704. Prices rose steadily, reaching £88,692 by January 2000. Proximity to Gatwick and the South East commuter belt supported growth, though at a fraction of the pace that would follow.
- 2000-2007 (The boom): Prices more than doubled from £88,692 in January 2000 to a peak of £200,604 in November 2007. Cheap credit, Gatwick expansion, and South East demand pushed Crawley well beyond what local wages could support. The price-to-earnings ratio at peak was over 10x local incomes.
- 2007-2009 (The financial crisis): From the peak of £200,604 in November 2007 to the trough of £155,372 in April 2009, Crawley lost 22.5% of its value in 17 months. The worst annual change reading was -20.9% in March 2009. All property types fell almost uniformly: detached -22.1%, semi-detached -22.7%, terraced -22.9%, flats -22.2%. Crawley's decline of 22.5% was worse than the South East region (-20.0%) and significantly worse than England overall (-18.2%). Aviation-dependent towns felt the crash harder as air travel volumes dropped.
- 2009-2013 (Uneven recovery): Crawley bounced off the trough quickly. By January 2010, prices had recovered to £177,460. But the recovery stalled. Prices dipped back to £172,888 in January 2011 before climbing again. By December 2013, the average reached £200,545. Still fractionally below the pre-crash peak of £200,604.
- 2014-2016 (Full recovery and beyond): Prices finally passed the pre-crash peak in January 2014 at £202,097. That recovery took 6 years and 2 months from the November 2007 peak. Growth then accelerated sharply, reaching £252,460 by January 2016. Gatwick's passenger numbers hit record levels and demand from London workers priced out of inner boroughs pushed into commuter towns like Crawley.
- 2017-2019 (Steady growth): Prices rose from £271,230 in January 2017 to £280,792 by December 2019. Growth slowed to 1-3% per year as the market absorbed the post-recovery surge. Brexit uncertainty weighed on the South East more than other regions.
- 2020-2022 (Pandemic surge): The stamp duty holiday and the shift to hybrid working pushed Crawley prices from £276,367 in March 2020 to £320,839 by December 2022. That is 16.1% growth in under three years. Crawley's relatively affordable South East position and its transport connections made it a beneficiary of the pandemic relocation trend.
- 2023 (Rate correction): Interest rate rises cooled the market. Prices dipped from £320,839 in December 2022 to £315,574 by December 2023. A decline of 1.6%. Mild compared to the 2008 crash and shorter-lived than many expected.
- 2024-2025 (Recovery): Prices recovered and pushed higher. By December 2025, the average reached £336,354 with annual growth of 6.7%. Crawley now sits 67.7% above its pre-crash peak.
Long-Term Property Value Growth in Crawley
- 5 years (2020-2025): +18.2% (£284,681 to £336,354)
- 10 years (2015-2025): +33.6% (£251,811 to £336,354)
- 15 years (2010-2025): +94.5% (£172,975 to £336,354)
- 20 years (2005-2025): +99.3% (£168,768 to £336,354)
- 30 years (1995-2025): +542.1% (£52,383 to £336,354)
The 2008 crash is the reference point for Crawley investors assessing downside risk. A 22.5% decline took over 6 years to recover. Crawley fell harder than the regional average, partly because aviation-linked employment was directly affected by the recession.
The current market sits at a very different level. Gatwick handled record passenger numbers in 2024, Manor Royal continues to attract major employers, and the town centre regeneration programme is underway. The structural drivers are stronger now than in 2007, even if property prices are never guaranteed.
Source: HM Land Registry House Price Index for Crawley
Source: HM Land Registry House Price Index for Crawley, January 1995 to December 2025.
Thinking of Buying?
We have off-market investment properties averaging 8%+ annual yield.
View Property DealsSold House Prices in Crawley
Crawley does something that most PIUK location guides do not. The headline sold price of £336,354 sits 15.2% above England's £291,865. That means Crawley is not a discount market in national terms. The discount is within the South East, where Crawley sits 11.2% below the regional average of £378,800.
For investors looking at houses for sale in Crawley, the positioning matters. Crawley competes on value against Surrey and the Sussex coast, not against the national average.
The property type breakdown reveals where the premium is concentrated. Semi-detached houses in Crawley are 48.5% above the England average. Terraced houses are 40.9% above. Detached houses are 42.4% above. But flats sit 1.4% below.
That flat parity with England is the outlier in a market where everything else trades at a significant premium.
| Property Type | Crawley Average | England Average | Difference |
|---|---|---|---|
| Detached houses | £671,462 | £471,667 | +42.4% |
| Semi-detached houses | £429,342 | £289,135 | +48.5% |
| Terraced houses | £345,048 | £244,830 | +40.9% |
| Flats and maisonettes | £216,343 | £219,340 | -1.4% |
| All property types | £336,354 | £291,865 | +15.2% |
Semi-detached houses show the largest premium at 48.5% above England. Crawley's semi-detached stock sits in the New Town neighbourhoods of Broadfield, Three Bridges, and Langley Green. These are family homes in a town where owner-occupier demand from Gatwick and Manor Royal workers competes directly with buy-to-let investors. That competition keeps semi prices elevated.
Detached houses at £671,462 are 42.4% above England. The detached premium reflects Crawley's South East location rather than anything specific to the town. Detached properties in the Pound Hill and Maidenbower areas attract families willing to pay for space near London without London prices.
Terraced houses average £345,048, a 40.9% premium. Terraced stock in Crawley is concentrated in the original New Town neighbourhoods closer to the town centre. These are the core rental properties, particularly in RH11 where the asking price of £346,533 closely tracks the terraced sold price average.
Flats at £216,343 are the only property type trading at or below the England average, at -1.4%. Crawley's flat stock is a mix of purpose-built blocks and converted housing. The near-parity with England flat prices is significant for investors. It means Crawley flats offer South East location at a national average price point, which is where the yield calculation becomes interesting.
Property Data Sources
Our location guide relies on diverse, authoritative datasets including:
- HM Land Registry UK House Price Index
- Ministry of Housing, Communities and Local Government
- Ordnance Survey Data Hub
- Propertydata.co.uk
We update our property data quarterly to ensure accuracy. Last update: March 2026. All data is presented as provided by our sources without adjustments or amendments.
Price Per Square Foot in Crawley
Crawley's price per square foot ranges from £396 in RH11 to £452 in RH6, a spread of just £56 across three postcodes. Price per square foot strips out the size bias in average asking prices and shows what you are actually paying for space. That narrow range reflects Crawley's compact geography and relatively uniform housing stock.
| Rank | Area | Price Per Sq Ft |
|---|---|---|
| 1 | RH11 (Crawley West, Broadfield) | £396 |
| 2 | RH10 (Crawley East, Three Bridges) | £426 |
| 3 | RH6 (Gatwick, Horley) | £452 |
RH11 at £396 per square foot is the cheapest space in Crawley and also the highest-yielding postcode at 4.8%. That combination is not a coincidence. Lower per-foot costs mean landlords can acquire more space for less capital, and the rental income those properties generate pushes yields above the town average. Broadfield and the western neighbourhoods offer the most affordable entry on a size-adjusted basis.
RH6 at £452 per square foot is 14% more expensive per foot than RH11. The Gatwick and Horley area includes properties that serve the airport catchment and spill into the Surrey border, where prices run higher. RH6 also has the lowest yield at 3.3%. The premium per square foot helps explain why.
Figures reflect averages across all property types and ages. Individual values depend on condition, location within the postcode, and building age.
For Sale Asking Prices in Crawley
Sold prices show what has already transacted. Asking prices show what houses for sale in Crawley are listed at today. The gap between Crawley's cheapest and most expensive postcode is £134,966: RH11 at £346,533 versus RH6 at £481,499. For a town with only three postcodes, that is a wide range driven by RH6's proximity to Gatwick Airport and its overlap with the Surrey housing market.
RH11 at £346,533 is the only postcode where asking prices sit close to the Land Registry average sold price of £336,354. RH10 at £408,273 occupies the middle ground. RH6 at £481,499 reflects Gatwick-adjacent housing and the Surrey border premium.
| Rank | Area | Average Asking Price |
|---|---|---|
| 1 | RH11 (Crawley West, Broadfield) | £346,533 |
| 2 | RH10 (Crawley East, Three Bridges) | £408,273 |
| 3 | RH6 (Gatwick, Horley) | £481,499 |
RH10 and RH11 both generate the same average monthly rent of £1,391. But RH11's asking price is £61,740 lower. That rent parity at different price points is exactly what creates the yield gap between the two postcodes. An investor choosing between them is paying £61,740 more in RH10 for the same rental income.
RH6's asking price of £481,499 places it above the South East regional average of £378,800. The Gatwick and Horley area commands a premium that reflects its proximity to the airport and its partial overlap with the Surrey housing market. For investors, RH6 is a capital growth play rather than a yield play. The 3.3% gross yield confirms that.
The mean asking price across all Crawley houses for sale is £412,102. That figure appears in the comparison section later, where Crawley is measured against Brighton, Reading, Croydon, and Maidstone.

House Price Growth in Crawley
All three Crawley postcodes show negative one-year growth. RH6 has dropped 2.5% over the past year, RH10 has dipped 0.5%, and RH11 is down 0.3%. Short-term cooling after a strong run. The five-year picture is more revealing.
RH11 leads five-year growth at 13.6%, the only postcode in double digits. RH6 and RH10 sit at 6.9% and 5.9% respectively. For context, the Land Registry average for Crawley as a whole shows 18.2% five-year growth. The mismatch reflects the different time periods and data sources: PropertyData asking prices versus Land Registry sold prices.
| Area | 1 Year | 3 Years | 5 Years |
|---|---|---|---|
| RH11 (Crawley West, Broadfield) | -0.3% | 1.4% | 13.6% |
| RH6 (Gatwick, Horley) | -2.5% | -2.9% | 6.9% |
| RH10 (Crawley East, Three Bridges) | -0.5% | -0.2% | 5.9% |
RH11 is the only postcode with positive three-year growth at 1.4%. Both RH6 and RH10 are marginally negative over three years. The pattern is clear: the cheapest postcode has grown the most. An investor who bought in RH11 five years ago is sitting on 13.6% appreciation from the lowest entry point in Crawley.
RH6 shows the weakest trajectory across all three time periods. Negative at every interval from one year (-2.5%) to three years (-2.9%), with only 6.9% five-year growth. The Gatwick and Horley area appears to be giving back some of the pandemic-era gains. At £481,499, RH6 is priced at a level where further growth depends on rents rising to justify the capital deployed.
Monthly Property Sales in Crawley
RH10 is the most active single postcode in Crawley. At 59 sales per month, RH10 accounts for 44% of Crawley's total monthly volume of 133 transactions. That depth of market matters for exit strategy planning.
| Area | Sales Per Month | Turnover | Asking Price |
|---|---|---|---|
| RH10 (Crawley East, Three Bridges) | 59 | 42% | £408,273 |
| RH11 (Crawley West, Broadfield) | 41 | 45% | £346,533 |
| RH6 (Gatwick, Horley) | 33 | 23% | £481,499 |
RH11 has the highest turnover rate at 45%. Higher turnover means properties are selling more quickly relative to available stock. For buy-to-let investors, RH11 offers the best combination: highest yield, lowest price, and a turnover rate that confirms properties move when listed.
RH6 at 23% turnover is Crawley's least liquid postcode. Fewer sales per month (33) and a turnover rate roughly half that of RH11. At RH6's price point of £481,499, the buyer pool narrows. Investors in RH6 should factor in potentially longer sales periods if they need to exit.
Property Data Sources
Our location guide relies on diverse, authoritative datasets including:
- HM Land Registry UK House Price Index
- Ministry of Housing, Communities and Local Government
- Ordnance Survey Data Hub
- Propertydata.co.uk
We update our property data quarterly to ensure accuracy. Last update: March 2026. All data is presented as provided by our sources without adjustments or amendments.

Crawley Rental Market Analysis
For investors weighing up whether rental property is a worthwhile investment in Crawley, the data below breaks down average monthly rents and gross rental yields across the town's postcodes.
Rental data is available for all 3 postcodes. Monthly rents range from £1,324 in RH6 to £1,391 in RH10 and RH11, and gross yields range from 3.3% to 4.8%. If you are looking to build a property portfolio in the South East, Crawley's combination of airport-driven tenant demand and below-regional prices creates a focused market with clear postcode-level differences.
Average Rent & Gross Rental Yields in Crawley
Gross rental yields in Crawley range from 3.3% in RH6 to 4.8% in RH11, with two of three postcodes generating identical rents of £1,391 per month. Gross yield is calculated from the average asking price and average monthly rent. It does not account for void periods, maintenance, management fees, or mortgage costs.
The yield spread from 3.3% to 4.8% is driven entirely by price, not by rental income. RH11's lower asking price of £346,533 converts the same rent into a 4.8% yield. RH10 at £408,273 returns 4.1%. RH6 at £481,499 compresses the yield to 3.3% despite generating £1,324 per month.
| Area | Average Monthly Rent | Average Asking Price | Gross Yield |
|---|---|---|---|
| RH11 (Crawley West, Broadfield) | £1,391 | £346,533 | 4.8% |
| RH10 (Crawley East, Three Bridges) | £1,391 | £408,273 | 4.1% |
| RH6 (Gatwick, Horley) | £1,324 | £481,499 | 3.3% |
RH11 at 4.8% delivers Crawley's highest gross yield from the town's lowest asking price. The Broadfield and western Crawley neighbourhoods serve a tenant base of airport workers, logistics staff, and Manor Royal employees. These are not high-earning tenants by South East standards, but they represent consistent, employment-backed demand.
RH6's yield of 3.3% is compressed by an asking price that reflects its Gatwick-adjacent location and Surrey border overlap. Rents of £1,324 per month are actually lower than RH10 and RH11, despite the higher prices. For yield-focused investors, RH6 is the weakest postcode in the table. For those prioritising location quality and long-term capital growth near a major international airport, RH6 serves a different purpose.
The 1.5 percentage point spread between top and bottom yields is narrow compared to cities with more postcodes. Crawley's compact geography means all three postcodes draw from overlapping tenant pools. The yield differences are a price story, not a demand story.
Is Crawley Rent High?
Rent in Crawley ranges from £1,324 to £1,391 per month, consuming between 40.5% and 42.6% of the local median gross salary. For tenants, that ratio determines whether they can sustain payments long-term. For landlords, areas where rent consumes a lower share of income tend to produce more reliable tenants and fewer arrears.
The median gross weekly salary in Crawley is £754.60, which equates to £3,270 per month or £39,237 per year. This is below the South East regional median of £800.30 per week but above the Great Britain median of £752.40 per week. Data from the Nomis Labour Market Profile (ASHE 2025).
All three Crawley postcodes sit above 40% of the local median gross monthly salary. That is well above the general 30% affordability benchmark. The numbers reflect Crawley's position as a relatively high-rent South East town where local earnings, while above the national median, do not fully match the rental market.
| Rank | Area | Rent as % of Income |
|---|---|---|
| 1 | RH10 (Crawley East, Three Bridges) | 42.6% |
| 2 | RH11 (Crawley West, Broadfield) | 42.6% |
| 3 | RH6 (Gatwick, Horley) | 40.5% |
RH10 and RH11 are tied at 42.6%, driven by identical rents of £1,391 per month. These ratios look stretched on paper. But Crawley's tenant base includes a high proportion of dual-income households. Gatwick Airport employs couples as well as individuals, and Manor Royal attracts professionals whose household income is substantially above the single-person median used in this calculation.
RH6 at 40.5% is the most affordable despite being the most expensive postcode to buy in. Lower average rents of £1,324 per month pull the ratio down. For landlords, this is a positive signal: tenants in RH6 face less affordability pressure relative to income, which tends to correlate with lower arrears and longer tenancies.
Thinking of Buying?
We have off-market investment properties averaging 8%+ annual yield.
View Property DealsCrawley Buy-to-Let Considerations
Are Crawley House Prices High? Price-to-Earnings Ratios
Crawley property prices range from 8.8 to 12.3 times the local median annual salary of £39,237, with no postcode below the national benchmark of 7.5x. The national benchmark is calculated from England's average sold price of £291,865 against Great Britain's median annual salary of £39,125.
Purchasing a property in Crawley requires between 8.8 and 12.3 times the median annual salary. This is based on the Nomis Labour Market Profile for Crawley showing the median gross annual income for Crawley residents is £39,237.
No Crawley postcode sits below the national benchmark of 7.5x. RH11 at 8.8x is the closest. That places Crawley firmly in the premium affordability tier. Investors cannot find a sub-benchmark entry point here. The trade-off is South East location, Gatwick-anchored employment, and a rental market that generates above-average absolute rents.
| Rank | Area | Price-to-Earnings Ratio |
|---|---|---|
| 1 | RH11 (Crawley West, Broadfield) | 8.8x |
| 2 | RH10 (Crawley East, Three Bridges) | 10.4x |
| 3 | RH6 (Gatwick, Horley) | 12.3x |
RH11 at 8.8x is the most affordable postcode relative to local earnings and also delivers the highest yield at 4.8%. That convergence of relative affordability and yield in the same postcode is the pattern running through every table in this guide.
RH6 at 12.3x is the most stretched, sitting 64% above the national benchmark. Gatwick-adjacent pricing pushes the ratio into territory where local wages cannot support purchase prices through a standard residential mortgage. Buyers in RH6 are either cash purchasers, dual-income households, or investors deploying capital for location-driven returns rather than income.
Deposit Requirements in Crawley
A 30% buy-to-let deposit in Crawley ranges from £103,960 in RH11 to £144,450 in RH6, a gap of £40,490. Most lenders require a minimum 25% deposit. The table below uses a more conservative 30% to reflect the rates and products available at higher loan-to-value ratios, which typically unlock better interest rates.
Crawley's entry costs range from £103,960 in RH11 to £144,450 in RH6. That £40,490 gap buys access to very different markets. RH11 at £103,960 delivers a 4.8% gross yield. RH6 at £144,450 delivers 3.3%. The additional £40,490 in deposit capital generates lower percentage returns.
| Rank | Area | 30% Deposit Required |
|---|---|---|
| 1 | RH11 (Crawley West, Broadfield) | £103,960 |
| 2 | RH10 (Crawley East, Three Bridges) | £122,482 |
| 3 | RH6 (Gatwick, Horley) | £144,450 |
RH10 at £122,482 sits in the middle of Crawley's deposit range. The £18,522 premium over RH11 buys access to Crawley's most liquid postcode (59 sales per month, 42% turnover). That additional deposit buys higher liquidity at the cost of a lower yield (4.1% vs 4.8%).
All three deposits are above £100,000. Crawley is not a low-capital entry market. Investors looking for below market value properties or repossessed houses may find individual units priced below the postcode averages, but the averages reflect a South East town where six-figure deposits are the starting point. For those exploring lower-capital routes, our guide to property investment with no deposit covers alternative entry strategies.
Deposit is only part of the upfront cost. Budget for stamp duty (use our stamp duty calculator for an accurate figure), legal fees, and survey costs. For a full breakdown, see our guide to buy-to-let costs.
What the Crawley Data Tells Buy-to-Let Investors
For yield, RH11 leads at 4.8% with the lowest asking price (£346,533), lowest deposit (£103,960), and lowest price-to-earnings ratio (8.8x). RH11 tops or shares the top position in every income-focused metric. The tenant base in Broadfield and western Crawley is drawn from Gatwick ground staff, logistics workers, and Manor Royal employees. RH10 at 4.1% offers similar rents with greater liquidity (59 sales per month versus 41).
For growth, the same postcode leads. RH11 has delivered 13.6% five-year growth, more than double RH10's 5.9% and nearly double RH6's 6.9%. RH11 is the only postcode with positive three-year growth (1.4%). That convergence of yield and growth in the same postcode is the central pattern in Crawley's data.
RH6 shows the weakest data profile across most measures. Lowest yield (3.3%), highest price (£481,499), highest deposit (£144,450), lowest turnover (23%), and negative growth at every interval from one to three years. Rents of £1,324 per month are lower than the other two postcodes. RH6 serves a different investor profile: longer-term capital deployment near a major international airport, where the value is location rather than income.
Crawley has no selective licensing scheme in place. For investors exploring off-market property opportunities, the town's three-postcode market means fewer properties come to the open market, and local agent relationships are a practical route to deal flow.
How Crawley Buy-to-Let Compares to Nearby Areas
Investors looking at Crawley are typically also considering other South East locations. The table below compares Crawley against four nearby areas using the same methodology: mean asking price across all postcodes, mean monthly rent across postcodes with data, and top single-postcode gross yield.
| Location | Mean Asking Price | Mean Monthly Rent | Top Gross Yield |
|---|---|---|---|
| Crawley | £412,102 | £1,369 | 4.8% |
| Reading | £415,265 | £1,603 | 6.1% |
| Brighton | £420,745 | £1,825 | 6.6% |
| Croydon | £460,661 | £1,747 | 5.4% |
| Maidstone | £477,473 | £1,539 | 5.3% |
Crawley has the lowest mean asking price in this group at £412,102. It is £3,163 cheaper than Reading and £65,371 cheaper than Maidstone. But Crawley also has the lowest mean rent (£1,369) and the lowest top yield (4.8%). That combination of cheapest prices but lowest rents shows that Crawley's rental market does not fully exploit its price advantage.
Brighton and Reading show significantly higher top yields (6.6% and 6.1%) at similar or only slightly higher price points. Brighton's mean asking price is £420,745, just £8,643 more than Crawley, but its top yield is 1.8 percentage points higher. Croydon at £460,661 is more expensive but generates £1,747 per month in average rent, £378 more than Crawley.
Crawley's advantage is employment specificity. Gatwick Airport creates a tenant pool that does not exist in Reading, Brighton, or Maidstone. For investors who value airport-linked demand and a compact three-postcode market, Crawley's data sits within range of its South East competitors on price while offering a distinct tenant profile.
For those comparing purely on yield-per-pound, the data in this table shows other locations generating more rental income from similar capital. Investors comparing across the wider South East can browse our guide to the best buy-to-let areas or explore buy-to-let properties in Sussex.
Frequently Asked Questions
What are the best areas to buy property in Crawley?
RH11 (Crawley West, Broadfield) leads on yield at 4.8%, five-year growth at 13.6%, and affordability at £346,533. Crawley has three postcodes. RH10 (Crawley East, Three Bridges) offers higher liquidity with 59 sales per month and a 4.1% yield. RH6 (Gatwick, Horley) is the most expensive at £481,499 with a 3.3% yield. Each postcode draws from overlapping tenant pools linked to Gatwick Airport and Manor Royal Business District, so the differences between postcodes are driven by price and growth rather than tenant demand.
How does Crawley compare to Brighton for buy-to-let?
Crawley is cheaper (£412,102 vs £420,745 mean asking price) but generates lower yields (4.8% vs 6.6%) and lower rents (£1,369 vs £1,825). Brighton's rental market benefits from a larger tenant pool including students, young professionals, and tourism workers. Crawley's tenant demand is more concentrated around aviation and business park employment. Brighton has more postcodes (6 vs 3), which gives investors a wider range of entry points and strategies. Crawley's advantage is a lower entry price and a more specific employment anchor.
How does Gatwick Airport affect Crawley's rental market?
Gatwick is the single largest driver of tenant demand in Crawley. The airport directly employs around 24,000 people on campus, with further thousands in the supply chain, hotels, and ground transport. That employment base creates year-round rental demand in all three Crawley postcodes, particularly RH6 (Gatwick, Horley) and RH10 (Crawley East, Three Bridges). Airline crew, ground handlers, security staff, and logistics workers need housing close to the airport. Gatwick handled over 32 million passengers in 2024 and has planning consent for expanded use of its existing northern runway. The airport is Crawley's largest single employer and the primary driver of its rental market.
Are there property investment companies operating in Crawley?
Several firms market investment properties in the Crawley and Gatwick corridor. Most focus on new-build developments and apartment blocks near the town centre. The data in this guide covers the open market across existing stock and new build Crawley properties. Any property sold through an investment company can be benchmarked against these figures, though it does not guarantee market value as these are average values. Compare asking prices, yields, and price per square foot against the postcode-level data above before committing to a purchase through any third party.
Is Crawley a good place to live for commuters?
Crawley has direct trains to London Victoria and London Bridge in 40-45 minutes via the Brighton Main Line. Three Bridges station (RH10) is the main commuter hub with the highest frequency of services. Gatwick Airport station provides additional rail connections. The M23 connects Crawley to the M25 and central London. The town's population grew 11.2% between 2011 and 2021, and the employment rate of 78.5% sits close to the South East average of 79.6%. Average sold prices of £336,354 are 11.2% below the South East regional average of £378,800, which positions Crawley as a more affordable South East commuter option.
What types of houses are for sale in Crawley?
All four main property types are available. Detached houses average £671,462, semi-detached £429,342, terraced £345,048, and flats £216,343 based on December 2025 Land Registry data. Terraced houses and flats dominate the New Town neighbourhoods of Broadfield, Three Bridges, and Langley Green. These are the property types that most buy-to-let investors target in Crawley, and they sit closest to the postcode-level asking prices where yield calculations are strongest. Asking prices across all types range from £346,533 in RH11 to £481,499 in RH6.
Are there new build properties in Crawley?
New build development is active in Crawley, particularly around the town centre and on the borough's edges. The Town Centre East Masterplan covers six key sites including the Former Town Hall and Crawley College Northern Parcel, with residential development integrated into the plans. Crawley's Local Plan 2023-2040 allocates land for new housing. New build properties in Crawley typically carry a premium over existing stock. Investors comparing new build prices against the postcode averages in this guide (RH11 at £346,533, RH10 at £408,273, RH6 at £481,499) can assess whether the premium is justified by the rental income achievable.