Greenwich is a borough of south-east London. Average sold prices across the Royal Borough of Greenwich sit at £465,960 on the HM Land Registry House Price Index, 60.7% above the England average of £289,946 yet 14.0% below the £542,065 average for London as a whole. That places Greenwich in the more affordable band of inner south-east London, priced for a buyer who wants a London postcode and a Thames-side address without paying a central-zone price. The line that sets Greenwich apart from most of the capital is where the yield sits: the cheapest postcode, SE28 in Thamesmead at £353,697, also carries the borough's top gross yield at 6.3%, so the entry point and the income return land in the same place.
Greenwich's price profile depends on what kind of home you buy as much as where. A detached house here averages £1,013,656, which is 115.4% above the England figure, while a flat averages £355,080, only 65.5% above. For a buy-to-let investor that gap is the whole story: the income return in Greenwich is built on flats and the regeneration corridor along the river, not on the family houses of Blackheath and Eltham. The spread between SE28 at £353,697 and SE3 (Blackheath) at £543,833 creates a two-tier borough, where the higher yields sit with the newer Thames-side stock rather than the established leafy south.
This guide covers the Royal Borough of Greenwich (ONS code E09000011) across ten postcode districts: DA15, DA16, SE2, SE3, SE7, SE8, SE9, SE10, SE18, and SE28. Greenwich sits south of the Thames in south-east London, bordered by Lewisham to the west and Bexley to the east. Several of its postcodes sit on a boundary: DA15 (Sidcup) and DA16 (Welling) share a frontier with Bexley, SE9 covers Eltham, and SE8 (Deptford) edges into Lewisham. PropertyData figures cover the full postcode district in each case.
Article updated: July 2026

Why Invest in Greenwich?
The Royal Borough of Greenwich grew its population 13.56% between the 2011 and 2021 censuses, from 254,557 to 289,068 residents, more than double the England and Wales average of 6.3%. That is one of the faster growth rates in London, and it has clustered along the river, where Greenwich Peninsula, Woolwich and Thamesmead have added thousands of new homes over the past decade. A population growing faster than the housing stock can keep up with is the backdrop to the rental demand the later sections set out.
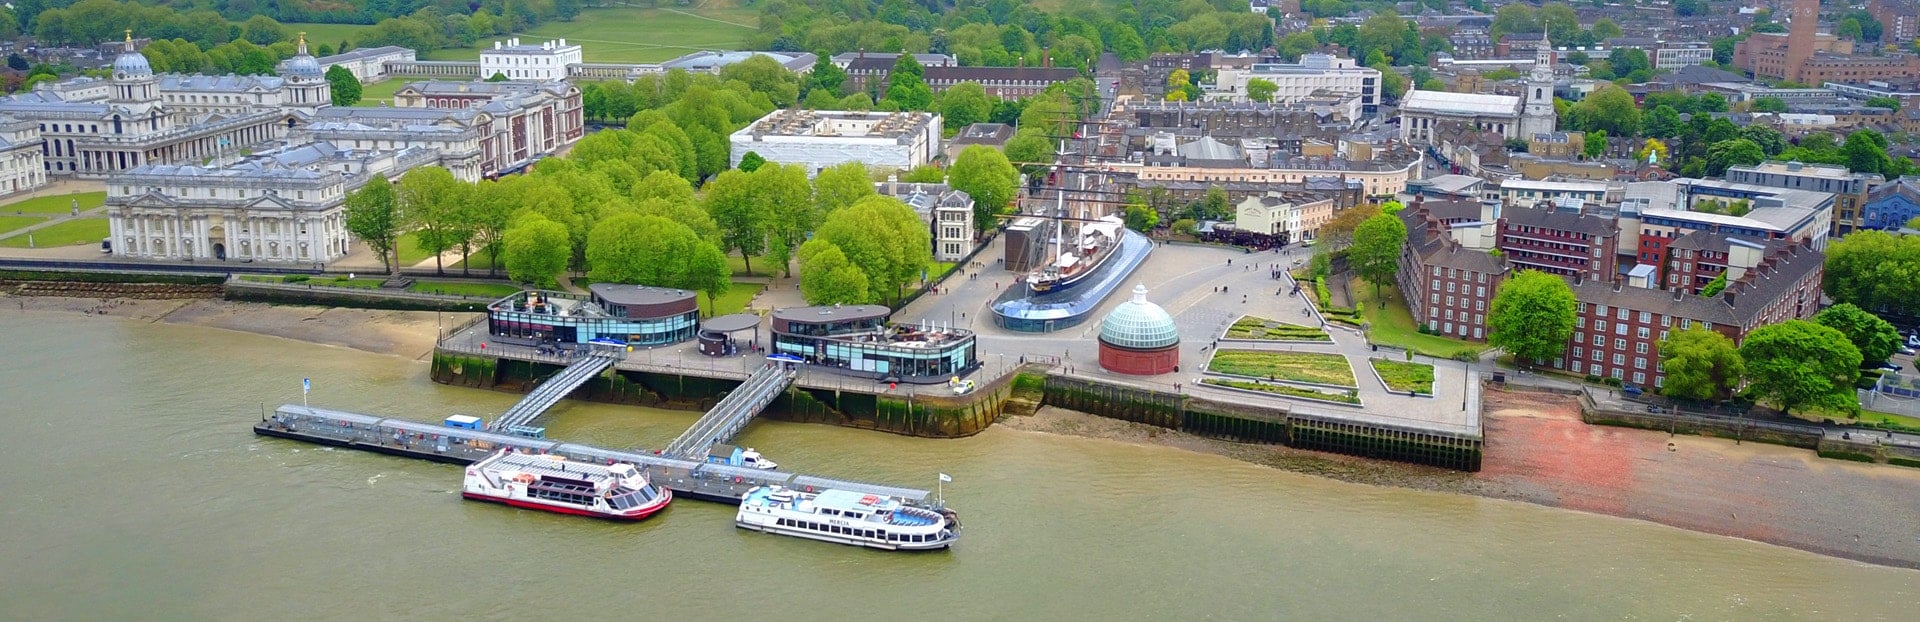
Greenwich's draw is partly heritage and partly connectivity. The maritime town at the centre of the borough, with the Old Royal Naval College, the Cutty Sark and Greenwich Park, is a UNESCO World Heritage Site that pulls year-round visitors and supports a steady hospitality economy. Around it, the Elizabeth line at Woolwich, the Jubilee line and Docklands Light Railway on the Peninsula, and the IFS Cloud cable car across the Thames give the borough fast links into Canary Wharf, the City and the West End. Tenants who work in central London but cannot afford to live there are the core of the local lettings market.
Median gross annual earnings for Greenwich residents are £45,274, which is below the London median of £46,415 a year (£892.60 a week) but 15.7% above the Great Britain median of £39,125. The local employment rate is 75.0%, in line with the Great Britain figure of 75.6%. Wages here are London wages on a sub-London house price, and that combination is what supports the borough's rents against its entry costs.
Greenwich Economic Summary
- Population (Royal Borough of Greenwich): 289,068 (2021 Census). Growth of 13.56% from 2011.
- Median annual salary: £45,274 (local), £46,415 (London), £39,125 (Great Britain)
- Employment rate: 75.0% (local), 75.6% (Great Britain)
- Median gross weekly pay: £870.70 (local), £892.60 (London), £752.40 (Great Britain)
- Key transport: Elizabeth line (Woolwich), Jubilee line and DLR (Greenwich Peninsula, Woolwich), national rail to London Bridge and Cannon Street, IFS Cloud cable car
Source: ONS Census 2021, Nomis Labour Market Profile (ASHE 2025)
Regeneration and Investment in Greenwich
Greenwich's regeneration runs along the Thames, where Greenwich Peninsula, Woolwich and Thamesmead together carry tens of thousands of planned homes and the transport links to serve them. The borough's population growth has tracked these schemes, and the postcodes that hold them, SE10, SE18 and SE28, are the same ones carrying the higher rental yields set out below.
- Greenwich Peninsula (Active, 15,000+ homes planned): The masterplan around the O2 and North Greenwich station is one of the largest single regeneration sites in Europe, delivering new homes, offices, a film studio and public space in phases over the coming decades. The Jubilee line and the IFS Cloud cable car already serve it, and new residential blocks are still being added in SE10. Updates at Greenwich Peninsula.
- Woolwich Regeneration (Active): The Elizabeth line reaching Woolwich in 2022 anchored a wave of new development around the town centre and the former Royal Arsenal, in SE18, cutting journey times into the City and Canary Wharf and drawing residential investment to a part of the borough that had long lagged the riverside west. Updates at Royal Borough of Greenwich.
- Thamesmead and the DLR Extension (Confirmed): Government support for extending the Docklands Light Railway from Beckton across the river to Thamesmead was confirmed in 2025, the largest infrastructure commitment the area has had. Thamesmead, in SE28, is the borough's cheapest entry point and its top-yielding postcode, and a committed rail link is the kind of long-term driver that changes a regeneration-corridor location. Updates at Royal Borough of Greenwich.
Source: Office for National Statistics - Population for Greenwich

Greenwich Property Market Analysis
Average property prices in the Royal Borough of Greenwich have risen 608.3% since January 1995, from £65,784 to £465,960. The sections below break that journey down cycle by cycle, then drill into current postcode-level data for sold prices, price per square foot, asking prices, growth trends, and monthly transaction volumes.
When was the last house price crash in Greenwich?
Greenwich's sold prices come from HM Land Registry at local-authority level, covering the whole Royal Borough. The index tracks average prices from January 1995 to March 2026, spanning 31 years of London market cycles.
The 1995 to 2007 boom: Greenwich started at £65,784 in January 1995. By December 2000 the average had reached £120,975, an 83.9% rise in six years as the early-2000s London market took off. Growth continued through the decade, reaching £214,261 by December 2005 and £251,525 by December 2007. The market peaked at £254,533 in April 2008, later than much of the country because London ran hot for longer.
2008 to 2009, the financial crisis: Prices fell from the April 2008 peak of £254,533 to a trough of £211,456 in June 2009, a decline of 16.9% over 14 months. The worst year-on-year reading was -16.9% in June 2009. Greenwich's fall was close to the England drop of 18.2% over the same downturn, with the borough's exposure to first-time-buyer and investor stock leaving it more sensitive than the prime central-London market.
The recovery, 2010 to 2012: London led the national recovery, and Greenwich came back faster than most regional markets. Prices climbed from £242,643 in December 2010 to £255,292 by December 2012, with July 2012 the first month to clear the April 2008 peak at £254,672. That recovery took about four years and three months, roughly half the time markets in the north of England needed to regain their pre-crash levels.
2013 to 2016, the London surge: This was the borough's strongest stretch. Prices ran from £286,121 in December 2013 to £380,375 by December 2015, a period of double-digit annual growth, with April 2016 hitting £387,360 at 17.0% year-on-year. Help-to-buy, cheap credit and the Crossrail and regeneration story along the river all pulled buyers into south-east London.
2017 to 2020, the plateau: Growth flattened as stamp-duty changes and Brexit uncertainty cooled London. Prices edged from £407,431 in December 2017 to £407,689 in December 2018 (0.1% annual) and £421,946 by December 2019. The borough spent three years close to flat after the surge.
2020 to 2022, the pandemic high: The stamp-duty holiday and a shift towards homes with space lifted prices again, from £423,731 in December 2020 to an all-time high of £494,314 in August 2022 (11.7% annual growth). That August 2022 reading remains the highest figure Greenwich has recorded.
2023 to present, the rate-shock easing: Higher mortgage rates pulled prices back from the 2022 high. The average eased to £439,931 by June 2023 (-6.7% annual) and £446,287 by December 2023, recovered to £472,036 by December 2024, then drifted to £463,280 by December 2025. The latest reading is £465,960 in March 2026, which is 5.7% below the August 2022 peak but 83.1% above the April 2008 pre-crash peak of £254,533.
Long-term growth summary:
- 5 years (March 2021 to March 2026): 5.3% growth (£442,541 to £465,960)
- 10 years (March 2016 to March 2026): 22.4% growth (£380,621 to £465,960)
- 15 years (March 2011 to March 2026): 95.1% growth (£238,870 to £465,960)
- 20 years (March 2006 to March 2026): 119.7% growth (£212,077 to £465,960)
- 30 years (January 1995 to March 2026): 608.3% growth (£65,784 to £465,960)
Greenwich's 16.9% crash was close to the national average, but the four-and-a-quarter-year recovery was far quicker than the markets outside the South East, reflecting London's lead in the post-2009 rebound. The 30-year return of 608.3% is well ahead of most of the country, and the recent picture is a market that overshot in 2022 and has been settling since rather than falling sharply. An investor who bought at the exact peak in April 2008 would be sitting on a gain of 83.1% on the Land Registry average, even after the recent easing.
The two charts below plot the borough average alongside detached, semi-detached, terraced and flat prices since 1995, and the year-on-year change for each type. They show the family-house premium opening up over the decades while flats, the entry point for most Greenwich landlords, track a lower but steadier line.
- All property types
- Detached
- Semi-detached
- Terraced
- Flats
- All property types
- Detached
- Semi-detached
- Terraced
- Flats
Sold House Prices in Greenwich
The average sold price across all property types in the Royal Borough of Greenwich is £465,960, which is 60.7% above the England average of £289,946 as of March 2026. That premium is what you pay for a London postcode, but it is not spread evenly across the housing stock. Detached houses sit 115.4% above England, semi-detached 147.4%, terraced 125.3%, and flats only 65.5%. The pattern tells you where the buy-to-let value is: the smaller the unit, the smaller the London premium, and flats are where Greenwich's asking prices and its rental income meet.
| Property Type | Greenwich Average | England Average | Difference |
|---|---|---|---|
| Detached houses | £1,013,656 | £470,492 | +115.4% |
| Semi-detached houses | £712,935 | £288,185 | +147.4% |
| Terraced houses | £549,337 | £243,788 | +125.3% |
| Flats and maisonettes | £355,080 | £214,563 | +65.5% |
| All property types | £465,960 | £289,946 | +60.7% |
Detached houses at £1,013,656 carry the largest premium to England at 115.4%, and they are scarce. The borough's detached stock concentrates in the leafy south, around Blackheath in SE3 and Eltham in SE9, where seven-figure family homes change hands. Annual growth of 3.5% is the strongest of the four types, a sign of steady demand at the top of the market, but at a million pounds a unit this is owner-occupier territory rather than a buy-to-let entry point.
Semi-detached houses at £712,935 show the widest gap of all, 147.4% above England's £288,185. The semi-detached stock dominates the southern postcodes, DA16 (Welling), SE9 (Eltham) and DA15 (Sidcup), where suburban inter-war housing fills the streets. Annual growth of 2.8% points to a settled family market. For an investor, a £700,000 semi lets to a household rather than to sharers, and the yield maths reflects that.
Terraced houses at £549,337 sit 125.3% above England's £243,788. The terraced stock spreads across the inner postcodes, the Victorian streets of SE18 (Woolwich) and SE7 (Charlton) and the older parts of SE10 (Greenwich town). Annual growth of 2.5% tracks the borough average. Terraces are the bridge between the flat market and the family-house market, and in the cheaper postcodes they offer the most rentable space per pound.
Flats and maisonettes at £355,080 carry the smallest premium at 65.5% above England's £214,563, and they are the engine of Greenwich's buy-to-let market. The new-build blocks of Greenwich Peninsula (SE10), the riverside developments of Woolwich (SE18) and the apartment stock of Deptford (SE8) and Thamesmead (SE28) make flats the most common home type in the postcodes that carry the higher yields. Annual change of -1.9% is the only negative reading among the four types, reflecting the wave of new flat supply along the river that has held prices in check while keeping the income return high.
Price Per Square Foot in Greenwich
SE10 (Greenwich town) commands £689 per square foot against SE28's (Thamesmead) £453, a £236 gap that is the widest in the borough. Measuring by the square foot takes property size out of the comparison, so what is left is the value the location itself carries. SE10's riverside position, heritage core and Jubilee-line link put it at the top; Thamesmead's newer, further-out stock sits at the bottom.
| Rank | Area | Price Per Sq Ft |
|---|---|---|
| 1 | SE28 (Thamesmead) | £453 |
| 2 | SE2 (Abbey Wood) | £473 |
| 3 | SE18 (Woolwich) | £488 |
| 4 | DA16 (Welling) | £494 |
| 5 | SE9 (Eltham) | £503 |
| 6 | DA15 (Sidcup) | £523 |
| 7 | SE7 (Charlton) | £533 |
| 8 | SE8 (Deptford) | £610 |
| 9 | SE3 (Blackheath) | £642 |
| 10 | SE10 (Greenwich town) | £689 |
SE28 at £453 per square foot is the cheapest space in the borough, drawn from 313 transactions analysed. Thamesmead's stock is largely post-war and newer flats further from a fast rail link, which is exactly why the per-foot value sits lowest, and why its yield sits highest. SE8 (Deptford) at £610 is the surprise of the table, a per-foot figure above Blackheath's price band despite lower asking prices, because Deptford's stock is so flat-heavy that small, central units pull the per-foot rate up.
SE10 at £689 per square foot tops the table, from 623 transactions analysed. When buyers pay this much per foot they are paying for the riverside, the World Heritage core and the Jubilee-line ride to Canary Wharf in a few minutes. SE10 has both the highest per-foot value and, as the asking-price table below shows, among the highest entry costs, which is why its yield sits in the middle of the pack rather than the top.
For Sale Asking Prices in Greenwich
SE28 (Thamesmead) at £353,697 and SE3 (Blackheath) at £543,833 sit 53.8% apart, the full span of asking prices across the borough's ten postcodes. That gap maps neatly onto the geography: the cheaper postcodes are the newer Thames-side and south-eastern districts, the dearer ones are the established residential heart. The mean asking price across all ten Greenwich postcodes is £464,537.
| Rank | Area | Asking Price |
|---|---|---|
| 1 | SE28 (Thamesmead) | £353,697 |
| 2 | SE8 (Deptford) | £428,640 |
| 3 | SE2 (Abbey Wood) | £430,204 |
| 4 | SE18 (Woolwich) | £433,945 |
| 5 | DA16 (Welling) | £467,976 |
| 6 | SE7 (Charlton) | £469,516 |
| 7 | SE9 (Eltham) | £488,523 |
| 8 | DA15 (Sidcup) | £504,934 |
| 9 | SE10 (Greenwich town) | £524,106 |
| 10 | SE3 (Blackheath) | £543,833 |
SE28 at £353,697 is the only Greenwich postcode below £400,000, and the cheapest way into the borough by a clear margin. Thamesmead's stock of post-war and newer flats, set against the confirmed DLR extension, is the regeneration-corridor entry point: a sub-£360,000 London asking price that comes with the borough's highest rental yield. The four cheapest postcodes, SE28, SE8, SE2 and SE18, are all flat-heavy riverside or near-river districts.
SE3's £543,833 sits at the top, and it buys a different borough. Blackheath's Georgian and Victorian houses around the heath are owner-occupier homes, and the asking price reflects scarcity of family stock rather than rental demand. SE10 (Greenwich town) at £524,106 and DA15 (Sidcup) at £504,934 round out the top three, one for its heritage-and-riverside premium, the other for its further-out suburban houses. The yield data below confirms that the dearest postcodes are not where the income return sits.

House Price Growth in Greenwich
SE2 (Abbey Wood) leads Greenwich for capital growth, up 7.2% over one year, 14.8% over three and 24.9% over five, the only postcode positive across all three timeframes by a clear margin. The Elizabeth line reaching Abbey Wood is the obvious driver. At the other end, the new-build-heavy SE10 and SE8 are both negative across all three windows, where a steady stream of flat completions has weighed on resale values.
| Area | 1 Year | 3 Years | 5 Years |
|---|---|---|---|
| SE2 (Abbey Wood) | 7.2% | 14.8% | 24.9% |
| DA16 (Welling) | 1.1% | 3.7% | 13.6% |
| DA15 (Sidcup) | 1.8% | -0.7% | 12.0% |
| SE3 (Blackheath) | 7.2% | 12.1% | 11.0% |
| SE9 (Eltham) | 0.2% | 2.9% | 10.0% |
| SE28 (Thamesmead) | -11.0% | 5.4% | 9.0% |
| SE18 (Woolwich) | -1.6% | -6.1% | 6.1% |
| SE7 (Charlton) | 1.3% | 5.9% | 2.6% |
| SE8 (Deptford) | -5.0% | -4.5% | -5.2% |
| SE10 (Greenwich town) | -3.8% | -8.3% | -6.6% |
SE2 at 24.9% five-year growth has by far the highest return in Greenwich, and the pattern is consistent rather than a single spike: up across one, three and five years. Abbey Wood's transformation around its Elizabeth-line station, a 30-minute ride to Bond Street, has pulled buyers into a postcode that was overlooked a decade ago. SE3 (Blackheath) is the steadier story, up 11.0% over five years on the strength of its established family market rather than a transport catalyst.
SE10's -6.6% five-year reading is the weakest in the borough, and SE8 (Deptford) at -5.2% sits just above it. Both are dominated by new-build flats, and both show how a heavy pipeline of fresh supply can hold down resale growth even where rental demand stays strong. SE28 (Thamesmead) carries a sharp -11.0% one-year figure that sits against a positive 9.0% over five years, a volatile recent reading on a thinner market rather than a settled decline.
Monthly Property Sales in Greenwich
Sales volumes range from 9 transactions a month in SE7 (Charlton) to 41 in SE18 (Woolwich), with turnover, the share of homes changing hands each year, running from 4% to 21%. The busiest postcodes for transactions are not the same as the fastest to sell, a distinction the next section draws out. DA16 (Welling) stands out with the highest turnover at 21%, a smaller but fast-churning market.
| Area | Sales Per Month | Turnover | Asking Price |
|---|---|---|---|
| SE18 (Woolwich) | 41 | 6% | £433,945 |
| SE9 (Eltham) | 38 | 13% | £488,523 |
| SE10 (Greenwich town) | 32 | 4% | £524,106 |
| DA16 (Welling) | 23 | 21% | £467,976 |
| SE3 (Blackheath) | 21 | 4% | £543,833 |
| SE8 (Deptford) | 18 | 6% | £428,640 |
| DA15 (Sidcup) | 17 | 11% | £504,934 |
| SE28 (Thamesmead) | 17 | 12% | £353,697 |
| SE2 (Abbey Wood) | 14 | 13% | £430,204 |
| SE7 (Charlton) | 9 | 5% | £469,516 |
SE18 (Woolwich) records the most transactions at 41 a month, but its 6% turnover is low because the large, fast-growing flat stock means those 41 sales are a small share of the total. DA16 (Welling) shows the opposite: 23 sales a month but a 21% turnover, the highest in the borough, on a smaller stock of suburban houses that change hands often. For an investor, high turnover signals an active resale market and an easier exit when the time comes.
SE10 (Greenwich town) and SE3 (Blackheath) share the lowest turnover at 4%, where premium and new-build stock both sit longer before selling. SE7 (Charlton) is the quietest market at 9 sales a month, a thin postcode where listings are few and an exit can take longer to arrange.
How Long Properties Take to Sell in Greenwich
DA16 (Welling) finds a buyer in about 127 days while SE10 (Greenwich town) and SE3 (Blackheath) sit for roughly 761, a six-fold spread that is the sharpest divide in the borough. Days on market is the typical time a home is listed before it sells; the months of unsold stock measures how much for-sale supply is queued at the current rate of sales. A landlord weighing two postcodes on yield alone misses this: SE10's 25 months of stock is a long wait to get capital back out, whatever the rent does.
| Area | Avg Days to Sell | Months of Unsold Stock | Market |
|---|---|---|---|
| DA16 (Welling) | 127 | 4.2 | Seller's market |
| SE2 (Abbey Wood) | 234 | 7.7 | Balanced market |
| SE9 (Eltham) | 234 | 7.7 | Balanced market |
| SE28 (Thamesmead) | 254 | 8.3 | Balanced market |
| DA15 (Sidcup) | 277 | 9.1 | Balanced market |
| SE18 (Woolwich) | 507 | 16.7 | Buyer's market |
| SE8 (Deptford) | 507 | 16.7 | Buyer's market |
| SE7 (Charlton) | 608 | 20.0 | Buyer's market |
| SE10 (Greenwich town) | 761 | 25.0 | Buyer's market |
| SE3 (Blackheath) | 761 | 25.0 | Buyer's market |
The split is stark: the southern house markets of DA16, SE9 and DA15 clear in four to nine months, while the riverside flat postcodes, SE18, SE8, SE10 and SE3, carry 16 to 25 months of unsold stock. The same new-build supply that holds down capital growth in SE10 and SE8 also makes them slow to sell, so a buyer there has negotiating room but a future seller faces a long wait. That trade-off is invisible in a yield figure and worth pricing in before buying.
What Type of Property Can You Buy in Greenwich?
Flats are the largest single category in six of Greenwich's ten postcodes, rising to 78.7% of stock in SE8 (Deptford) and 75.2% in SE10 (Greenwich town), while semi-detached houses dominate the southern districts. The mix of housing stock shapes which strategy fits where. The figures below are drawn from 2021 Census records for each postcode.
| Area | Detached | Semi-detached | Terraced | Flats |
|---|---|---|---|---|
| DA15 (Sidcup) | 10.0% | 48.5% | 24.6% | 16.8% |
| DA16 (Welling) | 3.8% | 65.9% | 17.2% | 13.2% |
| SE2 (Abbey Wood) | 6.7% | 23.1% | 36.8% | 33.2% |
| SE3 (Blackheath) | 7.8% | 23.8% | 21.8% | 46.6% |
| SE7 (Charlton) | 3.8% | 22.2% | 29.1% | 44.8% |
| SE8 (Deptford) | 1.6% | 4.6% | 14.9% | 78.7% |
| SE9 (Eltham) | 8.9% | 38.6% | 23.1% | 29.3% |
| SE10 (Greenwich town) | 2.6% | 5.2% | 17.0% | 75.2% |
| SE18 (Woolwich) | 4.9% | 18.6% | 31.8% | 44.6% |
| SE28 (Thamesmead) | 6.0% | 17.7% | 34.7% | 41.6% |
SE8 (Deptford) and SE10 (Greenwich town) are the flat capitals of the borough at 78.7% and 75.2%, the riverside apartment stock that suits single lets and professional sharers commuting into Canary Wharf and the City. These are the postcodes a flat-focused investor works in, and they line up with the higher yields and the longer selling times in the data above. SE18 (Woolwich), SE3 (Blackheath) and SE7 (Charlton) all sit in the mid-40s for flats, a more mixed stock of apartments and houses.
DA16 (Welling) is the most house-dominated postcode, with semi-detached homes alone at 65.9% and flats at just 13.2%. DA15 (Sidcup) is similar, with semis at 48.5%. These southern suburban districts are weighted towards family houses rather than the smaller units that drive rental income, which is why their yields sit at the bottom of the table despite turning over quickly.
The flats figure covers purpose-built blocks, converted flats and the small share in commercial buildings. A few non-standard dwellings are excluded, so rows may not total 100%.

Greenwich Rental Market Analysis
Monthly rents in Greenwich range from £1,737 in DA15 (Sidcup) to £2,285 in SE10 (Greenwich town), with gross rental yields from 4.1% to 6.3% across all ten postcodes. For investors asking is buy to let a good investment in Greenwich, the sections below break down rents, yields, and tenant affordability postcode by postcode. If you are looking at how to start a property business in London, Greenwich pairs a sub-central asking price with London-level rents and one of the deepest tenant pools in the South East. Browse current buy-to-let property for sale across the region.
Average Rent & Gross Rental Yields in Greenwich
Gross rental yields in Greenwich range from 4.1% in DA15 (Sidcup) to 6.3% in SE28 (Thamesmead). The cheapest postcode delivers the highest yield and the dearest house markets deliver the lowest. SE28 charges the lowest rent in the table at £1,868 a month, yet still tops the yield table because its £353,697 asking price is so far below the rest of the borough.
| Area | Average Monthly Rent | Asking Price | Gross Yield |
|---|---|---|---|
| SE28 (Thamesmead) | £1,868 | £353,697 | 6.3% |
| SE8 (Deptford) | £2,157 | £428,640 | 6.0% |
| SE18 (Woolwich) | £2,068 | £433,945 | 5.7% |
| SE2 (Abbey Wood) | £2,029 | £430,204 | 5.7% |
| DA16 (Welling) | £2,018 | £467,976 | 5.2% |
| SE10 (Greenwich town) | £2,285 | £524,106 | 5.2% |
| SE7 (Charlton) | £2,030 | £469,516 | 5.2% |
| SE9 (Eltham) | £2,048 | £488,523 | 5.0% |
| SE3 (Blackheath) | £2,209 | £543,833 | 4.9% |
| DA15 (Sidcup) | £1,737 | £504,934 | 4.1% |
SE28 (Thamesmead) at 6.3% pairs the borough's lowest asking price with a £1,868 rent to deliver the best income return. A 30% deposit of £106,109 gets an investor into the highest-yielding postcode, with the confirmed DLR extension sitting behind it as a long-term driver. SE8 (Deptford) follows at 6.0%, where heavy flat supply keeps purchase prices in check while the central-London commute keeps rents firm.
At the other end, DA15 (Sidcup) at 4.1% has the lowest yield despite the second-highest asking price, because its suburban house stock rents for the least in the borough at £1,737. The dearer house markets, DA15, SE3 (Blackheath) and SE9 (Eltham), all sit at the bottom for yield: the premium their prices command does more for capital value than for income.
Gross Rental Yield by Postcode
Is Greenwich Rent High?
Monthly rents in Greenwich take between 46.0% and 60.6% of the local median gross monthly salary, well above the 30% affordability threshold across every postcode. That is the London rental reality: rents are set by demand from people who work in the centre, not by what a median local earner can comfortably afford, so the conventional 30% benchmark is breached everywhere in the borough. The median gross weekly salary for Greenwich residents is £870.70, which equates to £3,773 a month, or £45,274 a year. Data from the Nomis Labour Market Profile (ASHE 2025).
| Rank | Area | Rent as % of Income |
|---|---|---|
| 1 | SE10 (Greenwich town) | 60.6% |
| 2 | SE3 (Blackheath) | 58.6% |
| 3 | SE8 (Deptford) | 57.2% |
| 4 | SE18 (Woolwich) | 54.8% |
| 5 | SE9 (Eltham) | 54.3% |
| 6 | SE7 (Charlton) | 53.8% |
| 7 | SE2 (Abbey Wood) | 53.8% |
| 8 | DA16 (Welling) | 53.5% |
| 9 | SE28 (Thamesmead) | 49.5% |
| 10 | DA15 (Sidcup) | 46.0% |
SE10 (Greenwich town) at 60.6% is the least affordable for a single median earner, where a £2,285 rent meets a £3,773 monthly salary. In practice the tenants paying these rents are dual-income households or sharers earning above the borough median, often working in Canary Wharf rather than locally. For a landlord, the relevant point is that demand at these levels comes from a wider central-London labour market, not from the local wage alone.
DA15 (Sidcup) at 46.0% is the most affordable in the borough against local income, a function of its lower £1,737 rent rather than higher pay. The southern suburban postcodes, DA15 and DA16, are the closest Greenwich gets to a rent a local family on the median salary could carry, which is part of why they hold their tenants and turn over quickly.
How Big Is Greenwich's Private Rented Sector?
The private rented sector is deepest in SE10 (Greenwich town) at 45.2% of households and SE8 (Deptford) at 31.1%, and shallowest in the southern house markets of DA16 (Welling) and DA15 (Sidcup) at around 13%. The share of homes already let privately is a read on how large and how tested the local tenant pool is. The table below shows household tenure by postcode.
| Area | Owned Outright | Owned with Mortgage | Private Rented | Social Rented |
|---|---|---|---|---|
| SE10 (Greenwich town) | 12.6% | 22.2% | 45.2% | 18.4% |
| SE8 (Deptford) | 7.3% | 17.0% | 31.1% | 41.8% |
| SE28 (Thamesmead) | 9.3% | 23.6% | 30.0% | 33.2% |
| SE18 (Woolwich) | 16.0% | 22.7% | 29.5% | 30.0% |
| SE3 (Blackheath) | 24.6% | 28.6% | 26.1% | 18.6% |
| SE7 (Charlton) | 16.8% | 25.0% | 21.4% | 36.0% |
| SE2 (Abbey Wood) | 22.8% | 24.4% | 20.1% | 31.9% |
| SE9 (Eltham) | 29.5% | 32.9% | 14.3% | 22.2% |
| DA15 (Sidcup) | 40.0% | 40.9% | 13.4% | 4.7% |
| DA16 (Welling) | 37.9% | 41.0% | 13.3% | 6.8% |
SE10 (Greenwich town) has the largest private rented sector in the borough at 45.2%, nearly half of all households, a depth that matches its flat-heavy stock and central-commute appeal. SE8 (Deptford), SE28 (Thamesmead) and SE18 (Woolwich) all sit around 30%, the riverside and regeneration postcodes where renting is the norm rather than the exception. A large existing rented sector points to an active lettings market and a wide pool of tenants already in place.
The southern house markets tell the opposite story. DA15 (Sidcup) and DA16 (Welling) both sit at around 13% private rented, with owner-occupation above 80%, the settled suburban districts where families buy and stay. SE9 (Eltham) at 14.3% is similar. These are thinner lettings markets, which is consistent with their lower yields and faster sales.
Across the borough the rental market currently favours landlords. In the postcodes with enough live listings to read, homes are letting in well under two months: about 37 days in SE8 (Deptford), 49 in SE10 (Greenwich town) and 52 in SE18 (Woolwich), with the for-rent stock turning over fast. That points to demand running ahead of available supply rather than a glut, the mirror image of the slower sales market in the same flat-heavy postcodes.
Local Housing Allowance Rates in Greenwich
Greenwich straddles two Broad Rental Market Areas: SE3, SE8 and SE10 fall in the higher Inner South East London BRMA, while the other seven postcodes sit in the Outer South East London BRMA. Local Housing Allowance sets the maximum housing support a tenant on benefits can receive, so for that part of the market it acts as a rent floor. Because the borough spans two areas, the rate a benefit-backed tenancy can command depends on which postcode you are in. The rates below apply as of June 2026. To check the current rate for a specific address, use the government's official Local Housing Allowance calculator.
| Property Size | Inner BRMA (SE3, SE8, SE10) Weekly | Outer BRMA (all other postcodes) Weekly |
|---|---|---|
| Shared accommodation | £149.59 | £138.08 |
| 1 bedroom | £298.15 | £241.64 |
| 2 bedrooms | £356.71 | £299.18 |
| 3 bedrooms | £448.77 | £356.71 |
| 4 bedrooms | £604.11 | £414.25 |
The two-bedroom rate is £356.71 a week in the Inner BRMA (about £1,546 a month) and £299.18 a week in the Outer BRMA (about £1,296 a month). Both sit well below Greenwich's £1,737 to £2,285 open-market rents, so a benefit-backed tenancy lets at a discount to the open market in either area. The gap matters most in the riverside Inner-BRMA postcodes, where the higher LHA rate still falls short of the SE10 and SE8 market rents, and a landlord choosing to let to that part of the market trades headline rent for the security of a state-underpinned floor.
Buy-to-Let Considerations
Are House Prices High in Greenwich? Price-to-Earnings Ratios
Buying a property in Greenwich takes between 7.8 and 12.0 times the median annual salary. This is based on the Nomis Labour Market Profile for Greenwich showing the median gross annual income for residents is £45,274. Every postcode sits above the national benchmark, which is what you would expect for a London borough.
The national benchmark for price-to-earnings is 7.4x (England's average sold price of £289,946 divided by the Great Britain median annual salary of £39,125). No Greenwich postcode falls below that line, though SE28 (Thamesmead) comes closest at 7.8x, the most affordable entry point in the borough relative to local incomes.
| Rank | Area | Price-to-Earnings Ratio |
|---|---|---|
| 1 | SE28 (Thamesmead) | 7.8x |
| 2 | SE2 (Abbey Wood) | 9.5x |
| 3 | SE8 (Deptford) | 9.5x |
| 4 | SE18 (Woolwich) | 9.6x |
| 5 | DA16 (Welling) | 10.3x |
| 6 | SE7 (Charlton) | 10.4x |
| 7 | SE9 (Eltham) | 10.8x |
| 8 | DA15 (Sidcup) | 11.2x |
| 9 | SE10 (Greenwich town) | 11.6x |
| 10 | SE3 (Blackheath) | 12.0x |
SE28 at 7.8x is the closest Greenwich gets to the national benchmark, and the regeneration-corridor entry point: a London postcode at under eight times local earnings, with the confirmed DLR extension behind it. The riverside cluster of SE2, SE8 and SE18 all sit between 9.5x and 9.6x, the affordable end of the borough by income.
SE3 (Blackheath) at 12.0x and SE10 (Greenwich town) at 11.6x sit at the top. At more than eleven times the local median salary, these are firmly owner-occupier markets, bought by households trading across London or up from elsewhere, not by local first-time buyers. For an investor the elevated ratio compresses the yield, which is exactly what the rental table shows.
Deposit Requirements in Greenwich
A 30% deposit on a buy-to-let property in Greenwich ranges from £106,109 in SE28 (Thamesmead) to £163,150 in SE3 (Blackheath). The gap between the cheapest and dearest deposit is £57,041, roughly half a second SE28 deposit. These are firmly London-scale figures, well above most of the country, and the spread tracks the asking-price hierarchy across the borough.
Beyond the deposit, the stamp duty land tax calculator and the costs of buy to let affect the total capital required.
| Rank | Area | 30% Deposit Required |
|---|---|---|
| 1 | SE28 (Thamesmead) | £106,109 |
| 2 | SE8 (Deptford) | £128,592 |
| 3 | SE2 (Abbey Wood) | £129,061 |
| 4 | SE18 (Woolwich) | £130,184 |
| 5 | DA16 (Welling) | £140,393 |
| 6 | SE7 (Charlton) | £140,855 |
| 7 | SE9 (Eltham) | £146,557 |
| 8 | DA15 (Sidcup) | £151,480 |
| 9 | SE10 (Greenwich town) | £157,232 |
| 10 | SE3 (Blackheath) | £163,150 |
SE28 (Thamesmead) is the cheapest way into Greenwich at a £106,109 deposit, and it buys the highest yield in the borough. Stepping up to SE8 (Deptford) costs around £22,000 more and buys the second-highest yield in a flat-dominated market closer to central London. The four cheapest deposits, SE28, SE8, SE2 and SE18, are all under £131,000 and all riverside or near-river postcodes.
At the top, SE3 (Blackheath) and SE10 (Greenwich town) need £163,150 and £157,232, the premium house-and-heritage markets where the deposit buys capital quality and a slower-moving asset rather than a high income return. The extra £50,000-plus of deposit between SE28 and SE3 buys a different borough, not just a bigger number.

What the Greenwich Data Tells Buy-to-Let Investors
In Greenwich the cheapest way in is also the highest-yielding postcode, and it sits on the regeneration corridor. SE28 (Thamesmead) has the top yield at 6.3%, the lowest asking price for buying an investment property at £353,697, and the most affordable prices against local earnings at 7.8 times income. A 30% deposit there is £106,109, the lowest in the borough, for a home renting at £1,868 a month, with a confirmed DLR extension behind it.
The borough splits cleanly in two. The riverside and regeneration postcodes, SE28, SE8, SE18 and SE2, carry the higher yields, the larger private rented sectors and the flat-heavy stock that suits letting, but also the slower sales and the heavier new-build supply. The southern house markets, DA15, DA16, SE9 and SE3, carry the lower yields, the faster sales and the settled owner-occupier base. SE2 (Abbey Wood) is the standout for capital growth at 24.9% over five years, driven by its Elizabeth-line station, the one postcode that pairs a riverside-corridor location with house-market growth.
SE3 (Blackheath) and SE10 (Greenwich town) sit at the premium end, with the highest prices, the highest price-per-square-foot, and yields at the bottom of the table, where the premium does more for capital value than income. Buyers who want to come in below asking often work the off-market property sales route, which tends to matter most in the slower-selling riverside postcodes where there is room to negotiate.
Greenwich reads differently from the higher-yielding markets outside London: lower headline yields than the North or the Midlands, but a deep tenant pool, London-level rents, and a regeneration pipeline along the river that few boroughs can match. The income return is concentrated in the Thames-side flats, the capital quality in the southern houses, and the data lets an investor pick which of those they are buying for.
How Greenwich Compares
Greenwich's mean asking price of £464,537 sits in the middle of five south-east London boroughs compared here, while its top yield of 6.3% is matched only by neighbouring Bexley. The comparison below places Greenwich alongside four nearby boroughs, each with a different investor profile. The mean asking price and mean monthly rent are simple averages across all postcodes with data. Top gross yield is the single highest postcode yield in each location.
| Location | Mean Asking Price | Mean Monthly Rent | Mean Gross Yield | Top Yield (postcode) |
|---|---|---|---|---|
| Bexley | £428,037 | £1,762 | 4.9% | 6.3% (SE28) |
| Greenwich | £464,537 | £2,045 | 5.3% | 6.3% (SE28) |
| Croydon | £466,187 | £1,771 | 4.6% | 5.4% (SE20) |
| Lewisham | £490,640 | £1,965 | 4.8% | 6.0% (SE8) |
| Bromley | £544,449 | £1,830 | 4.0% | 5.4% (SE20) |
Greenwich carries the highest mean rent in this group at £2,045, ahead of Lewisham at £1,965 and well above Bexley at £1,762, a reflection of its riverside, central-commute positioning. On yield it shares the top of the table with Bexley at 6.3%, where both lean on a cheaper outer postcode to lead the income return.
For investors prioritising the lowest entry, Bexley at £428,037 mean asking is the most affordable in the group, while Bromley at £544,449 is the most expensive, a leafier, lower-yielding outer borough. Croydon sits close to Greenwich on price but trails on both rent and yield. For an investor weighing Greenwich against its neighbours, the choice comes down to whether the regeneration corridor and the higher rents justify the premium over Bexley, or whether a cheaper entry next door does the job. For a data-driven comparison across all UK locations, see our best buy-to-let areas guide.
Frequently Asked Questions
Is Greenwich a good place to invest in buy-to-let?
For income in a London borough, Greenwich stacks up well. Greenwich pairs a sub-central asking price, the cheapest postcode is £353,697 against a London average of £542,065, with London-level rents that run from £1,737 to £2,285 a month. Top yields reach 6.3% in SE28 (Thamesmead), which is high for the capital.
The catch is that the income and the capital growth sit in different places. The riverside postcodes give you the yield but slower sales and flat-heavy new-build supply; the southern house markets give you steadier values but lower yields. Greenwich works if you go in knowing which of those you are buying for.
What are the best areas in Greenwich for property investment?
For yield, the answer is the regeneration corridor along the river. SE28 (Thamesmead) leads at 6.3% on the borough's lowest asking price, with a confirmed DLR extension behind it, and SE8 (Deptford) follows at 6.0%. SE18 (Woolwich) and SE2 (Abbey Wood) both sit at 5.7%, the latter also posting the borough's strongest five-year capital growth at 24.9% off the back of its Elizabeth-line station.
For capital quality over income, the southern house markets, SE3 (Blackheath), SE9 (Eltham) and DA15 (Sidcup), hold their value and sell faster, but yields there sit between 4.1% and 4.9%. So income points you north to the river, growth-with-stability points you south.
What are average house prices in Greenwich?
The average sold price across the Royal Borough of Greenwich is £465,960 on the Land Registry index, about 60.7% above the England average of £289,946 but 14.0% below the London average of £542,065, as of March 2026. Asking prices by postcode run from £353,697 in SE28 (Thamesmead) up to £543,833 in SE3 (Blackheath), with a borough-wide mean of £464,537. By type, detached homes average £1,013,656, semi-detached £712,935, terraced £549,337 and flats £355,080.
Through a buy-to-let lens, SE28 is the cheapest entry and the highest-yielding at 6.3%, while DA15 is among the dearest and lowest-yielding at 4.1%.
Can I find buy-to-let property under £400,000 in Greenwich?
On average, only in SE28 (Thamesmead), where the typical asking price is £353,697, the one Greenwich postcode below £400,000. Everywhere else the borough average sits between £428,000 and £544,000, so SE28 is the clear sub-£400,000 entry point and, conveniently, the highest-yielding one.
The other route below £400,000 is by property type rather than postcode: flats average £355,080 across the borough on the Land Registry index, well under the all-property figure, so apartment stock in the cheaper flat-heavy postcodes, SE8 (Deptford), SE18 (Woolwich) and SE2 (Abbey Wood), is where to look. You can also explore below market value property.
What type of property is most common in Greenwich?
It varies sharply by postcode. Along the river, flats dominate: 78.7% of stock in SE8 (Deptford) and 75.2% in SE10 (Greenwich town), the apartment-heavy districts that drive the rental market. In the south it flips to houses, with semi-detached homes at 65.9% of stock in DA16 (Welling) and 48.5% in DA15 (Sidcup).
For buy-to-let that distinction matters: the flat postcodes suit single lets and sharers commuting into central London, while the southern house postcodes suit family tenancies. New-build flats are concentrated in the SE10, SE8 and SE18 regeneration corridor.
How will the Thamesmead DLR extension affect Greenwich property?
It is the borough's biggest long-term driver, but it is a multi-year story rather than an immediate one. Government support for extending the Docklands Light Railway across the river to Thamesmead was confirmed in 2025, which is the strongest signal the project has had, but construction and an opening date are still some way off.
SE28 (Thamesmead) already leads the borough on yield at 6.3% and sits at the cheapest asking price, so the rail link is upside on top of an already-working income case rather than the whole reason to buy. Abbey Wood's experience next door, where the Elizabeth line drove 24.9% five-year growth in SE2, shows what a committed rail link can do to a south-east London postcode over time.
Is there demand for rental property in Greenwich?
Yes, and in the postcodes with enough listings to read it currently favours landlords. Homes are letting fast, around 37 days in SE8 (Deptford), 49 in SE10 (Greenwich town) and 52 in SE18 (Woolwich), with for-rent stock turning over quickly, a sign of demand running ahead of supply.
That demand is underpinned by the borough's structure: a population up 13.56% over the last census decade, a private rented sector reaching 45.2% of households in SE10, and a tenant base of central-London workers priced out of zones one and two. The southern house postcodes are thinner lettings markets, but the riverside is genuinely deep.
How do I buy an investment property in Greenwich?
Decide first whether you are buying for income or for capital quality, because in Greenwich those point to opposite ends of the borough. SE28 (Thamesmead) is the cheapest entry at £353,697 and the highest-yielding at 6.3%; SE2 (Abbey Wood) pairs a 5.7% yield with the borough's strongest five-year growth at 24.9%. At 30% down you need £106,109 in SE28 rising to £163,150 in SE3 (Blackheath), depending on the postcode.
Beyond what is listed openly, plenty of experienced investors buy below asking through off market property channels, which matters most in the slower-selling riverside postcodes. To see what is available now, browse investment properties or buy-to-let homes for sale.
Ready to buy property?
Access off-market investment properties with an average 8%+ annual gross yield (beating the UK's typical 3-5%).
Get property alerts