
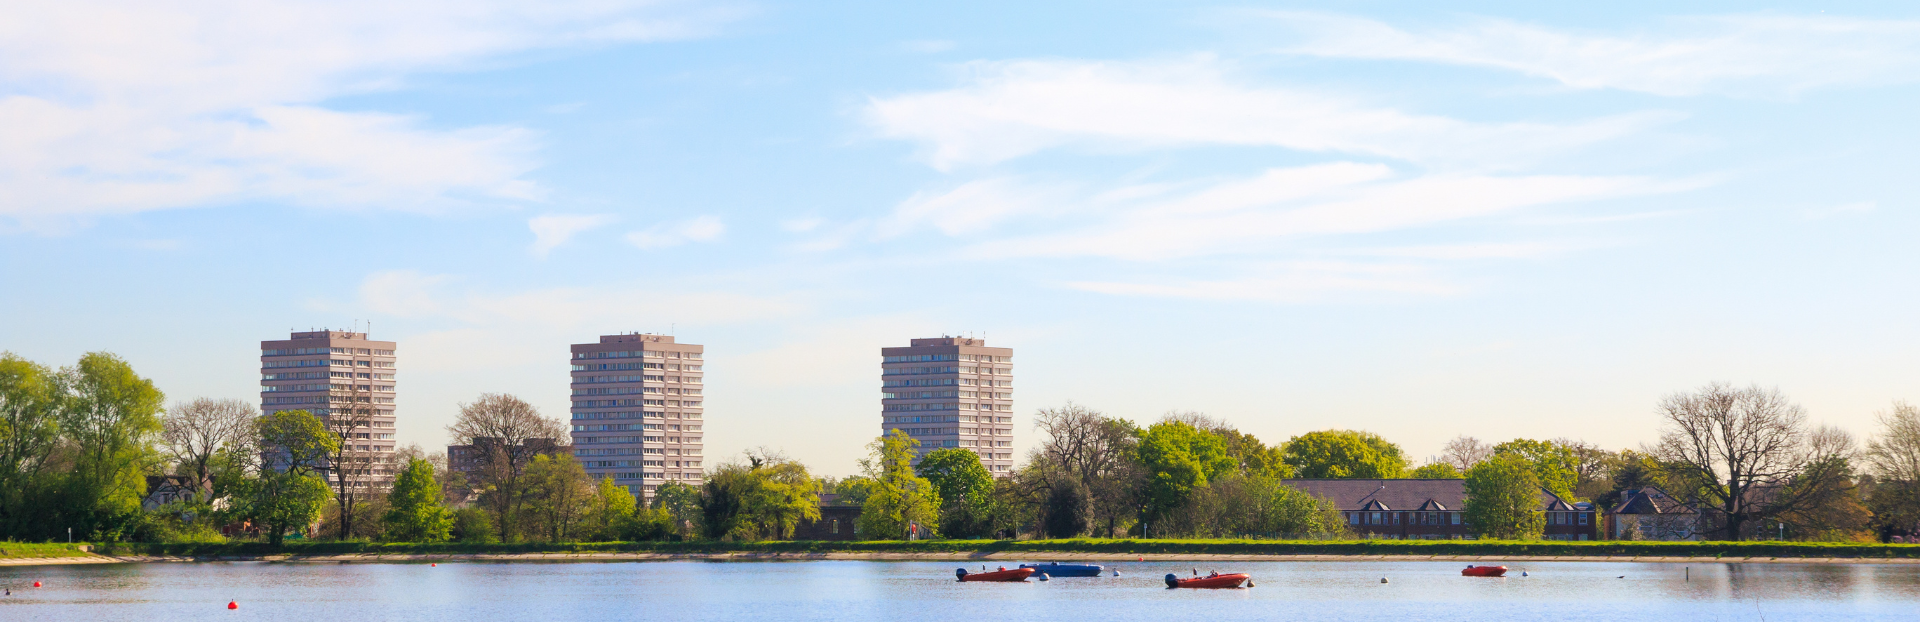
Hackney is a borough of inner east London. Average sold prices in Hackney sit at £611,039 on the HM Land Registry House Price Index, 110.7% above the England average of £289,946 and 12.7% above the London average of £542,065. That places Hackney firmly in inner London's premium band, dearer than its East London neighbours but with the highest mean rent of the boroughs it sits among. The local authority's population grew 5.23% between the 2011 and 2021 censuses, from 246,270 to 259,146 residents.
What sets Hackney apart for an investor is the spread inside one borough. Asking prices run from £473,888 in N15 on the northern fringe to £1,072,970 in EC2 on the City edge, and the yield order does not follow the price order. E1 (Whitechapel, Shoreditch) tops the borough at 5.7% on a £595,874 asking price, while the dearest postcodes, EC2 and N16, sit at the bottom at 4.1%. The investment case in Hackney is rarely about the headline price; it is about which of the eleven postcodes pairs a workable entry cost with a rent the local market will actually pay.
This guide covers all eleven postcodes under the London Borough of Hackney (ONS code E09000012), bordered by Islington to the west, Haringey to the north, Waltham Forest and Newham to the east, and Tower Hamlets to the south. Some postcodes cross borough boundaries: N1 extends into Islington, N15 is primarily in Haringey, and N4 straddles Hackney, Haringey, and Islington. The area-level figures here are for the Hackney local authority. For the wider picture, see our London buy-to-let guide.
Article updated: July 2026
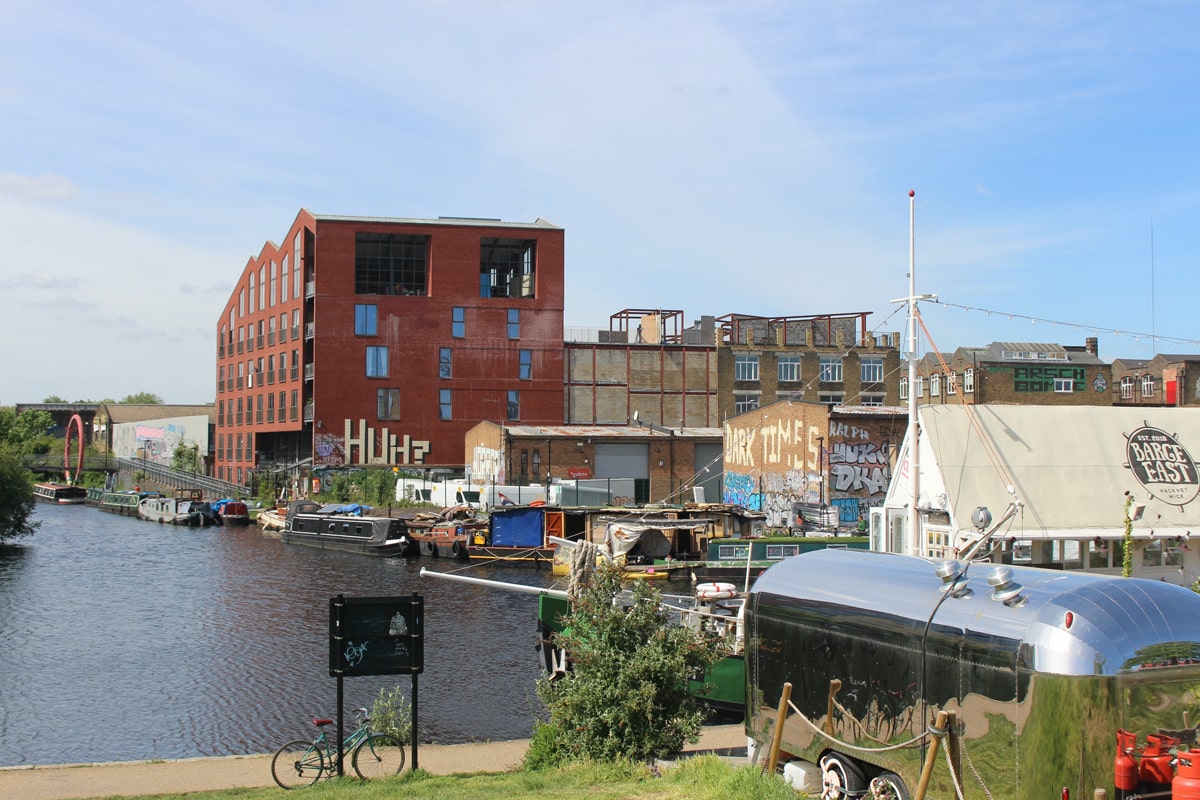
Why Invest in Hackney?
Hackney's population reached 259,146 at the 2021 Census, a 5.23% increase on the 246,270 recorded in 2011. The borough covers inner East London and runs from the City-fringe creative quarter around Shoreditch up through the established residential streets of Stoke Newington and Clapton to the reservoirs at Woodberry Down. It is one of the most rapidly changed parts of the capital, and the rental market reflects that, with a tenant base of young professionals, sharers and key workers.
Median gross annual earnings in Hackney are £49,482, which is 6.6% above the London median of £46,415 and 26.5% above the Great Britain median of £39,125. The employment rate is 79.0% and unemployment runs at 4.5%. Local residents earning above the London median is a useful signal for a landlord: it points to genuine ability to pay rent without leaning entirely on the City and tech salaries that dominate the southern postcodes. Higher local wages mean tenants can absorb the rents Hackney commands.
Connectivity is a draw across the borough. Manor House Underground station on the Piccadilly line straddles the Hackney and Haringey boundary, and the London Overground threads through fourteen stations including Hackney Central, Dalston Junction, Hackney Wick, London Fields and Shoreditch High Street, giving most of the borough a fast route into the City and Liverpool Street. Homerton University Hospital, run by Homerton Healthcare NHS Foundation Trust, is the main hospital and a steady source of key-worker tenant demand in E9.
Hackney Economic Summary
- Population: 259,146 (2021 Census). Growth of 5.23% from 2011.
- Median annual salary: £49,482 (local), £46,415 (London), £39,125 (Great Britain)
- Employment rate: 79.0% (local)
- Unemployment rate: 4.5% (local)
Source: ONS Census 2021, Nomis Labour Market Profile (ASHE 2025)
Regeneration and Investment in Hackney
Three programmes delivering more than 7,000 new homes are reshaping different corners of Hackney, from the Woodberry Down reservoirs in the north to the Olympic Park fringe in the east. Each one concentrates new rental stock and amenity in a specific postcode, so the regeneration story is local rather than borough-wide.
- Woodberry Down Estate Regeneration (in progress, 5,500+ homes): One of Europe's largest single-site estate regeneration schemes is delivering more than 5,500 new homes around Manor House (N4) through a partnership between Hackney Council, Berkeley Homes and Notting Hill Genesis. Over 2,000 homes have been built since construction began in 2009, with at least 41% social rent or shared ownership, alongside the restored Woodberry Wetlands nature reserve. Updates at Hackney Council.
- Hackney Central Town Centre (in progress, £19m+ Levelling Up Fund): A £19 million government investment is funding the regeneration of Hackney Central in E8, including the 55 Morning Lane development on the former Tesco site and the redesign of Town Hall Square. The work concentrates new homes and public space around the borough's busiest Overground interchange. Updates at Hackney Council.
- Hackney Wick and Olympic Park Fringe (in progress, 1,500 homes): The East Wick and Sweetwater scheme is delivering 1,500 new homes, including 450 affordable units, on the Olympic Park fringe in E9, alongside the Hackney Wick Creative Enterprise Zone first established in 2018. Hackney Council took on planning authority for the area from the London Legacy Development Corporation in December 2024. Updates at Hackney Council.
Source: Office for National Statistics - Population for Hackney
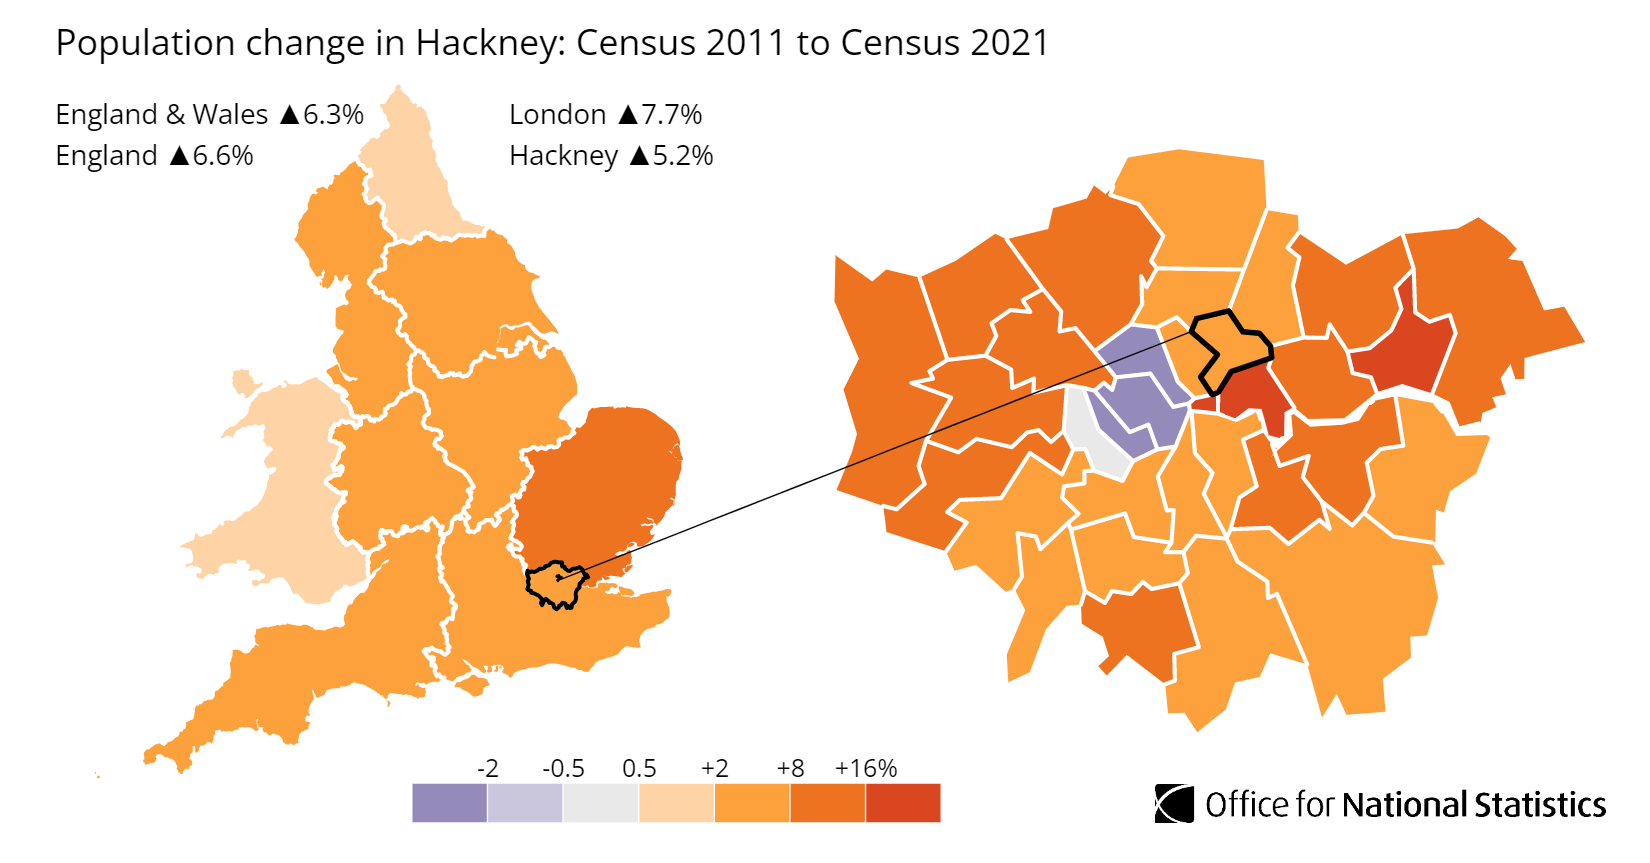
Hackney Property Market Analysis
Average property prices in Hackney have risen 864.2% since January 1995, from £63,375 to £611,039. The sections below trace that journey cycle by cycle, then break down the current postcode-level data for sold prices, price per square foot, asking prices, growth, transaction volumes, and how long homes take to sell.
When was the last house price crash in Hackney?
Hackney is its own local authority, so HM Land Registry records sold prices directly at borough level. The House Price Index runs from January 1995 to March 2026, covering 31 years of market cycles.
The 1995 to 2008 climb: Hackney started at £63,375 in January 1995 and reached £276,286 by January 2007. The final eighteen months of the cycle were the steepest, with the average pushing to a pre-crash peak of £343,353 in June 2008, a 24.3% jump in a year and a half driven by easy credit and intense demand across inner London.
2008 to 2009, the financial crisis: Hackney's crash was one of the sharpest in London. Prices fell 24.2% from the June 2008 peak of £343,353 to a trough of £260,137 in June 2009, a loss of £83,216 in twelve months. The worst annual reading was -24.2% in June 2009, deeper than the England fall of 18.2% over the same crisis. Borrowing-heavy markets corrected hardest, and Hackney's first-time-buyer and investor demand had been built on the credit that vanished.
Recovery, 2009 to 2012: The bounce was fast. By July 2009 the average had already recovered to £280,330, and Hackney regained its pre-crash peak in August 2012 at £344,295, a little over three years from the trough. That is a much quicker return than many parts of England managed.
Acceleration, 2013 to 2016: Hackney's fastest sustained run. Prices climbed from £344,295 through to £565,035 by January 2016 as the borough repriced from a recovering market into one of inner London's most sought-after. Most of Hackney's 30-year return was earned in this window.
Plateau and pandemic, 2017 to 2022: Growth flattened from 2017 as stamp duty surcharges took effect, then the pandemic gave it a final lift, with the average reaching £608,364 by December 2022. Unlike many markets, Hackney's surge was modest against the run it had already had.
2023 to present: Prices reached an all-time high of £638,941 in November 2023, then eased back as higher mortgage rates bit. The latest Land Registry reading is £611,039 in March 2026, down 1.2% on the year and about 4.4% below that 2023 high. The current price is 78.0% above the pre-crash peak of £343,353.
Long-term growth summary:
- 5 years (March 2021 to March 2026): +3.6% (£590,061 to £611,039)
- 10 years (March 2016 to March 2026): +4.3% (£585,671 to £611,039)
- 15 years (March 2011 to March 2026): +100.7% (£304,410 to £611,039)
- 20 years (March 2006 to March 2026): +147.3% (£247,129 to £611,039)
- 30 years (March 1996 to March 2026): +772.9% (£70,003 to £611,039)
Hackney's five-year growth of 3.6% is modest against a 30-year return of 772.9%, and that gap tells the real story. The borough's transformation into one of London's most desirable was largely priced in by 2016, and the last decade has added just 4.3%. An investor buying Hackney now is buying an established, high-value market where rental income carries more weight than capital appreciation in the near term, and where the spread between postcodes matters more than the borough trend.
- All property types
- Detached
- Semi-detached
- Terraced
- Flats
Source: HM Land Registry House Price Index
| Year | All property types | Detached | Semi-detached | Terraced | Flats |
|---|---|---|---|---|---|
| 1995-01 | £63,375 | £131,507 | £102,628 | £81,113 | £58,769 |
| 1995-02 | £65,330 | £133,739 | £105,756 | £83,778 | £60,412 |
| 1995-03 | £65,750 | £134,319 | £106,143 | £84,290 | £60,862 |
| 1995-04 | £67,349 | £136,551 | £108,516 | £86,355 | £62,355 |
| 1995-05 | £68,439 | £139,145 | £110,778 | £87,737 | £63,332 |
| 1995-06 | £69,191 | £140,607 | £112,375 | £88,552 | £64,171 |
| 1995-07 | £70,710 | £144,287 | £115,262 | £90,727 | £65,264 |
| 1995-08 | £70,406 | £144,454 | £114,610 | £90,483 | £64,818 |
| 1995-09 | £71,084 | £146,264 | £116,020 | £91,611 | £65,105 |
| 1995-10 | £69,913 | £144,066 | £114,620 | £89,776 | £64,368 |
| 1995-11 | £69,518 | £142,576 | £113,996 | £88,895 | £64,451 |
| 1995-12 | £68,098 | £139,422 | £111,674 | £86,885 | £63,368 |
| 1996-01 | £68,577 | £140,571 | £111,991 | £87,547 | £63,791 |
| 1996-02 | £69,260 | £141,827 | £113,299 | £88,488 | £64,322 |
| 1996-03 | £70,003 | £144,183 | £115,021 | £89,488 | £64,898 |
| 1996-04 | £69,336 | £141,194 | £113,783 | £88,505 | £64,449 |
| 1996-05 | £69,258 | £141,591 | £113,510 | £88,661 | £64,111 |
| 1996-06 | £71,468 | £145,924 | £116,655 | £91,507 | £66,186 |
| 1996-07 | £73,185 | £151,013 | £119,936 | £94,034 | £67,363 |
| 1996-08 | £74,224 | £153,575 | £121,921 | £95,512 | £68,136 |
| 1996-09 | £74,253 | £153,131 | £121,767 | £95,632 | £68,098 |
| 1996-10 | £73,571 | £152,143 | £120,838 | £94,723 | £67,486 |
| 1996-11 | £73,501 | £151,358 | £120,632 | £94,547 | £67,525 |
| 1996-12 | £72,516 | £149,059 | £119,370 | £93,310 | £66,556 |
| 1997-01 | £72,256 | £147,635 | £118,667 | £93,179 | £66,137 |
| 1997-02 | £72,897 | £149,227 | £119,740 | £93,781 | £66,817 |
| 1997-03 | £74,659 | £152,830 | £122,308 | £96,147 | £68,292 |
| 1997-04 | £78,589 | £160,895 | £129,198 | £101,223 | £71,854 |
| 1997-05 | £82,199 | £167,972 | £135,525 | £106,262 | £74,906 |
| 1997-06 | £83,084 | £170,854 | £137,758 | £107,740 | £75,470 |
| 1997-07 | £83,313 | £172,171 | £138,404 | £108,358 | £75,471 |
| 1997-08 | £83,002 | £172,354 | £138,176 | £108,051 | £75,113 |
| 1997-09 | £85,086 | £176,290 | £141,839 | £110,701 | £77,028 |
| 1997-10 | £84,911 | £175,975 | £141,487 | £110,278 | £76,986 |
| 1997-11 | £85,954 | £178,332 | £143,327 | £111,618 | £77,933 |
| 1997-12 | £83,985 | £174,438 | £140,019 | £108,929 | £76,225 |
| 1998-01 | £86,348 | £179,203 | £143,763 | £112,264 | £78,223 |
| 1998-02 | £85,212 | £175,530 | £141,023 | £110,437 | £77,376 |
| 1998-03 | £87,060 | £180,445 | £144,277 | £112,816 | £79,008 |
| 1998-04 | £85,996 | £178,530 | £143,489 | £111,422 | £78,005 |
| 1998-05 | £89,509 | £186,449 | £150,087 | £116,505 | £80,909 |
| 1998-06 | £90,132 | £186,524 | £150,709 | £117,337 | £81,486 |
| 1998-07 | £94,655 | £195,979 | £158,190 | £123,501 | £85,452 |
| 1998-08 | £92,629 | £192,927 | £155,109 | £120,966 | £83,556 |
| 1998-09 | £95,271 | £198,931 | £160,118 | £124,791 | £85,739 |
| 1998-10 | £91,628 | £191,097 | £153,046 | £119,316 | £82,827 |
| 1998-11 | £94,723 | £198,219 | £158,186 | £122,685 | £85,930 |
| 1998-12 | £97,030 | £202,682 | £161,852 | £125,048 | £88,321 |
| 1999-01 | £102,863 | £214,866 | £172,016 | £132,705 | £93,545 |
| 1999-02 | £102,332 | £212,699 | £170,901 | £132,273 | £92,957 |
| 1999-03 | £101,832 | £211,283 | £169,415 | £131,534 | £92,556 |
| 1999-04 | £101,758 | £210,191 | £168,803 | £131,829 | £92,369 |
| 1999-05 | £103,428 | £212,794 | £171,291 | £133,992 | £93,905 |
| 1999-06 | £106,184 | £218,942 | £176,148 | £138,182 | £96,150 |
| 1999-07 | £107,855 | £224,366 | £179,431 | £140,771 | £97,469 |
| 1999-08 | £112,233 | £234,509 | £186,900 | £147,193 | £101,141 |
| 1999-09 | £114,151 | £239,761 | £190,037 | £149,645 | £102,888 |
| 1999-10 | £116,215 | £243,244 | £192,964 | £151,317 | £105,173 |
| 1999-11 | £118,664 | £247,903 | £196,788 | £153,966 | £107,609 |
| 1999-12 | £121,827 | £251,633 | £201,019 | £157,444 | £110,788 |
| 2000-01 | £125,243 | £260,464 | £207,769 | £162,556 | £113,561 |
| 2000-02 | £126,428 | £263,567 | £209,466 | £164,130 | £114,595 |
| 2000-03 | £125,472 | £263,773 | £209,062 | £163,702 | £113,327 |
| 2000-04 | £127,344 | £264,209 | £211,034 | £165,893 | £115,148 |
| 2000-05 | £132,250 | £272,599 | £219,040 | £172,116 | £119,647 |
| 2000-06 | £139,773 | £285,642 | £230,592 | £181,241 | £126,704 |
| 2000-07 | £143,620 | £297,144 | £238,040 | £186,394 | £130,088 |
| 2000-08 | £147,135 | £304,592 | £243,484 | £190,186 | £133,531 |
| 2000-09 | £147,457 | £308,704 | £244,177 | £190,243 | £133,923 |
| 2000-10 | £145,901 | £303,568 | £240,828 | £187,289 | £132,844 |
| 2000-11 | £143,732 | £299,695 | £237,202 | £184,062 | £131,011 |
| 2000-12 | £142,388 | £293,325 | £234,294 | £181,705 | £130,029 |
| 2001-01 | £143,819 | £295,894 | £235,378 | £183,636 | £131,348 |
| 2001-02 | £146,366 | £300,626 | £239,008 | £187,112 | £133,629 |
| 2001-03 | £152,255 | £314,564 | £249,231 | £195,271 | £138,782 |
| 2001-04 | £155,430 | £321,851 | £254,458 | £199,340 | £141,673 |
| 2001-05 | £158,489 | £328,090 | £259,553 | £203,468 | £144,391 |
| 2001-06 | £160,132 | £327,968 | £260,552 | £204,777 | £146,210 |
| 2001-07 | £161,031 | £328,197 | £262,335 | £206,161 | £146,951 |
| 2001-08 | £162,877 | £330,789 | £264,640 | £208,302 | £148,731 |
| 2001-09 | £162,664 | £333,253 | £264,412 | £208,029 | £148,523 |
| 2001-10 | £165,702 | £339,515 | £268,967 | £211,101 | £151,583 |
| 2001-11 | £166,156 | £340,929 | £269,657 | £210,844 | £152,288 |
| 2001-12 | £168,382 | £341,777 | £271,741 | £212,258 | £154,870 |
| 2002-01 | £170,603 | £345,475 | £274,337 | £214,084 | £157,276 |
| 2002-02 | £170,258 | £343,104 | £272,566 | £213,483 | £157,048 |
| 2002-03 | £173,064 | £348,163 | £277,817 | £217,408 | £159,478 |
| 2002-04 | £170,731 | £339,866 | £272,771 | £213,848 | £157,592 |
| 2002-05 | £176,498 | £349,484 | £282,204 | £220,787 | £163,018 |
| 2002-06 | £180,868 | £354,317 | £287,085 | £225,929 | £167,229 |
| 2002-07 | £191,613 | £377,404 | £305,118 | £240,578 | £176,703 |
| 2002-08 | £195,911 | £386,147 | £311,410 | £245,907 | £180,701 |
| 2002-09 | £200,663 | £399,593 | £320,819 | £252,544 | £184,790 |
| 2002-10 | £200,994 | £399,457 | £321,115 | £251,976 | £185,449 |
| 2002-11 | £203,471 | £405,917 | £324,578 | £254,441 | £187,967 |
| 2002-12 | £201,921 | £401,146 | £321,216 | £251,395 | £186,956 |
| 2003-01 | £204,134 | £403,655 | £323,337 | £254,507 | £188,916 |
| 2003-02 | £207,125 | £405,763 | £328,264 | £257,760 | £191,864 |
| 2003-03 | £206,909 | £402,496 | £326,854 | £257,440 | £191,717 |
| 2003-04 | £204,228 | £393,743 | £322,712 | £253,283 | £189,536 |
| 2003-05 | £206,305 | £395,255 | £325,956 | £257,117 | £191,025 |
| 2003-06 | £207,485 | £397,641 | £328,079 | £258,418 | £192,172 |
| 2003-07 | £213,538 | £410,161 | £338,682 | £266,762 | £197,466 |
| 2003-08 | £209,098 | £401,282 | £331,770 | £261,252 | £193,346 |
| 2003-09 | £209,276 | £402,150 | £333,395 | £263,117 | £192,896 |
| 2003-10 | £207,063 | £397,103 | £328,725 | £260,161 | £190,945 |
| 2003-11 | £209,861 | £403,417 | £333,081 | £263,232 | £193,681 |
| 2003-12 | £209,661 | £399,164 | £331,239 | £261,926 | £193,918 |
| 2004-01 | £215,038 | £409,304 | £340,832 | £269,001 | £198,741 |
| 2004-02 | £213,828 | £403,677 | £339,268 | £268,010 | £197,441 |
| 2004-03 | £222,938 | £421,488 | £354,219 | £279,975 | £205,617 |
| 2004-04 | £220,834 | £414,024 | £350,828 | £278,118 | £203,477 |
| 2004-05 | £221,841 | £413,082 | £351,276 | £279,565 | £204,384 |
| 2004-06 | £218,033 | £402,500 | £344,694 | £274,859 | £200,870 |
| 2004-07 | £219,853 | £406,536 | £348,339 | £277,751 | £202,373 |
| 2004-08 | £226,443 | £420,575 | £359,389 | £286,402 | £208,336 |
| 2004-09 | £229,652 | £429,290 | £365,669 | £291,207 | £211,059 |
| 2004-10 | £234,686 | £437,268 | £370,507 | £296,225 | £216,108 |
| 2004-11 | £238,488 | £442,467 | £374,251 | £300,434 | £219,811 |
| 2004-12 | £239,072 | £439,106 | £371,247 | £300,132 | £220,709 |
| 2005-01 | £238,369 | £437,590 | £369,869 | £299,776 | £219,923 |
| 2005-02 | £236,941 | £433,465 | £368,805 | £298,769 | £218,383 |
| 2005-03 | £236,444 | £434,728 | £369,946 | £298,943 | £217,667 |
| 2005-04 | £234,262 | £429,207 | £367,091 | £296,456 | £215,587 |
| 2005-05 | £229,216 | £421,288 | £358,060 | £289,811 | £211,025 |
| 2005-06 | £227,454 | £416,726 | £355,258 | £288,459 | £209,194 |
| 2005-07 | £230,916 | £422,882 | £360,903 | £293,422 | £212,231 |
| 2005-08 | £235,686 | £432,350 | £368,507 | £300,158 | £216,441 |
| 2005-09 | £242,552 | £444,610 | £379,058 | £309,245 | £222,668 |
| 2005-10 | £238,055 | £435,101 | £370,796 | £303,259 | £218,635 |
| 2005-11 | £237,781 | £432,504 | £369,987 | £302,949 | £218,392 |
| 2005-12 | £240,326 | £434,393 | £372,057 | £305,183 | £221,032 |
| 2006-01 | £246,326 | £446,903 | £382,259 | £313,592 | £226,329 |
| 2006-02 | £248,408 | £449,094 | £385,486 | £316,218 | £228,225 |
| 2006-03 | £247,129 | £450,044 | £385,431 | £315,940 | £226,653 |
| 2006-04 | £250,156 | £455,614 | £391,048 | £319,916 | £229,394 |
| 2006-05 | £252,899 | £461,663 | £396,139 | £323,545 | £231,869 |
| 2006-06 | £261,096 | £473,369 | £408,736 | £333,864 | £239,431 |
| 2006-07 | £264,164 | £477,857 | £414,666 | £339,348 | £241,888 |
| 2006-08 | £270,680 | £491,045 | £426,056 | £349,612 | £247,415 |
| 2006-09 | £273,515 | £500,976 | £433,260 | £354,144 | £249,769 |
| 2006-10 | £276,924 | £507,151 | £436,725 | £357,293 | £253,186 |
| 2006-11 | £276,657 | £505,822 | £436,352 | £356,451 | £253,052 |
| 2006-12 | £274,161 | £498,844 | £431,261 | £353,353 | £250,763 |
| 2007-01 | £276,286 | £504,170 | £435,239 | £356,607 | £252,581 |
| 2007-02 | £280,159 | £510,896 | £439,263 | £360,152 | £256,426 |
| 2007-03 | £285,406 | £522,118 | £447,212 | £367,424 | £261,130 |
| 2007-04 | £285,799 | £521,451 | £448,138 | £369,294 | £261,234 |
| 2007-05 | £291,002 | £529,595 | £456,389 | £377,267 | £265,755 |
| 2007-06 | £291,737 | £528,731 | £456,813 | £377,982 | £266,487 |
| 2007-07 | £301,681 | £547,927 | £473,835 | £391,084 | £275,503 |
| 2007-08 | £311,812 | £571,633 | £493,239 | £406,567 | £284,249 |
| 2007-09 | £324,570 | £595,966 | £515,188 | £423,795 | £295,736 |
| 2007-10 | £322,717 | £593,508 | £508,653 | £419,744 | £294,411 |
| 2007-11 | £320,430 | £588,082 | £503,561 | £414,998 | £292,680 |
| 2007-12 | £311,338 | £571,652 | £487,242 | £401,882 | £284,661 |
| 2008-01 | £318,655 | £586,975 | £499,494 | £411,068 | £291,381 |
| 2008-02 | £317,203 | £587,488 | £497,081 | £409,193 | £290,075 |
| 2008-03 | £323,971 | £605,250 | £509,523 | £419,281 | £296,012 |
| 2008-04 | £326,905 | £615,505 | £516,008 | £424,834 | £298,385 |
| 2008-05 | £335,344 | £627,935 | £530,214 | £437,034 | £305,885 |
| 2008-06 | £343,353 | £639,300 | £543,340 | £448,192 | £313,075 |
| 2008-07 | £336,088 | £619,711 | £532,798 | £438,896 | £306,418 |
| 2008-08 | £329,744 | £609,640 | £523,666 | £431,048 | £300,552 |
| 2008-09 | £313,584 | £582,683 | £497,774 | £408,675 | £286,022 |
| 2008-10 | £309,739 | £576,495 | £490,825 | £402,046 | £282,782 |
| 2008-11 | £309,453 | £573,113 | £489,667 | £400,241 | £282,761 |
| 2008-12 | £304,083 | £561,401 | £481,218 | £394,552 | £277,654 |
| 2009-01 | £307,514 | £569,751 | £486,836 | £399,230 | £280,747 |
| 2009-02 | £294,056 | £543,378 | £466,032 | £381,744 | £268,462 |
| 2009-03 | £302,419 | £555,307 | £478,609 | £391,714 | £276,266 |
| 2009-04 | £276,768 | £501,956 | £437,745 | £359,456 | £252,698 |
| 2009-05 | £273,305 | £496,523 | £434,106 | £356,970 | £249,165 |
| 2009-06 | £260,137 | £473,966 | £415,852 | £342,141 | £236,712 |
| 2009-07 | £280,330 | £514,958 | £452,188 | £372,256 | £254,414 |
| 2009-08 | £286,783 | £529,127 | £464,398 | £383,801 | £259,747 |
| 2009-09 | £300,863 | £555,452 | £488,640 | £404,120 | £272,232 |
| 2009-10 | £304,195 | £563,424 | £496,155 | £409,126 | £275,116 |
| 2009-11 | £310,619 | £579,788 | £507,868 | £418,793 | £280,726 |
| 2009-12 | £304,758 | £570,536 | £500,254 | £411,932 | £275,219 |
| 2010-01 | £305,856 | £575,243 | £504,598 | £417,980 | £275,442 |
| 2010-02 | £308,574 | £582,914 | £512,815 | £424,653 | £277,369 |
| 2010-03 | £307,364 | £581,914 | £511,252 | £424,288 | £276,193 |
| 2010-04 | £308,192 | £582,634 | £512,658 | £424,064 | £277,209 |
| 2010-05 | £304,416 | £575,983 | £504,415 | £417,914 | £274,035 |
| 2010-06 | £315,870 | £599,516 | £525,658 | £435,723 | £283,877 |
| 2010-07 | £314,851 | £604,254 | £526,923 | £436,478 | £282,443 |
| 2010-08 | £318,460 | £612,862 | £537,715 | £443,708 | £285,143 |
| 2010-09 | £317,769 | £615,585 | £538,489 | £443,940 | £284,228 |
| 2010-10 | £314,906 | £607,618 | £532,845 | £438,978 | £281,883 |
| 2010-11 | £306,858 | £593,438 | £517,859 | £425,780 | £275,083 |
| 2010-12 | £305,060 | £589,676 | £514,961 | £422,746 | £273,574 |
| 2011-01 | £304,203 | £588,999 | £512,726 | £422,063 | £272,717 |
| 2011-02 | £310,751 | £601,289 | £522,139 | £430,869 | £278,691 |
| 2011-03 | £304,410 | £594,266 | £511,567 | £422,137 | £272,965 |
| 2011-04 | £314,568 | £616,083 | £528,047 | £435,425 | £282,234 |
| 2011-05 | £312,799 | £609,486 | £523,554 | £432,292 | £280,833 |
| 2011-06 | £315,292 | £608,398 | £526,746 | £434,878 | £283,299 |
| 2011-07 | £319,212 | £611,219 | £532,981 | £440,252 | £286,862 |
| 2011-08 | £322,981 | £623,609 | £545,204 | £449,348 | £289,324 |
| 2011-09 | £334,070 | £649,609 | £567,251 | £467,237 | £298,677 |
| 2011-10 | £327,870 | £643,930 | £560,666 | £459,850 | £292,768 |
| 2011-11 | £334,455 | £652,661 | £568,357 | £466,284 | £299,299 |
| 2011-12 | £329,394 | £641,259 | £558,898 | £457,280 | £295,187 |
| 2012-01 | £335,152 | £651,735 | £570,470 | £466,579 | £300,059 |
| 2012-02 | £321,270 | £630,077 | £552,053 | £450,896 | £286,826 |
| 2012-03 | £320,137 | £628,423 | £551,365 | £450,086 | £285,541 |
| 2012-04 | £321,851 | £627,718 | £550,846 | £451,272 | £287,309 |
| 2012-05 | £327,462 | £634,035 | £556,627 | £456,878 | £292,721 |
| 2012-06 | £332,068 | £640,977 | £563,144 | £465,661 | £296,495 |
| 2012-07 | £335,418 | £652,085 | £571,674 | £473,217 | £299,004 |
| 2012-08 | £344,295 | £675,461 | £590,669 | £489,710 | £306,253 |
| 2012-09 | £348,934 | £687,289 | £600,274 | £496,782 | £310,282 |
| 2012-10 | £345,588 | £678,029 | £593,100 | £490,397 | £307,576 |
| 2012-11 | £351,955 | £688,140 | £602,544 | £497,739 | £313,522 |
| 2012-12 | £354,239 | £695,053 | £606,791 | £500,599 | £315,604 |
| 2013-01 | £362,867 | £714,627 | £625,278 | £514,529 | £322,976 |
| 2013-02 | £364,941 | £719,827 | £630,523 | £518,553 | £324,636 |
| 2013-03 | £367,051 | £722,416 | £634,609 | £521,060 | £326,562 |
| 2013-04 | £369,206 | £726,071 | £637,868 | £524,075 | £328,490 |
| 2013-05 | £370,297 | £725,477 | £638,923 | £524,706 | £329,601 |
| 2013-06 | £374,442 | £732,011 | £646,900 | £532,323 | £333,040 |
| 2013-07 | £380,617 | £741,168 | £657,332 | £542,236 | £338,380 |
| 2013-08 | £392,378 | £767,347 | £681,316 | £561,803 | £348,407 |
| 2013-09 | £408,202 | £801,280 | £707,692 | £583,665 | £362,575 |
| 2013-10 | £406,084 | £801,646 | £704,194 | £579,352 | £360,867 |
| 2013-11 | £411,178 | £810,943 | £710,845 | £584,052 | £365,771 |
| 2013-12 | £416,420 | £818,722 | £718,807 | £590,004 | £370,656 |
| 2014-01 | £429,128 | £846,247 | £740,633 | £607,780 | £381,998 |
| 2014-02 | £437,653 | £869,358 | £754,903 | £619,150 | £389,663 |
| 2014-03 | £448,204 | £895,250 | £775,460 | £634,700 | £398,921 |
| 2014-04 | £455,702 | £910,216 | £788,842 | £646,295 | £405,486 |
| 2014-05 | £467,642 | £928,256 | £808,422 | £663,855 | £416,061 |
| 2014-06 | £475,863 | £943,787 | £823,193 | £676,637 | £423,252 |
| 2014-07 | £485,473 | £964,056 | £841,651 | £692,072 | £431,594 |
| 2014-08 | £496,424 | £993,058 | £864,840 | £710,871 | £440,942 |
| 2014-09 | £497,690 | £999,288 | £866,917 | £713,698 | £441,953 |
| 2014-10 | £499,494 | £1,005,799 | £867,568 | £713,822 | £443,835 |
| 2014-11 | £482,535 | £972,477 | £836,489 | £687,575 | £428,992 |
| 2014-12 | £486,579 | £979,332 | £842,948 | £690,819 | £432,864 |
| 2015-01 | £485,309 | £975,804 | £844,350 | £689,545 | £431,649 |
| 2015-02 | £496,451 | £995,509 | £863,784 | £704,409 | £441,685 |
| 2015-03 | £493,357 | £988,789 | £859,564 | £699,320 | £439,064 |
| 2015-04 | £510,799 | £1,024,651 | £887,103 | £724,221 | £454,578 |
| 2015-05 | £523,322 | £1,049,150 | £908,759 | £741,395 | £465,803 |
| 2015-06 | £532,913 | £1,073,413 | £930,120 | £760,427 | £473,569 |
| 2015-07 | £537,085 | £1,081,047 | £940,111 | £767,167 | £477,156 |
| 2015-08 | £542,837 | £1,095,825 | £952,147 | £778,407 | £481,841 |
| 2015-09 | £541,455 | £1,092,700 | £945,619 | £773,914 | £480,976 |
| 2015-10 | £539,819 | £1,092,422 | £940,394 | £771,320 | £479,567 |
| 2015-11 | £537,688 | £1,089,011 | £936,312 | £767,557 | £477,771 |
| 2015-12 | £546,793 | £1,115,917 | £955,100 | £780,625 | £485,820 |
| 2016-01 | £565,035 | £1,153,511 | £991,661 | £807,176 | £501,929 |
| 2016-02 | £575,553 | £1,181,585 | £1,013,928 | £822,650 | £511,179 |
| 2016-03 | £585,671 | £1,193,035 | £1,031,325 | £836,861 | £520,216 |
| 2016-04 | £553,456 | £1,134,119 | £972,725 | £789,446 | £491,789 |
| 2016-05 | £533,175 | £1,086,049 | £928,519 | £756,453 | £474,381 |
| 2016-06 | £517,401 | £1,062,330 | £898,239 | £731,611 | £460,683 |
| 2016-07 | £533,141 | £1,089,635 | £926,074 | £755,057 | £474,542 |
| 2016-08 | £543,584 | £1,114,183 | £946,661 | £771,462 | £483,597 |
| 2016-09 | £555,998 | £1,135,410 | £969,981 | £789,576 | £494,570 |
| 2016-10 | £564,897 | £1,150,303 | £980,866 | £796,776 | £503,260 |
| 2016-11 | £576,511 | £1,176,100 | £1,000,083 | £810,104 | £514,026 |
| 2016-12 | £567,368 | £1,160,279 | £981,028 | £794,667 | £506,243 |
| 2017-01 | £580,485 | £1,187,220 | £1,002,053 | £813,299 | £517,921 |
| 2017-02 | £570,286 | £1,158,731 | £978,050 | £795,053 | £509,406 |
| 2017-03 | £553,536 | £1,120,837 | £947,076 | £769,475 | £494,756 |
| 2017-04 | £531,345 | £1,075,191 | £907,192 | £736,006 | £475,281 |
| 2017-05 | £521,562 | £1,051,845 | £890,917 | £720,502 | £466,794 |
| 2017-06 | £551,254 | £1,105,783 | £939,089 | £761,202 | £493,447 |
| 2017-07 | £565,753 | £1,132,111 | £963,985 | £781,574 | £506,384 |
| 2017-08 | £591,809 | £1,184,689 | £1,010,724 | £823,120 | £528,955 |
| 2017-09 | £595,062 | £1,194,482 | £1,018,890 | £829,830 | £531,545 |
| 2017-10 | £593,905 | £1,198,355 | £1,021,573 | £831,269 | £530,058 |
| 2017-11 | £580,572 | £1,174,954 | £1,000,159 | £811,447 | £518,288 |
| 2017-12 | £575,915 | £1,166,922 | £993,633 | £804,291 | £514,197 |
| 2018-01 | £570,429 | £1,152,619 | £983,267 | £795,149 | £509,506 |
| 2018-02 | £572,459 | £1,158,817 | £985,726 | £797,123 | £511,412 |
| 2018-03 | £551,599 | £1,119,038 | £952,728 | £770,710 | £492,432 |
| 2018-04 | £547,818 | £1,112,848 | £950,035 | £769,776 | £488,513 |
| 2018-05 | £559,114 | £1,148,410 | £979,635 | £792,834 | £497,643 |
| 2018-06 | £571,351 | £1,172,276 | £1,002,607 | £810,038 | £508,543 |
| 2018-07 | £572,615 | £1,181,570 | £1,005,516 | £812,610 | £509,561 |
| 2018-08 | £563,460 | £1,149,255 | £985,325 | £798,415 | £501,606 |
| 2018-09 | £555,843 | £1,142,582 | £975,117 | £790,218 | £494,484 |
| 2018-10 | £564,368 | £1,152,217 | £986,631 | £799,182 | £502,475 |
| 2018-11 | £561,779 | £1,157,723 | £987,070 | £797,888 | £499,841 |
| 2018-12 | £566,545 | £1,154,392 | £988,836 | £800,319 | £504,662 |
| 2019-01 | £545,465 | £1,118,402 | £955,528 | £772,006 | £485,675 |
| 2019-02 | £550,467 | £1,127,432 | £962,062 | £775,382 | £490,582 |
| 2019-03 | £573,513 | £1,184,810 | £1,009,664 | £812,069 | £510,547 |
| 2019-04 | £591,652 | £1,221,487 | £1,043,602 | £840,674 | £526,330 |
| 2019-05 | £581,002 | £1,198,956 | £1,029,095 | £830,591 | £516,221 |
| 2019-06 | £566,935 | £1,170,342 | £1,005,327 | £812,577 | £503,462 |
| 2019-07 | £576,958 | £1,185,078 | £1,019,990 | £825,591 | £512,557 |
| 2019-08 | £587,744 | £1,217,420 | £1,045,455 | £845,065 | £521,603 |
| 2019-09 | £589,964 | £1,222,443 | £1,048,056 | £848,794 | £523,520 |
| 2019-10 | £579,898 | £1,206,321 | £1,034,780 | £835,207 | £514,438 |
| 2019-11 | £573,859 | £1,193,055 | £1,022,762 | £824,711 | £509,300 |
| 2019-12 | £567,274 | £1,176,099 | £1,010,643 | £814,968 | £503,496 |
| 2020-01 | £574,592 | £1,192,179 | £1,022,625 | £826,561 | £509,872 |
| 2020-02 | £589,242 | £1,220,899 | £1,051,096 | £850,425 | £522,493 |
| 2020-03 | £597,238 | £1,239,629 | £1,069,799 | £863,845 | £529,309 |
| 2020-04 | £595,785 | £1,236,085 | £1,072,087 | £865,874 | £527,476 |
| 2020-05 | £598,229 | £1,232,873 | £1,068,284 | £862,933 | £530,510 |
| 2020-06 | £598,686 | £1,232,332 | £1,071,431 | £866,981 | £530,489 |
| 2020-07 | £614,742 | £1,267,905 | £1,101,032 | £891,181 | £544,593 |
| 2020-08 | £609,141 | £1,271,501 | £1,102,469 | £893,006 | £538,318 |
| 2020-09 | £626,906 | £1,320,896 | £1,141,712 | £924,899 | £553,249 |
| 2020-10 | £610,820 | £1,298,068 | £1,119,739 | £908,552 | £538,106 |
| 2020-11 | £613,382 | £1,300,420 | £1,122,398 | £914,070 | £540,191 |
| 2020-12 | £603,163 | £1,278,780 | £1,102,594 | £899,875 | £531,085 |
| 2021-01 | £606,513 | £1,276,608 | £1,100,083 | £898,108 | £534,921 |
| 2021-02 | £599,001 | £1,245,226 | £1,078,843 | £881,056 | £529,085 |
| 2021-03 | £590,061 | £1,204,842 | £1,048,508 | £859,016 | £522,398 |
| 2021-04 | £574,956 | £1,170,483 | £1,018,607 | £834,515 | £509,358 |
| 2021-05 | £563,795 | £1,151,604 | £997,987 | £817,249 | £499,601 |
| 2021-06 | £576,848 | £1,182,234 | £1,022,461 | £841,626 | £510,497 |
| 2021-07 | £611,739 | £1,270,059 | £1,089,367 | £889,411 | £541,688 |
| 2021-08 | £636,238 | £1,338,237 | £1,147,798 | £932,017 | £562,402 |
| 2021-09 | £624,634 | £1,326,608 | £1,135,425 | £915,371 | £552,012 |
| 2021-10 | £586,689 | £1,249,997 | £1,076,640 | £868,613 | £517,326 |
| 2021-11 | £572,251 | £1,214,958 | £1,047,559 | £846,159 | £504,749 |
| 2021-12 | £578,650 | £1,243,405 | £1,067,470 | £859,760 | £509,820 |
| 2022-01 | £607,358 | £1,304,845 | £1,123,314 | £905,897 | £534,681 |
| 2022-02 | £611,550 | £1,309,853 | £1,129,977 | £910,533 | £538,774 |
| 2022-03 | £612,640 | £1,314,582 | £1,131,250 | £910,262 | £540,026 |
| 2022-04 | £589,080 | £1,266,229 | £1,084,187 | £876,402 | £519,120 |
| 2022-05 | £591,519 | £1,284,362 | £1,095,077 | £885,871 | £520,249 |
| 2022-06 | £599,439 | £1,294,347 | £1,106,070 | £898,327 | £527,177 |
| 2022-07 | £622,549 | £1,342,403 | £1,155,777 | £936,101 | £546,930 |
| 2022-08 | £630,011 | £1,359,663 | £1,172,643 | £951,843 | £552,748 |
| 2022-09 | £629,265 | £1,369,209 | £1,182,934 | £957,992 | £550,803 |
| 2022-10 | £627,788 | £1,371,529 | £1,176,777 | £955,523 | £549,578 |
| 2022-11 | £624,416 | £1,364,662 | £1,167,670 | £948,046 | £547,019 |
| 2022-12 | £608,364 | £1,324,208 | £1,131,916 | £920,347 | £533,548 |
| 2023-01 | £611,019 | £1,329,951 | £1,141,582 | £924,184 | £535,847 |
| 2023-02 | £601,522 | £1,311,044 | £1,124,006 | £908,049 | £527,785 |
| 2023-03 | £611,912 | £1,336,994 | £1,145,208 | £920,121 | £537,431 |
| 2023-04 | £596,046 | £1,305,034 | £1,115,514 | £894,528 | £523,753 |
| 2023-05 | £603,081 | £1,314,344 | £1,124,797 | £904,334 | £530,119 |
| 2023-06 | £608,774 | £1,328,307 | £1,139,577 | £918,079 | £534,268 |
| 2023-07 | £617,642 | £1,347,408 | £1,161,424 | £935,097 | £541,428 |
| 2023-08 | £608,041 | £1,330,800 | £1,153,139 | £925,567 | £532,105 |
| 2023-09 | £612,750 | £1,341,012 | £1,162,479 | £934,469 | £535,960 |
| 2023-10 | £626,236 | £1,365,586 | £1,181,854 | £951,519 | £548,385 |
| 2023-11 | £638,941 | £1,393,154 | £1,204,018 | £967,073 | £560,100 |
| 2023-12 | £627,736 | £1,364,690 | £1,182,137 | £946,079 | £550,906 |
| 2024-01 | £607,243 | £1,318,443 | £1,141,456 | £915,916 | £532,845 |
| 2024-02 | £601,689 | £1,305,266 | £1,129,859 | £908,939 | £527,795 |
| 2024-03 | £604,604 | £1,307,219 | £1,129,983 | £911,944 | £530,624 |
| 2024-04 | £604,881 | £1,301,334 | £1,130,708 | £911,271 | £531,032 |
| 2024-05 | £618,816 | £1,322,772 | £1,152,473 | £929,454 | £543,733 |
| 2024-06 | £619,527 | £1,321,730 | £1,153,053 | £932,569 | £544,069 |
| 2024-07 | £618,187 | £1,325,954 | £1,153,310 | £935,752 | £542,101 |
| 2024-08 | £615,625 | £1,328,887 | £1,152,204 | £937,801 | £538,944 |
| 2024-09 | £614,855 | £1,340,398 | £1,160,605 | £941,154 | £537,495 |
| 2024-10 | £624,895 | £1,356,219 | £1,173,873 | £953,011 | £546,846 |
| 2024-11 | £612,864 | £1,340,268 | £1,154,862 | £933,737 | £536,401 |
| 2024-12 | £609,536 | £1,341,036 | £1,147,423 | £928,174 | £533,561 |
| 2025-01 | £608,658 | £1,351,260 | £1,152,651 | £929,507 | £532,320 |
| 2025-02 | £618,740 | £1,364,773 | £1,167,154 | £945,305 | £541,127 |
| 2025-03 | £618,351 | £1,330,897 | £1,151,115 | £937,491 | £541,928 |
| 2025-04 | £604,043 | £1,309,700 | £1,134,935 | £920,647 | £528,662 |
| 2025-05 | £611,129 | £1,338,395 | £1,154,838 | £935,719 | £534,233 |
| 2025-06 | £603,777 | £1,348,448 | £1,159,698 | £936,306 | £526,055 |
| 2025-07 | £624,535 | £1,392,684 | £1,194,315 | £969,659 | £544,047 |
| 2025-08 | £622,904 | £1,388,067 | £1,200,054 | £973,384 | £541,770 |
| 2025-09 | £638,564 | £1,427,442 | £1,238,355 | £1,004,024 | £554,546 |
| 2025-10 | £633,902 | £1,417,018 | £1,235,919 | £998,635 | £550,198 |
| 2025-11 | £635,006 | £1,416,389 | £1,235,752 | £1,000,365 | £551,184 |
| 2025-12 | £615,721 | £1,368,480 | £1,195,480 | £965,956 | £534,976 |
| 2026-01 | £616,784 | £1,367,657 | £1,202,314 | £972,725 | £535,240 |
| 2026-02 | £597,279 | £1,321,751 | £1,164,283 | £940,051 | £518,521 |
| 2026-03 | £611,039 | £1,351,048 | £1,188,194 | £965,862 | £529,976 |
- All property types
- Detached
- Semi-detached
- Terraced
- Flats
Source: HM Land Registry House Price Index
| Year | All property types | Detached | Semi-detached | Terraced | Flats |
|---|---|---|---|---|---|
| 1996-01 | +8.2% | +6.9% | +9.1% | +7.9% | +8.5% |
| 1996-02 | +6.0% | +6.0% | +7.1% | +5.6% | +6.5% |
| 1996-03 | +6.5% | +7.3% | +8.4% | +6.2% | +6.6% |
| 1996-04 | +3.0% | +3.4% | +4.9% | +2.5% | +3.4% |
| 1996-05 | +1.2% | +1.8% | +2.5% | +1.1% | +1.2% |
| 1996-06 | +3.3% | +3.8% | +3.8% | +3.3% | +3.1% |
| 1996-07 | +3.5% | +4.7% | +4.1% | +3.6% | +3.2% |
| 1996-08 | +5.4% | +6.3% | +6.4% | +5.6% | +5.1% |
| 1996-09 | +4.5% | +4.7% | +5.0% | +4.4% | +4.6% |
| 1996-10 | +5.2% | +5.6% | +5.4% | +5.5% | +4.8% |
| 1996-11 | +5.7% | +6.2% | +5.8% | +6.4% | +4.8% |
| 1996-12 | +6.5% | +6.9% | +6.9% | +7.4% | +5.0% |
| 1997-01 | +5.4% | +5.0% | +6.0% | +6.4% | +3.7% |
| 1997-02 | +5.3% | +5.2% | +5.7% | +6.0% | +3.9% |
| 1997-03 | +6.7% | +6.0% | +6.3% | +7.4% | +5.2% |
| 1997-04 | +13.3% | +14.0% | +13.5% | +14.4% | +11.5% |
| 1997-05 | +18.7% | +18.6% | +19.4% | +19.9% | +16.8% |
| 1997-06 | +16.3% | +17.1% | +18.1% | +17.7% | +14.0% |
| 1997-07 | +13.8% | +14.0% | +15.4% | +15.2% | +12.0% |
| 1997-08 | +11.8% | +12.2% | +13.3% | +13.1% | +10.2% |
| 1997-09 | +14.6% | +15.1% | +16.5% | +15.8% | +13.1% |
| 1997-10 | +15.4% | +15.7% | +17.1% | +16.4% | +14.1% |
| 1997-11 | +16.9% | +17.8% | +18.8% | +18.1% | +15.4% |
| 1997-12 | +15.8% | +17.0% | +17.3% | +16.7% | +14.5% |
| 1998-01 | +19.5% | +21.4% | +21.1% | +20.5% | +18.3% |
| 1998-02 | +16.9% | +17.6% | +17.8% | +17.8% | +15.8% |
| 1998-03 | +16.6% | +18.1% | +18.0% | +17.3% | +15.7% |
| 1998-04 | +9.4% | +11.0% | +11.1% | +10.1% | +8.6% |
| 1998-05 | +8.9% | +11.0% | +10.7% | +9.6% | +8.0% |
| 1998-06 | +8.5% | +9.2% | +9.4% | +8.9% | +8.0% |
| 1998-07 | +13.6% | +13.8% | +14.3% | +14.0% | +13.2% |
| 1998-08 | +11.6% | +11.9% | +12.3% | +12.0% | +11.2% |
| 1998-09 | +12.0% | +12.8% | +12.9% | +12.7% | +11.3% |
| 1998-10 | +7.9% | +8.6% | +8.2% | +8.2% | +7.6% |
| 1998-11 | +10.2% | +11.2% | +10.4% | +9.9% | +10.3% |
| 1998-12 | +15.5% | +16.2% | +15.6% | +14.8% | +15.9% |
| 1999-01 | +19.1% | +19.9% | +19.7% | +18.2% | +19.6% |
| 1999-02 | +20.1% | +21.2% | +21.2% | +19.8% | +20.1% |
| 1999-03 | +17.0% | +17.1% | +17.4% | +16.6% | +17.1% |
| 1999-04 | +18.3% | +17.7% | +17.6% | +18.3% | +18.4% |
| 1999-05 | +15.6% | +14.1% | +14.1% | +15.0% | +16.1% |
| 1999-06 | +17.8% | +17.4% | +16.9% | +17.8% | +18.0% |
| 1999-07 | +13.9% | +14.5% | +13.4% | +14.0% | +14.1% |
| 1999-08 | +21.2% | +21.6% | +20.5% | +21.7% | +21.0% |
| 1999-09 | +19.8% | +20.5% | +18.7% | +19.9% | +20.0% |
| 1999-10 | +26.8% | +27.3% | +26.1% | +26.8% | +27.0% |
| 1999-11 | +25.3% | +25.1% | +24.4% | +25.5% | +25.2% |
| 1999-12 | +25.6% | +24.2% | +24.2% | +25.9% | +25.4% |
| 2000-01 | +21.8% | +21.2% | +20.8% | +22.5% | +21.4% |
| 2000-02 | +23.5% | +23.9% | +22.6% | +24.1% | +23.3% |
| 2000-03 | +23.2% | +24.8% | +23.4% | +24.5% | +22.4% |
| 2000-04 | +25.1% | +25.7% | +25.0% | +25.8% | +24.7% |
| 2000-05 | +27.9% | +28.1% | +27.9% | +28.5% | +27.4% |
| 2000-06 | +31.6% | +30.5% | +30.9% | +31.2% | +31.8% |
| 2000-07 | +33.2% | +32.4% | +32.7% | +32.4% | +33.5% |
| 2000-08 | +31.1% | +29.9% | +30.3% | +29.2% | +32.0% |
| 2000-09 | +29.2% | +28.8% | +28.5% | +27.1% | +30.2% |
| 2000-10 | +25.5% | +24.8% | +24.8% | +23.8% | +26.3% |
| 2000-11 | +21.1% | +20.9% | +20.5% | +19.5% | +21.7% |
| 2000-12 | +16.9% | +16.6% | +16.6% | +15.4% | +17.4% |
| 2001-01 | +14.8% | +13.6% | +13.3% | +13.0% | +15.7% |
| 2001-02 | +15.8% | +14.1% | +14.1% | +14.0% | +16.6% |
| 2001-03 | +21.3% | +19.3% | +19.2% | +19.3% | +22.5% |
| 2001-04 | +22.1% | +21.8% | +20.6% | +20.2% | +23.0% |
| 2001-05 | +19.8% | +20.4% | +18.5% | +18.2% | +20.7% |
| 2001-06 | +14.6% | +14.8% | +13.0% | +13.0% | +15.4% |
| 2001-07 | +12.1% | +10.5% | +10.2% | +10.6% | +13.0% |
| 2001-08 | +10.7% | +8.6% | +8.7% | +9.5% | +11.4% |
| 2001-09 | +10.3% | +8.0% | +8.3% | +9.3% | +10.9% |
| 2001-10 | +13.6% | +11.8% | +11.7% | +12.7% | +14.1% |
| 2001-11 | +15.6% | +13.8% | +13.7% | +14.6% | +16.2% |
| 2001-12 | +18.3% | +16.5% | +16.0% | +16.8% | +19.1% |
| 2002-01 | +18.6% | +16.8% | +16.6% | +16.6% | +19.7% |
| 2002-02 | +16.3% | +14.1% | +14.0% | +14.1% | +17.5% |
| 2002-03 | +13.7% | +10.7% | +11.5% | +11.3% | +14.9% |
| 2002-04 | +9.8% | +5.6% | +7.2% | +7.3% | +11.2% |
| 2002-05 | +11.4% | +6.5% | +8.7% | +8.5% | +12.9% |
| 2002-06 | +12.9% | +8.0% | +10.2% | +10.3% | +14.4% |
| 2002-07 | +19.0% | +15.0% | +16.3% | +16.7% | +20.2% |
| 2002-08 | +20.3% | +16.7% | +17.7% | +18.1% | +21.5% |
| 2002-09 | +23.4% | +19.9% | +21.3% | +21.4% | +24.4% |
| 2002-10 | +21.3% | +17.7% | +19.4% | +19.4% | +22.3% |
| 2002-11 | +22.5% | +19.1% | +20.4% | +20.7% | +23.4% |
| 2002-12 | +19.9% | +17.4% | +18.2% | +18.4% | +20.7% |
| 2003-01 | +19.7% | +16.8% | +17.9% | +18.9% | +20.1% |
| 2003-02 | +21.7% | +18.3% | +20.4% | +20.7% | +22.2% |
| 2003-03 | +19.6% | +15.6% | +17.7% | +18.4% | +20.2% |
| 2003-04 | +19.6% | +15.9% | +18.3% | +18.4% | +20.3% |
| 2003-05 | +16.9% | +13.1% | +15.5% | +16.5% | +17.2% |
| 2003-06 | +14.7% | +12.2% | +14.3% | +14.4% | +14.9% |
| 2003-07 | +11.4% | +8.7% | +11.0% | +10.9% | +11.8% |
| 2003-08 | +6.7% | +3.9% | +6.5% | +6.2% | +7.0% |
| 2003-09 | +4.3% | +0.6% | +3.9% | +4.2% | +4.4% |
| 2003-10 | +3.0% | -0.6% | +2.4% | +3.2% | +3.0% |
| 2003-11 | +3.1% | -0.6% | +2.6% | +3.5% | +3.0% |
| 2003-12 | +3.8% | -0.5% | +3.1% | +4.2% | +3.7% |
| 2004-01 | +5.3% | +1.4% | +5.4% | +5.7% | +5.2% |
| 2004-02 | +3.2% | -0.5% | +3.4% | +4.0% | +2.9% |
| 2004-03 | +7.7% | +4.7% | +8.4% | +8.8% | +7.3% |
| 2004-04 | +8.1% | +5.2% | +8.7% | +9.8% | +7.4% |
| 2004-05 | +7.5% | +4.5% | +7.8% | +8.7% | +7.0% |
| 2004-06 | +5.1% | +1.2% | +5.1% | +6.4% | +4.5% |
| 2004-07 | +3.0% | -0.9% | +2.9% | +4.1% | +2.5% |
| 2004-08 | +8.3% | +4.8% | +8.3% | +9.6% | +7.8% |
| 2004-09 | +9.7% | +6.7% | +9.7% | +10.7% | +9.4% |
| 2004-10 | +13.3% | +10.1% | +12.7% | +13.9% | +13.2% |
| 2004-11 | +13.6% | +9.7% | +12.4% | +14.1% | +13.5% |
| 2004-12 | +14.0% | +10.0% | +12.1% | +14.6% | +13.8% |
| 2005-01 | +10.8% | +6.9% | +8.5% | +11.4% | +10.7% |
| 2005-02 | +10.8% | +7.4% | +8.7% | +11.5% | +10.6% |
| 2005-03 | +6.1% | +3.1% | +4.4% | +6.8% | +5.9% |
| 2005-04 | +6.1% | +3.7% | +4.6% | +6.6% | +6.0% |
| 2005-05 | +3.3% | +2.0% | +1.9% | +3.7% | +3.2% |
| 2005-06 | +4.3% | +3.5% | +3.1% | +4.9% | +4.1% |
| 2005-07 | +5.0% | +4.0% | +3.6% | +5.6% | +4.9% |
| 2005-08 | +4.1% | +2.8% | +2.5% | +4.8% | +3.9% |
| 2005-09 | +5.6% | +3.6% | +3.7% | +6.2% | +5.5% |
| 2005-10 | +1.4% | -0.5% | +0.1% | +2.4% | +1.2% |
| 2005-11 | -0.3% | -2.3% | -1.1% | +0.8% | -0.6% |
| 2005-12 | +0.5% | -1.1% | +0.2% | +1.7% | +0.1% |
| 2006-01 | +3.3% | +2.1% | +3.3% | +4.6% | +2.9% |
| 2006-02 | +4.8% | +3.6% | +4.5% | +5.8% | +4.5% |
| 2006-03 | +4.5% | +3.5% | +4.2% | +5.7% | +4.1% |
| 2006-04 | +6.8% | +6.2% | +6.5% | +7.9% | +6.4% |
| 2006-05 | +10.3% | +9.6% | +10.6% | +11.6% | +9.9% |
| 2006-06 | +14.8% | +13.6% | +15.1% | +15.7% | +14.5% |
| 2006-07 | +14.4% | +13.0% | +14.9% | +15.7% | +14.0% |
| 2006-08 | +14.8% | +13.6% | +15.6% | +16.5% | +14.3% |
| 2006-09 | +12.8% | +12.7% | +14.3% | +14.5% | +12.2% |
| 2006-10 | +16.3% | +16.6% | +17.8% | +17.8% | +15.8% |
| 2006-11 | +16.3% | +17.0% | +17.9% | +17.7% | +15.9% |
| 2006-12 | +14.1% | +14.8% | +15.9% | +15.8% | +13.5% |
| 2007-01 | +12.2% | +12.8% | +13.9% | +13.7% | +11.6% |
| 2007-02 | +12.8% | +13.8% | +14.0% | +13.9% | +12.4% |
| 2007-03 | +15.5% | +16.0% | +16.0% | +16.3% | +15.2% |
| 2007-04 | +14.2% | +14.5% | +14.6% | +15.4% | +13.9% |
| 2007-05 | +15.1% | +14.7% | +15.2% | +16.6% | +14.6% |
| 2007-06 | +11.7% | +11.7% | +11.8% | +13.2% | +11.3% |
| 2007-07 | +14.2% | +14.7% | +14.3% | +15.2% | +13.9% |
| 2007-08 | +15.2% | +16.4% | +15.8% | +16.3% | +14.9% |
| 2007-09 | +18.7% | +19.0% | +18.9% | +19.7% | +18.4% |
| 2007-10 | +16.5% | +17.0% | +16.5% | +17.5% | +16.3% |
| 2007-11 | +15.8% | +16.3% | +15.4% | +16.4% | +15.7% |
| 2007-12 | +13.6% | +14.6% | +13.0% | +13.7% | +13.5% |
| 2008-01 | +15.3% | +16.4% | +14.8% | +15.3% | +15.4% |
| 2008-02 | +13.2% | +15.0% | +13.2% | +13.6% | +13.1% |
| 2008-03 | +13.5% | +15.9% | +13.9% | +14.1% | +13.4% |
| 2008-04 | +14.4% | +18.0% | +15.1% | +15.0% | +14.2% |
| 2008-05 | +15.2% | +18.6% | +16.2% | +15.8% | +15.1% |
| 2008-06 | +17.7% | +20.9% | +18.9% | +18.6% | +17.5% |
| 2008-07 | +11.4% | +13.1% | +12.4% | +12.2% | +11.2% |
| 2008-08 | +5.8% | +6.6% | +6.2% | +6.0% | +5.7% |
| 2008-09 | -3.4% | -2.2% | -3.4% | -3.6% | -3.3% |
| 2008-10 | -4.0% | -2.9% | -3.5% | -4.2% | -4.0% |
| 2008-11 | -3.4% | -2.5% | -2.8% | -3.6% | -3.4% |
| 2008-12 | -2.3% | -1.8% | -1.2% | -1.8% | -2.5% |
| 2009-01 | -3.5% | -2.9% | -2.5% | -2.9% | -3.6% |
| 2009-02 | -7.3% | -7.5% | -6.2% | -6.7% | -7.5% |
| 2009-03 | -6.7% | -8.3% | -6.1% | -6.6% | -6.7% |
| 2009-04 | -15.3% | -18.4% | -15.2% | -15.4% | -15.3% |
| 2009-05 | -18.5% | -20.9% | -18.1% | -18.3% | -18.5% |
| 2009-06 | -24.2% | -25.9% | -23.5% | -23.7% | -24.4% |
| 2009-07 | -16.6% | -16.9% | -15.1% | -15.2% | -17.0% |
| 2009-08 | -13.0% | -13.2% | -11.3% | -11.0% | -13.6% |
| 2009-09 | -4.1% | -4.7% | -1.8% | -1.1% | -4.8% |
| 2009-10 | -1.8% | -2.3% | +1.1% | +1.8% | -2.7% |
| 2009-11 | +0.4% | +1.2% | +3.7% | +4.6% | -0.7% |
| 2009-12 | +0.2% | +1.6% | +4.0% | +4.4% | -0.9% |
| 2010-01 | -0.5% | +1.0% | +3.6% | +4.7% | -1.9% |
| 2010-02 | +4.9% | +7.3% | +10.0% | +11.2% | +3.3% |
| 2010-03 | +1.6% | +4.8% | +6.8% | +8.3% | 0.0% |
| 2010-04 | +11.4% | +16.1% | +17.1% | +18.0% | +9.7% |
| 2010-05 | +11.4% | +16.0% | +16.2% | +17.1% | +10.0% |
| 2010-06 | +21.4% | +26.5% | +26.4% | +27.4% | +19.9% |
| 2010-07 | +12.3% | +17.3% | +16.5% | +17.3% | +11.0% |
| 2010-08 | +11.0% | +15.8% | +15.8% | +15.6% | +9.8% |
| 2010-09 | +5.6% | +10.8% | +10.2% | +9.9% | +4.4% |
| 2010-10 | +3.5% | +7.8% | +7.4% | +7.3% | +2.5% |
| 2010-11 | -1.2% | +2.4% | +2.0% | +1.7% | -2.0% |
| 2010-12 | +0.1% | +3.4% | +2.9% | +2.6% | -0.6% |
| 2011-01 | -0.5% | +2.4% | +1.6% | +1.0% | -1.0% |
| 2011-02 | +0.7% | +3.2% | +1.8% | +1.5% | +0.5% |
| 2011-03 | -1.0% | +2.1% | +0.1% | -0.5% | -1.2% |
| 2011-04 | +2.1% | +5.7% | +3.0% | +2.7% | +1.8% |
| 2011-05 | +2.8% | +5.8% | +3.8% | +3.4% | +2.5% |
| 2011-06 | -0.2% | +1.5% | +0.2% | -0.2% | -0.2% |
| 2011-07 | +1.4% | +1.2% | +1.1% | +0.9% | +1.6% |
| 2011-08 | +1.4% | +1.8% | +1.4% | +1.3% | +1.5% |
| 2011-09 | +5.1% | +5.5% | +5.3% | +5.2% | +5.1% |
| 2011-10 | +4.1% | +6.0% | +5.2% | +4.8% | +3.9% |
| 2011-11 | +9.0% | +10.0% | +9.8% | +9.5% | +8.8% |
| 2011-12 | +8.0% | +8.7% | +8.5% | +8.2% | +7.9% |
| 2012-01 | +10.2% | +10.7% | +11.3% | +10.5% | +10.0% |
| 2012-02 | +3.4% | +4.8% | +5.7% | +4.6% | +2.9% |
| 2012-03 | +5.2% | +5.7% | +7.8% | +6.6% | +4.6% |
| 2012-04 | +2.3% | +1.9% | +4.3% | +3.6% | +1.8% |
| 2012-05 | +4.7% | +4.0% | +6.3% | +5.7% | +4.2% |
| 2012-06 | +5.3% | +5.4% | +6.9% | +7.1% | +4.7% |
| 2012-07 | +5.1% | +6.7% | +7.3% | +7.5% | +4.2% |
| 2012-08 | +6.6% | +8.3% | +8.3% | +9.0% | +5.9% |
| 2012-09 | +4.4% | +5.8% | +5.8% | +6.3% | +3.9% |
| 2012-10 | +5.4% | +5.3% | +5.8% | +6.6% | +5.1% |
| 2012-11 | +5.2% | +5.4% | +6.0% | +6.7% | +4.8% |
| 2012-12 | +7.5% | +8.4% | +8.6% | +9.5% | +6.9% |
| 2013-01 | +8.3% | +9.7% | +9.6% | +10.3% | +7.6% |
| 2013-02 | +13.6% | +14.2% | +14.2% | +15.0% | +13.2% |
| 2013-03 | +14.7% | +15.0% | +15.1% | +15.8% | +14.4% |
| 2013-04 | +14.7% | +15.7% | +15.8% | +16.1% | +14.3% |
| 2013-05 | +13.1% | +14.4% | +14.8% | +14.8% | +12.6% |
| 2013-06 | +12.8% | +14.2% | +14.9% | +14.3% | +12.3% |
| 2013-07 | +13.5% | +13.7% | +15.0% | +14.6% | +13.2% |
| 2013-08 | +14.0% | +13.6% | +15.3% | +14.7% | +13.8% |
| 2013-09 | +17.0% | +16.6% | +17.9% | +17.5% | +16.9% |
| 2013-10 | +17.5% | +18.2% | +18.7% | +18.1% | +17.3% |
| 2013-11 | +16.8% | +17.8% | +18.0% | +17.3% | +16.7% |
| 2013-12 | +17.6% | +17.8% | +18.5% | +17.9% | +17.4% |
| 2014-01 | +18.3% | +18.4% | +18.4% | +18.1% | +18.3% |
| 2014-02 | +19.9% | +20.8% | +19.7% | +19.4% | +20.0% |
| 2014-03 | +22.1% | +23.9% | +22.2% | +21.8% | +22.2% |
| 2014-04 | +23.4% | +25.4% | +23.7% | +23.3% | +23.4% |
| 2014-05 | +26.3% | +28.0% | +26.5% | +26.5% | +26.2% |
| 2014-06 | +27.1% | +28.9% | +27.3% | +27.1% | +27.1% |
| 2014-07 | +27.5% | +30.1% | +28.0% | +27.6% | +27.5% |
| 2014-08 | +26.5% | +29.4% | +26.9% | +26.5% | +26.6% |
| 2014-09 | +21.9% | +24.7% | +22.5% | +22.3% | +21.9% |
| 2014-10 | +23.0% | +25.5% | +23.2% | +23.2% | +23.0% |
| 2014-11 | +17.4% | +19.9% | +17.7% | +17.7% | +17.3% |
| 2014-12 | +16.8% | +19.6% | +17.3% | +17.1% | +16.8% |
| 2015-01 | +13.1% | +15.3% | +14.0% | +13.5% | +13.0% |
| 2015-02 | +13.4% | +14.5% | +14.4% | +13.8% | +13.4% |
| 2015-03 | +10.1% | +10.4% | +10.8% | +10.2% | +10.1% |
| 2015-04 | +12.1% | +12.6% | +12.5% | +12.1% | +12.1% |
| 2015-05 | +11.9% | +13.0% | +12.4% | +11.7% | +12.0% |
| 2015-06 | +12.0% | +13.7% | +13.0% | +12.4% | +11.9% |
| 2015-07 | +10.6% | +12.1% | +11.7% | +10.9% | +10.6% |
| 2015-08 | +9.3% | +10.3% | +10.1% | +9.5% | +9.3% |
| 2015-09 | +8.8% | +9.3% | +9.1% | +8.4% | +8.8% |
| 2015-10 | +8.1% | +8.6% | +8.4% | +8.1% | +8.1% |
| 2015-11 | +11.4% | +12.0% | +11.9% | +11.6% | +11.4% |
| 2015-12 | +12.4% | +13.9% | +13.3% | +13.0% | +12.2% |
| 2016-01 | +16.4% | +18.2% | +17.4% | +17.1% | +16.3% |
| 2016-02 | +15.9% | +18.7% | +17.4% | +16.8% | +15.7% |
| 2016-03 | +18.7% | +20.7% | +20.0% | +19.7% | +18.5% |
| 2016-04 | +8.4% | +10.7% | +9.7% | +9.0% | +8.2% |
| 2016-05 | +1.9% | +3.5% | +2.2% | +2.0% | +1.8% |
| 2016-06 | -2.9% | -1.0% | -3.4% | -3.8% | -2.7% |
| 2016-07 | -0.7% | +0.8% | -1.5% | -1.6% | -0.5% |
| 2016-08 | +0.1% | +1.7% | -0.6% | -0.9% | +0.4% |
| 2016-09 | +2.7% | +3.9% | +2.6% | +2.0% | +2.8% |
| 2016-10 | +4.6% | +5.3% | +4.3% | +3.3% | +4.9% |
| 2016-11 | +7.2% | +8.0% | +6.8% | +5.5% | +7.6% |
| 2016-12 | +3.8% | +4.0% | +2.7% | +1.8% | +4.2% |
| 2017-01 | +2.7% | +2.9% | +1.0% | +0.8% | +3.2% |
| 2017-02 | -0.9% | -1.9% | -3.5% | -3.4% | -0.3% |
| 2017-03 | -5.5% | -6.1% | -8.2% | -8.1% | -4.9% |
| 2017-04 | -4.0% | -5.2% | -6.7% | -6.8% | -3.4% |
| 2017-05 | -2.2% | -3.1% | -4.0% | -4.8% | -1.6% |
| 2017-06 | +6.5% | +4.1% | +4.5% | +4.0% | +7.1% |
| 2017-07 | +6.1% | +3.9% | +4.1% | +3.5% | +6.7% |
| 2017-08 | +8.9% | +6.3% | +6.8% | +6.7% | +9.4% |
| 2017-09 | +7.0% | +5.2% | +5.0% | +5.1% | +7.5% |
| 2017-10 | +5.1% | +4.2% | +4.2% | +4.3% | +5.3% |
| 2017-11 | +0.7% | -0.1% | 0.0% | +0.2% | +0.8% |
| 2017-12 | +1.5% | +0.6% | +1.3% | +1.2% | +1.6% |
| 2018-01 | -1.7% | -2.9% | -1.9% | -2.2% | -1.6% |
| 2018-02 | +0.4% | 0.0% | +0.8% | +0.3% | +0.4% |
| 2018-03 | -0.3% | -0.2% | +0.6% | +0.2% | -0.5% |
| 2018-04 | +3.1% | +3.5% | +4.7% | +4.6% | +2.8% |
| 2018-05 | +7.2% | +9.2% | +10.0% | +10.0% | +6.6% |
| 2018-06 | +3.6% | +6.0% | +6.8% | +6.4% | +3.1% |
| 2018-07 | +1.2% | +4.4% | +4.3% | +4.0% | +0.6% |
| 2018-08 | -4.8% | -3.0% | -2.5% | -3.0% | -5.2% |
| 2018-09 | -6.6% | -4.3% | -4.3% | -4.8% | -7.0% |
| 2018-10 | -5.0% | -3.9% | -3.4% | -3.9% | -5.2% |
| 2018-11 | -3.2% | -1.5% | -1.3% | -1.7% | -3.6% |
| 2018-12 | -1.6% | -1.1% | -0.5% | -0.5% | -1.9% |
| 2019-01 | -4.4% | -3.0% | -2.8% | -2.9% | -4.7% |
| 2019-02 | -3.8% | -2.7% | -2.4% | -2.7% | -4.1% |
| 2019-03 | +4.0% | +5.9% | +6.0% | +5.4% | +3.7% |
| 2019-04 | +8.0% | +9.8% | +9.8% | +9.2% | +7.7% |
| 2019-05 | +3.9% | +4.4% | +5.0% | +4.8% | +3.7% |
| 2019-06 | -0.8% | -0.2% | +0.3% | +0.3% | -1.0% |
| 2019-07 | +0.8% | +0.3% | +1.4% | +1.6% | +0.6% |
| 2019-08 | +4.3% | +5.9% | +6.1% | +5.8% | +4.0% |
| 2019-09 | +6.1% | +7.0% | +7.5% | +7.4% | +5.9% |
| 2019-10 | +2.8% | +4.7% | +4.9% | +4.5% | +2.4% |
| 2019-11 | +2.2% | +3.1% | +3.6% | +3.4% | +1.9% |
| 2019-12 | +0.1% | +1.9% | +2.2% | +1.8% | -0.2% |
| 2020-01 | +5.3% | +6.6% | +7.0% | +7.1% | +5.0% |
| 2020-02 | +7.0% | +8.3% | +9.3% | +9.7% | +6.5% |
| 2020-03 | +4.1% | +4.6% | +6.0% | +6.4% | +3.7% |
| 2020-04 | +0.7% | +1.2% | +2.7% | +3.0% | +0.2% |
| 2020-05 | +3.0% | +2.8% | +3.8% | +3.9% | +2.8% |
| 2020-06 | +5.6% | +5.3% | +6.6% | +6.7% | +5.4% |
| 2020-07 | +6.5% | +7.0% | +7.9% | +7.9% | +6.3% |
| 2020-08 | +3.6% | +4.4% | +5.5% | +5.7% | +3.2% |
| 2020-09 | +6.3% | +8.1% | +8.9% | +9.0% | +5.7% |
| 2020-10 | +5.3% | +7.6% | +8.2% | +8.8% | +4.6% |
| 2020-11 | +6.9% | +9.0% | +9.7% | +10.8% | +6.1% |
| 2020-12 | +6.3% | +8.7% | +9.1% | +10.4% | +5.5% |
| 2021-01 | +5.6% | +7.1% | +7.6% | +8.7% | +4.9% |
| 2021-02 | +1.7% | +2.0% | +2.6% | +3.6% | +1.3% |
| 2021-03 | -1.2% | -2.8% | -2.0% | -0.6% | -1.3% |
| 2021-04 | -3.5% | -5.3% | -5.0% | -3.6% | -3.4% |
| 2021-05 | -5.8% | -6.6% | -6.6% | -5.3% | -5.8% |
| 2021-06 | -3.6% | -4.1% | -4.6% | -2.9% | -3.8% |
| 2021-07 | -0.5% | +0.2% | -1.1% | -0.2% | -0.5% |
| 2021-08 | +4.4% | +5.2% | +4.1% | +4.4% | +4.5% |
| 2021-09 | -0.4% | +0.4% | -0.6% | -1.0% | -0.2% |
| 2021-10 | -4.0% | -3.7% | -3.8% | -4.4% | -3.9% |
| 2021-11 | -6.7% | -6.6% | -6.7% | -7.4% | -6.6% |
| 2021-12 | -4.1% | -2.8% | -3.2% | -4.5% | -4.0% |
| 2022-01 | +0.1% | +2.2% | +2.1% | +0.9% | 0.0% |
| 2022-02 | +2.1% | +5.2% | +4.7% | +3.3% | +1.8% |
| 2022-03 | +3.8% | +9.1% | +7.9% | +6.0% | +3.4% |
| 2022-04 | +2.5% | +8.2% | +6.4% | +5.0% | +1.9% |
| 2022-05 | +4.9% | +11.5% | +9.7% | +8.4% | +4.1% |
| 2022-06 | +3.9% | +9.5% | +8.2% | +6.7% | +3.3% |
| 2022-07 | +1.8% | +5.7% | +6.1% | +5.2% | +1.0% |
| 2022-08 | -1.0% | +1.6% | +2.2% | +2.1% | -1.7% |
| 2022-09 | +0.7% | +3.2% | +4.2% | +4.7% | -0.2% |
| 2022-10 | +7.0% | +9.7% | +9.3% | +10.0% | +6.2% |
| 2022-11 | +9.1% | +12.3% | +11.5% | +12.0% | +8.4% |
| 2022-12 | +5.1% | +6.5% | +6.0% | +7.0% | +4.7% |
| 2023-01 | +0.6% | +1.9% | +1.6% | +2.0% | +0.2% |
| 2023-02 | -1.6% | +0.1% | -0.5% | -0.3% | -2.0% |
| 2023-03 | -0.1% | +1.7% | +1.2% | +1.1% | -0.5% |
| 2023-04 | +1.2% | +3.1% | +2.9% | +2.1% | +0.9% |
| 2023-05 | +2.0% | +2.3% | +2.7% | +2.1% | +1.9% |
| 2023-06 | +1.6% | +2.6% | +3.0% | +2.2% | +1.3% |
| 2023-07 | -0.8% | +0.4% | +0.5% | -0.1% | -1.0% |
| 2023-08 | -3.5% | -2.1% | -1.7% | -2.8% | -3.7% |
| 2023-09 | -2.6% | -2.1% | -1.7% | -2.5% | -2.7% |
| 2023-10 | -0.2% | -0.4% | +0.4% | -0.4% | -0.2% |
| 2023-11 | +2.3% | +2.1% | +3.1% | +2.0% | +2.4% |
| 2023-12 | +3.2% | +3.1% | +4.4% | +2.8% | +3.3% |
| 2024-01 | -0.6% | -0.9% | 0.0% | -0.9% | -0.6% |
| 2024-02 | 0.0% | -0.4% | +0.5% | +0.1% | 0.0% |
| 2024-03 | -1.2% | -2.2% | -1.3% | -0.9% | -1.3% |
| 2024-04 | +1.5% | -0.3% | +1.4% | +1.9% | +1.4% |
| 2024-05 | +2.6% | +0.6% | +2.5% | +2.8% | +2.6% |
| 2024-06 | +1.8% | -0.5% | +1.2% | +1.6% | +1.8% |
| 2024-07 | +0.1% | -1.6% | -0.7% | +0.1% | +0.1% |
| 2024-08 | +1.2% | -0.1% | -0.1% | +1.3% | +1.3% |
| 2024-09 | +0.3% | 0.0% | -0.2% | +0.7% | +0.3% |
| 2024-10 | -0.2% | -0.7% | -0.7% | +0.2% | -0.3% |
| 2024-11 | -4.1% | -3.8% | -4.1% | -3.4% | -4.2% |
| 2024-12 | -2.9% | -1.7% | -2.9% | -1.9% | -3.1% |
| 2025-01 | +0.2% | +2.5% | +1.0% | +1.5% | -0.1% |
| 2025-02 | +2.8% | +4.6% | +3.3% | +4.0% | +2.5% |
| 2025-03 | +2.3% | +1.8% | +1.9% | +2.8% | +2.1% |
| 2025-04 | -0.1% | +0.6% | +0.4% | +1.0% | -0.4% |
| 2025-05 | -1.2% | +1.2% | +0.2% | +0.7% | -1.7% |
| 2025-06 | -2.5% | +2.0% | +0.6% | +0.4% | -3.3% |
| 2025-07 | +1.0% | +5.0% | +3.6% | +3.6% | +0.4% |
| 2025-08 | +1.2% | +4.5% | +4.2% | +3.8% | +0.5% |
| 2025-09 | +3.9% | +6.5% | +6.7% | +6.7% | +3.2% |
| 2025-10 | +1.4% | +4.5% | +5.3% | +4.8% | +0.6% |
| 2025-11 | +3.6% | +5.7% | +7.0% | +7.1% | +2.8% |
| 2025-12 | +1.0% | +2.0% | +4.2% | +4.1% | +0.3% |
| 2026-01 | +1.3% | +1.2% | +4.3% | +4.6% | +0.5% |
| 2026-02 | -3.5% | -3.2% | -0.2% | -0.6% | -4.2% |
| 2026-03 | -1.2% | +1.5% | +3.2% | +3.0% | -2.2% |
Source: HM Land Registry House Price Index for Hackney, January 1995 to March 2026.
Sold House Prices in Hackney
The average sold price in Hackney is £611,039, which is 110.7% above the England average of £290,437. Every property type carries a heavy premium over England, but the gaps are widest where the stock is scarcest. House prices by type are dominated by a borough that is mostly flats, with houses of any kind a rarity that commands a steep premium when one comes to market.
| Property Type | Hackney Average | England Average | Difference |
|---|---|---|---|
| Detached houses | £1,351,048 | £470,492 | +187.2% |
| Semi-detached houses | £1,188,194 | £288,185 | +312.3% |
| Terraced houses | £965,862 | £243,788 | +296.2% |
| Flats and maisonettes | £529,976 | £214,563 | +147.0% |
| All property types | £611,039 | £289,946 | +110.7% |
Detached houses in Hackney average £1,351,048, 187.2% above the England detached average. These are the rarest homes in the borough, a scattering of Victorian and Georgian villas in pockets of Stoke Newington, Clapton and De Beauvoir Town. The small number of sales means this average swings month to month, and for most investors detached stock is more a curiosity than a target.
Semi-detached houses average £1,188,194, the widest premium of any type at 312.3% above England. Semi-detached stock is almost as scarce as detached in Hackney, concentrated on the residential streets away from the City fringe. When one appears it draws competition from owner-occupiers who have given up on a detached home, which is what keeps the premium so stretched.
Terraced houses average £965,862, 296.2% above the England terraced average. Hackney's Victorian and Georgian terraces, around Hackney Central, London Fields and Dalston, are the houses investors and families compete over most. The stock is larger than the detached and semi-detached pool, yet the average still sits close to a million pounds, which keeps terraced houses out of reach for a yield-led buy-to-let.
Flats and maisonettes average £529,976, the smallest premium at 147.0% above England. This is the property type that defines Hackney's rental market. Flats make up the bulk of transactions across every postcode and set the tone for both rents and yields. Even at the lowest premium of the four types, a Hackney flat still costs more than the all-property average in most English cities, which is the reality any investor here has to underwrite.
Price Per Square Foot in Hackney
Sold prices per square foot in Hackney run from £640 in N15 to £1,126 in EC2, a spread of £486. Measuring by the square foot strips out how big the homes are and isolates what each location actually commands, which is the cleanest way to see Hackney's north-to-City gradient. The table uses transaction-based sold prices and is ranked cheapest first.
| Rank | Area | Price Per Sq Ft |
|---|---|---|
| 1 | N15 (South Tottenham) | £640 |
| 2 | E9 (Homerton, Hackney Wick) | £741 |
| 3 | E1 (Whitechapel, Shoreditch) | £746 |
| 4 | E5 (Clapton) | £752 |
| 5 | E2 (Bethnal Green) | £755 |
| 6 | N16 (Stoke Newington) | £767 |
| 7 | N4 (Manor House, Finsbury Park) | £780 |
| 8 | E8 (Hackney Central, Dalston) | £805 |
| 9 | N1 (Hoxton, De Beauvoir Town) | £960 |
| 10 | EC1 (Old Street, Clerkenwell) | £973 |
| 11 | EC2 (Shoreditch) | £1,126 |
N15 (South Tottenham) at £640 per square foot is the cheapest space in the borough. N15 straddles the Hackney and Haringey boundary around Seven Sisters, and the lower per-foot price reflects both its northern position and a housing mix weighted away from the high-specification flats that lift the City-fringe figures.
Seven postcodes cluster between £741 and £805 per square foot. E9, E1, E5, E2, N16, N4 and E8 form the borough's residential core, where converted Victorian flats and period terraces set the prevailing rate. E8 (Hackney Central, Dalston) tops this band at £805, with the rest separated by little more than £60 a foot, a tight grouping that says these are close to interchangeable on price even where they feel different on the ground.
The three dearest postcodes by the square foot sit on the City fringe: N1 at £960, EC1 at £973 and EC2 at £1,126. These attract buyers paying for proximity to the Square Mile and the creative quarter around Shoreditch. EC2's £1,126 is more than three-quarters higher than N15's rate, the clearest single illustration of how far Hackney stretches inside one borough boundary.
For Sale Asking Prices in Hackney
Asking prices in Hackney range from £473,888 in N15 to £1,072,970 in EC2, a spread of £599,082, with a mean of £653,333 across all eleven postcodes. Seven postcodes sit below £620,000, forming the band where most workable buy-to-let activity is concentrated, while the four above it are the City-fringe and prime residential areas where owner-occupier demand sets the price. The table is ranked cheapest first.
| Rank | Area | Asking Price |
|---|---|---|
| 1 | N15 (South Tottenham) | £473,888 |
| 2 | E2 (Bethnal Green) | £535,142 |
| 3 | E9 (Homerton, Hackney Wick) | £536,246 |
| 4 | E5 (Clapton) | £575,438 |
| 5 | E1 (Whitechapel, Shoreditch) | £595,874 |
| 6 | N4 (Manor House, Finsbury Park) | £613,648 |
| 7 | E8 (Hackney Central, Dalston) | £617,267 |
| 8 | N16 (Stoke Newington) | £671,958 |
| 9 | N1 (Hoxton, De Beauvoir Town) | £733,679 |
| 10 | EC1 (Old Street, Clerkenwell) | £760,560 |
| 11 | EC2 (Shoreditch) | £1,072,970 |
N15 at £473,888 is the only Hackney postcode with an asking price below half a million pounds. It is the lowest entry point in the borough, though its position straddling the Haringey boundary means some of the stock technically falls outside the Hackney local authority. For buyers chasing a lower entry cost, N15 and the routes into below market value properties are where the maths starts to work in inner London.
E2 (£535,142) and E9 (£536,246) sit almost level on price but read very differently. E2 covers Bethnal Green, an established mix of ex-council blocks and Victorian conversions, while E9 covers Homerton and Hackney Wick, where the East Wick and Sweetwater regeneration is adding new-build stock. The £1,104 between them is statistically meaningless, but their growth records diverge sharply: E9 has posted 4.0% five-year growth against E2's -14.9%.
EC2 at £1,072,970 is 41% higher than the next dearest postcode, EC1 at £760,560. EC2's asking price reflects a small market of high-specification new-build apartments near Liverpool Street and Broadgate. With around five sales a month, a single large transaction can move the average, so the figure is best read as a price band rather than a precise mark.
House Price Growth in Hackney
Five-year capital growth in Hackney runs from -20.1% in EC1 to +4.0% in E9. The borough splits cleanly: four postcodes (E9, E5, E8, N4) have delivered positive five-year growth, while the City-fringe and several others have recorded losses. The table is ranked by five-year growth, the truest read on where capital has held. Capital growth is only part of the return, so it pays to factor in capital gains tax on property when you model an exit.
| Area | 1 Year | 3 Years | 5 Years |
|---|---|---|---|
| E9 (Homerton, Hackney Wick) | +1.7% | -4.2% | +4.0% |
| E5 (Clapton) | +9.9% | +8.9% | +3.4% |
| E8 (Hackney Central, Dalston) | -7.3% | -1.7% | +3.1% |
| N4 (Manor House, Finsbury Park) | +3.2% | -6.8% | +2.4% |
| E1 (Whitechapel, Shoreditch) | -5.0% | -9.9% | -0.4% |
| N15 (South Tottenham) | +1.0% | -2.7% | -0.4% |
| EC2 (Shoreditch) | +1.9% | -19.3% | -1.5% |
| N1 (Hoxton, De Beauvoir Town) | +1.4% | +0.8% | -2.2% |
| N16 (Stoke Newington) | -7.3% | -7.2% | -2.9% |
| E2 (Bethnal Green) | -2.9% | -3.5% | -14.9% |
| EC1 (Old Street, Clerkenwell) | -11.2% | -17.0% | -20.1% |
E9 (Homerton, Hackney Wick) leads on five-year growth at 4.0%, and is the only postcode to pair top-tier five-year growth with a top-three rental yield. E9 sits at the centre of the East Wick and Sweetwater regeneration on the Olympic Park fringe, where new homes and amenity have supported values where other postcodes have slipped.
E5 (Clapton) carries the strongest recent momentum at 9.9% over one year and 8.9% over three. Its 3.4% five-year figure trails E9, and its 9.9% one-year and 8.9% three-year readings are comfortably the strongest of the two postcodes (E5 and N1) that grew across both the one- and three-year windows. Clapton sits between the dearer E8 and the cheaper N15, with a mid-range asking price of £575,438.
EC1 (Old Street, Clerkenwell) has fallen 20.1% over five years and 11.2% in the last year alone, the deepest correction in the borough. EC1's new-build-heavy stock around Old Street was repriced hard as demand shifted away from dense City-fringe apartments. With around twelve sales a month and a 3% turnover rate, this is a thin market where the swing partly reflects low volume as well as a genuine reset in how the area is valued.
Monthly Property Sales in Hackney
Monthly sales across Hackney's eleven postcodes run from 5 in EC2 to 48 in N1. Turnover, monthly sales as a share of the homes advertised for sale, ranges from 2% in EC2 to 14% in N15 and N16. N15 and N16 lead Hackney on monthly sales relative to the homes advertised. The table is ranked by the busiest market first.
| Area | Sales Per Month | Turnover | Asking Price |
|---|---|---|---|
| N1 (Hoxton, De Beauvoir Town) | 48 | 7% | £733,679 |
| E1 (Whitechapel, Shoreditch) | 28 | 3% | £595,874 |
| N16 (Stoke Newington) | 28 | 14% | £671,958 |
| N4 (Manor House, Finsbury Park) | 28 | 7% | £613,648 |
| E2 (Bethnal Green) | 26 | 7% | £535,142 |
| E5 (Clapton) | 23 | 12% | £575,438 |
| E9 (Homerton, Hackney Wick) | 22 | 12% | £536,246 |
| E8 (Hackney Central, Dalston) | 19 | 6% | £617,267 |
| N15 (South Tottenham) | 18 | 14% | £473,888 |
| EC1 (Old Street, Clerkenwell) | 12 | 3% | £760,560 |
| EC2 (Shoreditch) | 5 | 2% | £1,072,970 |
N1 (Hoxton, De Beauvoir Town) is the busiest market at 48 sales a month. That is high for a single postcode and reflects N1's size and varied stock, from new-build apartments in Hoxton to period terraces in De Beauvoir Town. The 7% turnover is moderate, which points to a large pool of homes on the market at any time rather than listings clearing quickly.
N15 and N16 share the highest turnover at 14%. Despite N15 ranking near the bottom for total sales at 18 a month, fewer homes are advertised there, so each month's sales clear a larger share of them. N15's higher turnover reflects more monthly sales relative to advertised stock, despite its lower transaction count. E5 (Clapton) and E9 (Homerton) follow at 12%.
EC2's 5 sales a month and 2% turnover make it the thinnest market in the borough. Combined with an asking price above a million pounds, this is a postcode where individual transactions carry real weight and growth figures can swing on a handful of deals. EC1 at 12 sales and 3% turnover is similarly constrained, which is part of why its five-year decline reads so steep.
How Long Properties Take to Sell in Hackney
Exit speed splits Hackney sharply: N15 and N16 clear fastest at about 234 days, while EC2 sits for roughly 1,521 days at the current rate of sale. Days on market is the typical time a home is listed before it sells; the months of unsold stock shows how much for-sale supply is queued at the current pace. A yield figure says nothing about how long your money is tied up at the end, and in Hackney that exit cost varies more than the rent does. The table is ranked fastest first.
| Area | Avg Days to Sell | Months of Unsold Stock | Market |
|---|---|---|---|
| N15 (South Tottenham) | 234 | 7.7 | Balanced market |
| N16 (Stoke Newington) | 234 | 7.7 | Balanced market |
| E5 (Clapton) | 254 | 8.3 | Balanced market |
| E9 (Homerton, Hackney Wick) | 338 | 11.1 | Balanced market |
| E8 (Hackney Central, Dalston) | 435 | 14.3 | Buyer's market |
| N4 (Manor House, Finsbury Park) | 435 | 14.3 | Buyer's market |
| E2 (Bethnal Green) | 507 | 16.7 | Buyer's market |
| N1 (Hoxton, De Beauvoir Town) | 507 | 16.7 | Buyer's market |
| E1 (Whitechapel, Shoreditch) | 1014 | 33.3 | Buyer's market |
| EC1 (Old Street, Clerkenwell) | 1014 | 33.3 | Buyer's market |
| EC2 (Shoreditch) | 1521 | 50.0 | Buyer's market |
The northern residential postcodes move first. N15 and N16 carry about 7.7 months of unsold stock against EC2's 50, so selling in Stoke Newington is a far quicker job than selling near Liverpool Street. The City-fringe flats that look attractive on rent, E1, EC1 and EC2, are exactly where supply sits longest, with two to four years of stock at the current rate. That backlog is a real holding cost: a higher yield earned on a postcode you cannot exit quickly is not the bargain the rent column suggests.
What Type of Property Can You Buy in Hackney?
Flats dominate every Hackney postcode, from 68.6% of stock in N15 to 95.7% in EC1, with houses a small minority across the borough. The mix shapes which strategies fit where. The flats figure below combines purpose-built, converted and commercial-conversion units from 2021 Census records for each postcode. E5 (Clapton) has no stock-mix breakdown in the current data and is shown as not enough data.
| Area | Detached | Semi-detached | Terraced | Flats |
|---|---|---|---|---|
| E1 (Whitechapel, Shoreditch) | 1.3% | 2.7% | 11.6% | 84.3% |
| E2 (Bethnal Green) | 1.1% | 2.5% | 12.1% | 84.1% |
| E5 (Clapton) | Not enough data | Not enough data | Not enough data | Not enough data |
| E8 (Hackney Central, Dalston) | 1.4% | 4.6% | 13.0% | 80.6% |
| E9 (Homerton, Hackney Wick) | 2.4% | 4.8% | 20.2% | 72.1% |
| EC1 (Old Street, Clerkenwell) | 0.4% | 0.5% | 3.4% | 95.7% |
| EC2 (Shoreditch) | 0.2% | 1.4% | 3.1% | 95.3% |
| N1 (Hoxton, De Beauvoir Town) | 0.8% | 3.6% | 12.2% | 83.1% |
| N4 (Manor House, Finsbury Park) | 1.4% | 3.0% | 15.2% | 80.2% |
| N15 (South Tottenham) | 2.9% | 5.4% | 22.9% | 68.6% |
| N16 (Stoke Newington) | 1.8% | 4.7% | 20.0% | 73.3% |
EC1 and EC2 are the most flatted postcodes at 95.7% and 95.3%, which fits their role as City-fringe apartment markets and their thin transaction volumes. That is the stock driving the rental market in those postcodes, suited to single lets and professional sharers rather than family tenancies.
N15 and N16 hold the most terraced housing at 22.9% and 20.0%, the closest Hackney comes to a family-let market. Even there, flats remain better than two-thirds of the stock, so a Hackney buy-to-let is overwhelmingly a flat purchase wherever you look. The handful of detached and semi-detached homes scattered across the borough are owner-occupier territory, not investment stock.
Flats combine purpose-built, converted and commercial-conversion units. A small share of mobile and temporary dwellings is not shown, so rows may not total 100%.
Hackney Rental Market Analysis
Monthly rents in Hackney run from £1,851 in N15 to £3,631 in EC2, with gross rental yields from 4.1% to 5.7% across all eleven postcodes. Whether buy-to-let is worth it in Hackney comes down to which postcode you pick, so the sections below break down rents, yields, tenant affordability, the private rented sector and benefit rates one by one. Every postcode carries an active rental market, which is part of what makes the borough work for investors. Browse current buy-to-let property across London.
Average Rent & Gross Rental Yields in Hackney
Gross rental yields in Hackney run from 4.1% in EC2 and N16 to 5.7% in E1. A 5.7% yield is notable for an inner London borough where asking prices start above £470,000, and it sits with E1 rather than the cheapest postcode, which breaks the usual cheapest-equals-highest-yield pattern. The table is ranked by gross yield. To see how the figure is worked out, read our guide to working out rental yield.
| Area | Average Monthly Rent | Asking Price | Gross Yield |
|---|---|---|---|
| E1 (Whitechapel, Shoreditch) | £2,830 | £595,874 | 5.7% |
| E9 (Homerton, Hackney Wick) | £2,376 | £536,246 | 5.3% |
| E2 (Bethnal Green) | £2,307 | £535,142 | 5.2% |
| EC1 (Old Street, Clerkenwell) | £3,284 | £760,560 | 5.2% |
| N1 (Hoxton, De Beauvoir Town) | £3,055 | £733,679 | 5.0% |
| E5 (Clapton) | £2,282 | £575,438 | 4.8% |
| N4 (Manor House, Finsbury Park) | £2,437 | £613,648 | 4.8% |
| E8 (Hackney Central, Dalston) | £2,442 | £617,267 | 4.7% |
| N15 (South Tottenham) | £1,851 | £473,888 | 4.7% |
| EC2 (Shoreditch) | £3,631 | £1,072,970 | 4.1% |
| N16 (Stoke Newington) | £2,296 | £671,958 | 4.1% |
E1 (Whitechapel, Shoreditch) tops the borough at 5.7%, pairing a £2,830 rent with a £595,874 asking price. E1's rental market draws young professionals and sharers who want to be a short walk from the City and Shoreditch, and the rent has been strong enough to lift the yield clear of the rest. A 30% deposit of £178,762 buys into the borough's best income return.
E9 at 5.3% is the standout pairing of income and growth. It combines a top-three yield with the borough's strongest five-year capital growth at 4.0%, one of four postcodes in positive territory over that window, on a £536,246 asking price. E9 covers Homerton and Hackney Wick, where the East Wick and Sweetwater regeneration is adding rental stock and amenity, which is the engine behind both numbers.
EC2 and N16 share the lowest yield at 4.1%, for opposite reasons. EC2 charges the borough's highest rent at £3,631 a month, but the £1,072,970 asking price dilutes the return in a thin market. N16 (Stoke Newington) is far cheaper at £671,958 yet still lands at 4.1% because its rents sit lower than its prices would suggest. For a wider view of where the income is, see our analysis of London's highest rental yield areas.
Is Hackney Rent High?
Monthly rents in Hackney take between 44.9% and 88.1% of the local median gross monthly salary. These are high ratios even by London standards, well clear of the widely cited 30% affordability threshold in every postcode. The table shows each postcode's rent against Hackney's median gross monthly income.
The median gross weekly salary in Hackney is £951.60, which works out at £4,124 per month or £49,482 per year. That is above the London median of £892.60 a week and the Great Britain median of £752.40 a week. Data from the Nomis Labour Market Profile (ASHE 2025).
| Rank | Area | Rent as % of Income |
|---|---|---|
| 1 | EC2 (Shoreditch) | 88.1% |
| 2 | EC1 (Old Street, Clerkenwell) | 79.6% |
| 3 | N1 (Hoxton, De Beauvoir Town) | 74.1% |
| 4 | E1 (Whitechapel, Shoreditch) | 68.6% |
| 5 | E8 (Hackney Central, Dalston) | 59.2% |
| 6 | N4 (Manor House, Finsbury Park) | 59.1% |
| 7 | E9 (Homerton, Hackney Wick) | 57.6% |
| 8 | E2 (Bethnal Green) | 55.9% |
| 9 | N16 (Stoke Newington) | 55.7% |
| 10 | E5 (Clapton) | 55.3% |
| 11 | N15 (South Tottenham) | 44.9% |
EC2 rents take 88.1% of the median monthly salary. At £3,631 a month against a median gross income of £4,124, the figure on its own looks unworkable, but in practice EC2 tenants earn well above the borough median. The market here serves City workers and tech professionals whose individual or household incomes comfortably clear the local average, which is the only way these rents get paid.
Seven postcodes cluster between 55.3% and 68.6%. This middle band is the bulk of Hackney's rental market, where rents of £2,282 to £2,830 a month sit at roughly 55% to 69% of the median gross monthly salary. High by national standards, but normal for inner London, where sharers and dual-income households are the norm rather than a single earner renting alone.
N15 at 44.9% is the most affordable, the only postcode where rent stays below half the median monthly salary. At £1,851 a month it gives tenants more headroom than anywhere else in the borough, which tends to mean fewer arrears and longer tenancies, both of which matter to a landlord's bottom line.
How Big Is Hackney's Private Rented Sector?
The private rented sector is deepest on the City fringe, at 62.5% of households in EC2 and 42.8% in EC1, and shallowest in E9 at 27.2%. The share of homes already rented privately is a guide to the size of the established tenant pool, and in Hackney it tracks the City-worker geography more than the price. The table shows household tenure by postcode.
| Area | Owned Outright | Owned with Mortgage | Private Rented | Social Rented |
|---|---|---|---|---|
| EC2 (Shoreditch) | 12.7% | 11.0% | 62.5% | 12.6% |
| EC1 (Old Street, Clerkenwell) | 12.8% | 13.2% | 42.8% | 29.3% |
| E1 (Whitechapel, Shoreditch) | 8.4% | 13.3% | 42.0% | 34.2% |
| N4 (Manor House, Finsbury Park) | 11.9% | 17.5% | 41.0% | 27.6% |
| N15 (South Tottenham) | 13.3% | 18.3% | 40.8% | 25.2% |
| N16 (Stoke Newington) | 13.3% | 16.3% | 36.7% | 32.2% |
| E2 (Bethnal Green) | 8.1% | 14.5% | 36.6% | 38.5% |
| N1 (Hoxton, De Beauvoir Town) | 12.8% | 14.4% | 33.8% | 36.6% |
| E8 (Hackney Central, Dalston) | 9.1% | 15.6% | 31.8% | 40.5% |
| E9 (Homerton, Hackney Wick) | 9.5% | 17.7% | 27.2% | 42.6% |
| E5 (Clapton) | Not enough data | Not enough data | Not enough data | Not enough data |
EC2 stands out with 62.5% of households privately rented, the deepest rental market in the borough and a sign of how thoroughly the postcode is given over to professional renters near Liverpool Street. EC1, E1 and N4 follow in the low 40s, all areas with a large established tenant pool to let into. E5 (Clapton) has no tenure breakdown in the current data and is shown as not enough data.
At the other end, E8 and E9 have the smallest private rented sectors at 31.8% and 27.2%, paired with the borough's highest social-rented shares at 40.5% and 42.6%. A deep private rented sector points to an active lettings market and a wider pool of existing tenants, a different signal from yield: E9 pairs a thinner rented sector with one of Hackney's better income-and-growth combinations, while EC2 pairs the deepest rented sector with the lowest yield. On the rental side, every Hackney postcode currently reads as a landlord's market on the available demand data, with homes letting in roughly 33 to 60 days.
Local Housing Allowance Rates in Hackney
Hackney spans three Broad Rental Market Areas, so its Local Housing Allowance rates are not uniform: most of the borough falls in Inner East London, N1 sits in Inner North London, and N15 falls in the lower-rated Outer North London area. Local Housing Allowance is the most a tenant on housing support can claim towards rent, so it caps the state's contribution, not the rent a landlord can charge. Because Hackney crosses three areas, the rate that applies depends on the postcode. To check the current figure for a specific address, use the government's official Local Housing Allowance calculator.
| Property Size | Inner East London (weekly) | Inner North London (N1, weekly) | Outer North London (N15, weekly) |
|---|---|---|---|
| Shared accommodation | £160.98 | £163.00 | £136.93 |
| 1 bedroom | £331.39 | £331.39 | £264.66 |
| 2 bedrooms | £402.74 | £412.86 | £322.19 |
| 3 bedrooms | £497.10 | £497.10 | £390.08 |
| 4 bedrooms | £690.41 | £704.22 | £506.30 |
The Inner East London two-bedroom rate of £402.74 a week works out at about £1,745 a month, well below Hackney's open-market rents of £1,851 to £3,631, so a benefit-backed tenancy at the LHA rate sits under the borough's market rents in every postcode. The cheapest rates apply to N15 in the Outer North London area, where the two-bed rate of £322.19 a week is around £80 below the rest of the borough, which matches N15's lower asking prices and rents. The figures above are the June 2026 rates and are reset each April.

Buy-to-Let Considerations
Are House Prices High in Hackney? Price-to-Earnings Ratios
Buying in Hackney takes between 9.6 and 21.7 times the median annual salary, every postcode well above the national benchmark. This uses the Nomis Labour Market Profile for Hackney, which puts the median gross annual income for Hackney residents at £49,482.
The national benchmark for price-to-earnings is 7.4x (England's average sold price of £289,946 divided by the Great Britain median annual salary of £39,125). No Hackney postcode comes close to it, which is the plain reality of buying in inner London on local salary multiples. The table is ranked most affordable first.
| Rank | Area | Price-to-Earnings Ratio |
|---|---|---|
| 1 | N15 (South Tottenham) | 9.6x |
| 2 | E2 (Bethnal Green) | 10.8x |
| 3 | E9 (Homerton, Hackney Wick) | 10.8x |
| 4 | E5 (Clapton) | 11.6x |
| 5 | E1 (Whitechapel, Shoreditch) | 12.0x |
| 6 | N4 (Manor House, Finsbury Park) | 12.4x |
| 7 | E8 (Hackney Central, Dalston) | 12.5x |
| 8 | N16 (Stoke Newington) | 13.6x |
| 9 | N1 (Hoxton, De Beauvoir Town) | 14.8x |
| 10 | EC1 (Old Street, Clerkenwell) | 15.4x |
| 11 | EC2 (Shoreditch) | 21.7x |
N15 at 9.6x earnings is the closest Hackney comes to affordability in local salary terms. At £473,888 against a median annual salary of £49,482, it is still 30% above the national benchmark of 7.4x, but it is the only postcode in single-digit-plus territory and the natural starting point for a salary-led purchase.
EC2 at 21.7x earnings is in a different category entirely. At £1,072,970, this is a market driven by investment and overseas capital rather than local salary multiples. Mortgage affordability worked from a single Hackney income has little bearing in a postcode where most buyers are cash purchasers, so the ratio is more a measure of how detached the price is from the local wage than a guide to who can borrow against it.
Deposit Requirements in Hackney
A 30% deposit on a buy-to-let property in Hackney runs from £142,166 in N15 to £321,891 in EC2. The gap between the cheapest and most expensive deposit is £179,725, more than enough to fund a second deposit in N15. These figures are the capital needed alongside a 70% loan-to-value buy-to-let mortgage, before the stamp duty and other costs. The table is ranked cheapest first.
| Rank | Area | 30% Deposit Required |
|---|---|---|
| 1 | N15 (South Tottenham) | £142,166 |
| 2 | E2 (Bethnal Green) | £160,543 |
| 3 | E9 (Homerton, Hackney Wick) | £160,874 |
| 4 | E5 (Clapton) | £172,631 |
| 5 | E1 (Whitechapel, Shoreditch) | £178,762 |
| 6 | N4 (Manor House, Finsbury Park) | £184,094 |
| 7 | E8 (Hackney Central, Dalston) | £185,180 |
| 8 | N16 (Stoke Newington) | £201,587 |
| 9 | N1 (Hoxton, De Beauvoir Town) | £220,104 |
| 10 | EC1 (Old Street, Clerkenwell) | £228,168 |
| 11 | EC2 (Shoreditch) | £321,891 |
N15's £142,166 is the cheapest way into the borough, buying a 4.7% yield with the most affordable rents against local income. Stepping up to E1 costs around £36,000 more and buys the borough's top yield at 5.7%, the clearest example in Hackney of a higher deposit earning a better return rather than just a bigger price.
E2 and E9 sit within £331 of each other on the deposit, a difference of well under one per cent, but they are not the same investment. E9 brings the borough's strongest five-year growth at 4.0% and a higher yield at 5.3%, while E2 has the deeper price correction behind it at -14.9% over five years. Near-identical capital outlay, very different track records.

What the Hackney Data Tells Buy-to-Let Investors
In Hackney the best yield and the cheapest entry are in different postcodes, so the first decision is which one matters more to you. E1 (Whitechapel, Shoreditch) tops the borough at 5.7% on a £595,874 asking price, a £178,762 deposit at 30%, buying into a rental market of City and tech workers a short walk from the Square Mile. If the goal is income, that is where it sits. For current investment property in Hackney across these postcodes, see our listings.
E9 (Homerton, Hackney Wick) is the one postcode where income and growth meet. Its 5.3% yield is among the borough's best, and it carries the strongest five-year capital growth at 4.0%, the best of the four postcodes in positive territory, supported by the 1,500 homes being delivered at East Wick and Sweetwater. A 30% deposit there is £160,874, near the bottom of the borough range, so the entry cost is workable as well.
The northern postcodes earn their place differently. N15 (South Tottenham) is the cheapest entry at £473,888 with the most affordable rents and the fastest exit, around 234 days on market, which makes it the lowest-friction way into Hackney even at a 4.7% yield. N16 (Stoke Newington) offers strong turnover but a thinner 4.1% return where rents lag prices.
The City-fringe postcodes carry the warnings. EC1 has fallen 20.1% over five years and EC2 sits on roughly four years of unsold stock at the current rate of sale; both are thin, volatile markets where the headline rent flatters the real return once you factor in the time and cost of getting back out. In a buyer's market like the City fringe, the value is more likely to be found through off-market property in Hackney than at full asking. Hackney also runs a selective licensing scheme in parts of the borough, so landlords letting privately in designated areas need a council licence. Check the current designated wards on Hackney Council's property licensing pages.
How Hackney Compares
Hackney's mean asking price of £653,333 is the second-highest of five East and North London boroughs compared here, and its top yield of 5.7% is the second-lowest, sitting just above Islington. The comparison below places Hackney alongside four neighbouring boroughs. Mean asking price and mean monthly rent are simple averages across each borough's postcodes; top gross yield is the single highest postcode yield in each. The table is ranked cheapest first.
| Location | Mean Asking Price | Mean Monthly Rent | Mean Gross Yield | Top Yield (postcode) |
|---|---|---|---|---|
| Newham | £437,735 | £2,189 | 6.0% | 6.8% (IG11) |
| Waltham Forest | £518,892 | £1,997 | 4.6% | 6.3% (E15) |
| Haringey | £608,827 | £2,145 | 4.2% | 6.1% (N17) |
| Hackney | £653,333 | £2,617 | 4.8% | 5.7% (E1) |
| Islington | £699,752 | £2,753 | 4.7% | 5.3% (EC1, N19) |
Newham offers the lowest entry at £437,735 and the highest top yield at 6.8%. That is £215,598 cheaper than Hackney's mean asking price for a 1.1 percentage point yield advantage. The trade-off is location and tenant profile: Newham sits further from the City and Shoreditch and commands lower rents, £2,189 against Hackney's £2,617.
Waltham Forest and Haringey both undercut Hackney on price and beat it on yield. Waltham Forest comes in at £518,892 with a 6.3% top yield, and Haringey at £608,827 with 6.1%. Each gives up some of Hackney's rental strength in the process, with mean rents of £1,997 and £2,145 against Hackney's £2,617, in exchange for a cheaper way in.
Islington is the only borough dearer than Hackney, at £699,752 with a 5.3% top yield. Hackney sits just below it on price and just above it on yield, and the two share the N1 postcode at their boundary. Of the three cheaper boroughs, Hackney commands the highest mean rent at £2,617 a month, ahead of Haringey, Waltham Forest and Newham, with only pricier Islington renting higher at £2,753. For a data-led comparison across the whole country, see our best buy-to-let locations guide.
Frequently Asked Questions
What are buy-to-let prices, yields and growth in Hackney?
Asking prices range from £473,888 in N15 to £1,072,970 in EC2, with a mean of £653,333 across the eleven postcodes; the average sold price is £611,039. Local median earnings are £49,482 a year, above the London figure of £46,415, and employment is 79.0%. Gross yields range from 4.1% to 5.7%, with E1 recording the highest figure.
Five-year borough-wide growth is 3.6%, while individual postcodes range from 4.0% growth in E9 to a 20.1% fall in EC1. Monthly rents range from £1,851 to £3,631 and gross yields from 4.1% to 5.7%, alongside a mixed recent capital-growth picture.
What are the best areas in Hackney for property investment?
The postcodes split fairly cleanly. For income, E1 (Whitechapel, Shoreditch) leads on yield at 5.7%. E9 (Homerton, Hackney Wick) is close behind at 5.3% and also carries the borough's strongest five-year growth, which is what makes it the standout all-rounder.
For the lowest entry, N15 (South Tottenham) is the cheapest postcode at £473,888 with the most affordable rents and the fastest exit. At the other end, EC1 and EC2 on the City fringe look tempting on rent but carry deep recent price falls and very thin, slow markets, so they suit a specific capital-led buyer rather than a yield-focused one.
What are the highest-yielding postcodes in Hackney?
The top of the table is E1 (Whitechapel, Shoreditch), at a 5.7% gross yield on a £2,830 monthly rent against a £595,874 asking price. Behind it sit E9 (Homerton, Hackney Wick) at 5.3% and then E2 (Bethnal Green) and EC1 (Old Street, Clerkenwell) at 5.2%. The lowest yields are 4.1% in EC2 (Shoreditch) and N16 (Stoke Newington), where rents lag prices, in EC2's case because the £1,072,970 asking price dilutes even the borough's highest rent of £3,631 a month.
How much has property in Hackney grown over the last five years?
Across the borough it is 3.6% over five years, from £590,061 in March 2021 to £611,039 in March 2026, but that single figure hides a wide postcode split. E9 (Homerton, Hackney Wick) is up 4.0%, E5 (Clapton) 3.4% and E8 (Hackney Central, Dalston) 3.1%, while EC1 (Old Street, Clerkenwell) has fallen 20.1% and E2 (Bethnal Green) 14.9% over the same period. Prices peaked at an all-time high of £638,941 in November 2023 and have eased back since. Over 30 years Hackney has grown 772.9% from £70,003 in March 1996, but most of that was earned before 2016.
What type of property is most common in Hackney?
Flats, overwhelmingly, in every postcode. They run from 68.6% of the stock in N15 (South Tottenham) up to 95.7% in EC1 (Old Street, Clerkenwell), combining purpose-built blocks and Victorian conversions. Terraced houses are the next most common type, most concentrated in N15 and N16 at around 22% and 20%, the closest the borough comes to a family-house market. Detached and semi-detached homes are rare across Hackney and command heavy premiums when they appear, so a buy-to-let here is almost always a flat purchase.
How much deposit do I need to buy in Hackney?
Most buy-to-let lenders want a deposit of around 30%, and in Hackney that is a serious sum. It runs from £142,166 in N15 (South Tottenham) at the cheap end up to £321,891 in EC2 (Shoreditch) at the top. The mid-range postcodes that carry the best yields, E2, E9, E5, E1, N4 and E8, sit between roughly £160,000 and £185,000. On top of the deposit, factor in stamp duty, legal fees and survey costs, which add a meaningful amount on inner London prices.
What are the Local Housing Allowance rates in Hackney?
Hackney crosses three Broad Rental Market Areas, so the rate depends on the postcode. Most of the borough falls in Inner East London, where the June 2026 rates run from £160.98 a week for a shared room to £690.41 for a four-bed, with a two-bed at £402.74. N1 sits in Inner North London at slightly higher rates, while N15 falls in the lower Outer North London area, where the two-bed rate is £322.19 a week. Those figures are the most a tenant on housing support can claim, so they fix what the benefit will meet; market rents can sit above or below them.
How do I buy an investment property in Hackney?
Start by deciding whether you are buying for income or for the long term, because that points you at a different postcode. E1 (Whitechapel, Shoreditch) is the top-yielding entry at 5.7%, E9 (Homerton, Hackney Wick) pairs a 5.3% yield with the borough's strongest five-year growth, and N15 (South Tottenham) is the cheapest way in. Budget for a 30% deposit, which runs from £142,166 to £321,891 across the postcodes.
Beyond what is openly listed, plenty of investors buy below asking through off-market property and below market value properties, which is often where the value sits in a slower City-fringe market. To see what is available now, browse current investment property listings.
Ready to buy property?
Browse investment properties with prices and gross yields shown for each opportunity.
Get property alerts