Where to Buy Property Investments in Hastings: Yields of 4.9%
Hastings is a coastal borough in East Sussex on England's south coast. Gross rental yields range from 3.4% to 4.9% across the five postcodes with rental data, with TN38 delivering the highest returns. Average sold prices sit 17.6% below the England average, and the borough's population grew 0.82% to 90,995 between the 2011 and 2021 censuses.
Hastings' average sold price of £240,579 places it among the more affordable locations in the South East, sitting 36.5% below the regional average of £378,800. The market has corrected 15.1% from its September 2022 peak of £283,459. Asking prices start from £289,017 in TN38, making Hastings an accessible entry point for buy-to-let property in the South East. Rental data is available for 5 of the borough's 6 postcodes.
This guide covers all 6 Hastings postcodes (TN33, TN34, TN35, TN37, TN38, TN39) under the Hastings Borough Council local authority (ONS code E07000062) in East Sussex. Investors comparing options in the region may also consider Eastbourne, Brighton, Crawley, or Maidstone. Browse all our Sussex and South East location guides.
Article updated: March 2026
Hastings Buy-to-Let Market Overview 2026
Hastings offers South East pricing at a significant discount to the regional average, with the market currently in a correction phase from its 2022 pandemic peak.
- Average sold price: £240,579 (17.6% below England's £291,865)
- Asking price range: £289,017 (TN38) to £496,249 (TN33)
- Rental yields: 3.4% (TN39) to 4.9% (TN38) across postcodes with rental data
- Rental income: Monthly rents from £1,044 (TN34) to £1,316 (TN35)
- Price per sq ft: House prices from £311/sq ft (TN37) to £378/sq ft (TN33)
- Market activity: Sales ranging from 12 per month (TN33) to 35 per month (TN34)
- Deposit requirements: 30% deposits range from £86,705 (TN38) to £148,875 (TN33)
- Affordability ratios: Property prices from 8.3 to 14.3 times Hastings' median annual salary of £34,714
Contents

-
by Robert Jones, Founder of Property Investments UK
With two decades in UK property, Rob has been investing in buy-to-let since 2005, and uses property data to develop tools for property market analysis.

Property Data Sources
Our location guide relies on diverse, authoritative datasets including:
- HM Land Registry UK House Price Index
- Ministry of Housing, Communities and Local Government
- Ordnance Survey Data Hub
- Propertydata.co.uk
We update our property data quarterly to ensure accuracy. Last update: March 2026. All data is presented as provided by our sources without adjustments or amendments.
Why Invest in Hastings?
Hastings' population reached 90,995 in the 2021 Census, an increase of just 0.82% from 90,254 in 2011. That is one of the slower growth rates among English local authorities. Low population growth can limit the pace of new housing demand, but it also means existing housing stock faces less pressure from new build competition.
The employment rate in Hastings stands at 68.7%, with median gross annual earnings of £34,714. That is significantly below both the South East regional median (£41,616 per year based on £800.30 per week) and the Great Britain median (£39,125 per year based on £752.40 per week). Lower local earnings widen the gap between what residents earn and what property costs, which has implications for both rental demand and buyer competition in the area.
Hastings' economy is anchored by health and social work, education, retail, accommodation and food services, and public administration. The town's position on the East Sussex coast generates seasonal tourism activity that supports the hospitality sector.
Hastings Economic Summary
- Population: 90,995 (2021 Census). Growth of 0.82% from 2011.
- Median annual salary: £34,714 (Hastings), £41,616 (South East), £39,125 (Great Britain)
- Employment rate: 68.7% (Hastings)
- Unemployment rate: Not available (APS sample too small)
- Key employment sectors: Health and social work, education, retail, accommodation and food services, public administration
Source: ONS Census 2021, Nomis Labour Market Profile (ASHE 2025)
Regeneration and Investment in Hastings
Over £44M in disclosed public funding is directed at Hastings through three government-backed programmes targeting the town centre, housing delivery, and economic growth.
- Hastings Town Deal (In progress, £24.3M): Part of the government's Towns Fund, this programme focuses on town centre transformation including public realm improvements, creative workspace, and heritage building restoration in central Hastings. New commercial and cultural space increases footfall and tenant demand in the TN34 area. Updates at Hastings Town Deal.
- Homes England Strategic Partnership (In progress): A partnership between Homes England, Hastings Borough Council, and Sea Change Sussex to regenerate town centre sites, convert vacant commercial properties to residential use, and deliver new housing. Increased housing delivery and commercial-to-residential conversion expand the rental market supply base in central Hastings. Updates at GOV.UK.
- Levelling Up Partnerships (In progress, £20M): Government funding for Hastings and Bexhill as part of a wider £40M East Sussex allocation, targeting economic growth, skills development, and place-based improvements. Broader economic investment supports employment retention and population stability across the borough. Updates at GOV.UK.

Hastings Property Market Analysis
When was the last house price crash in Hastings?
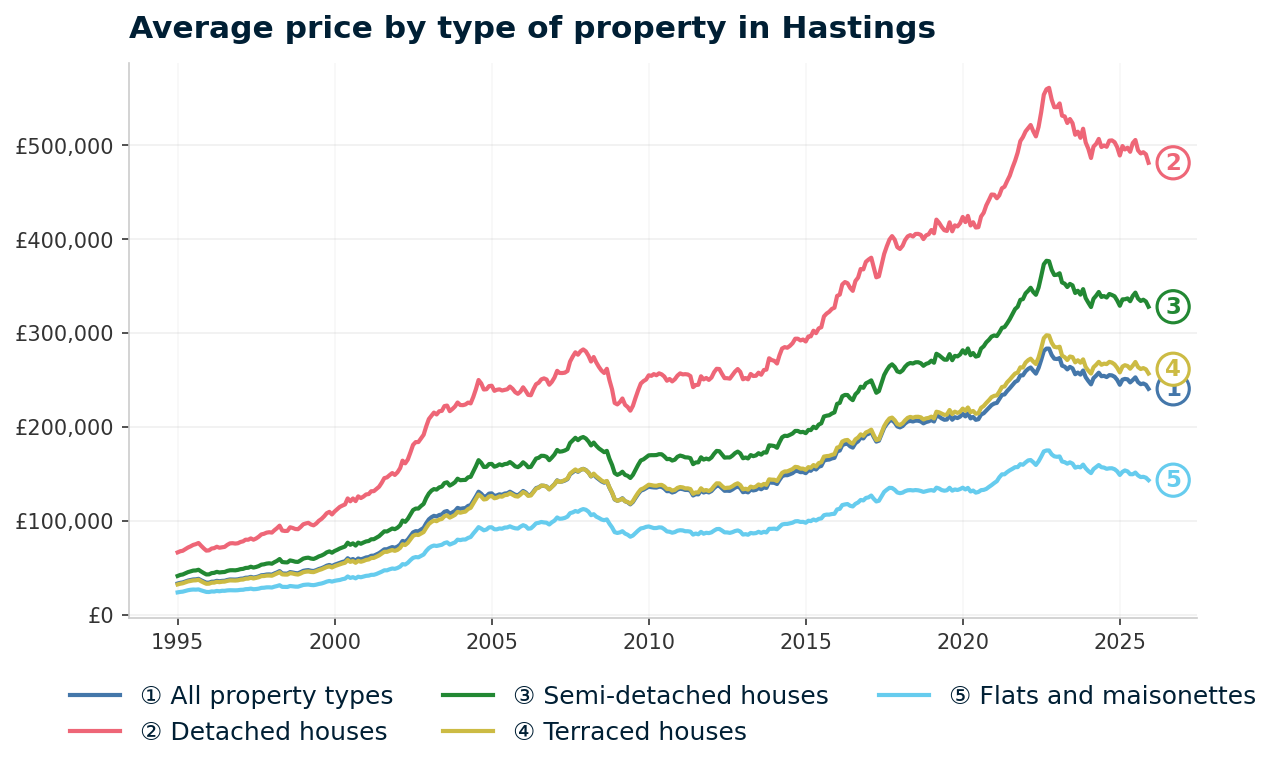
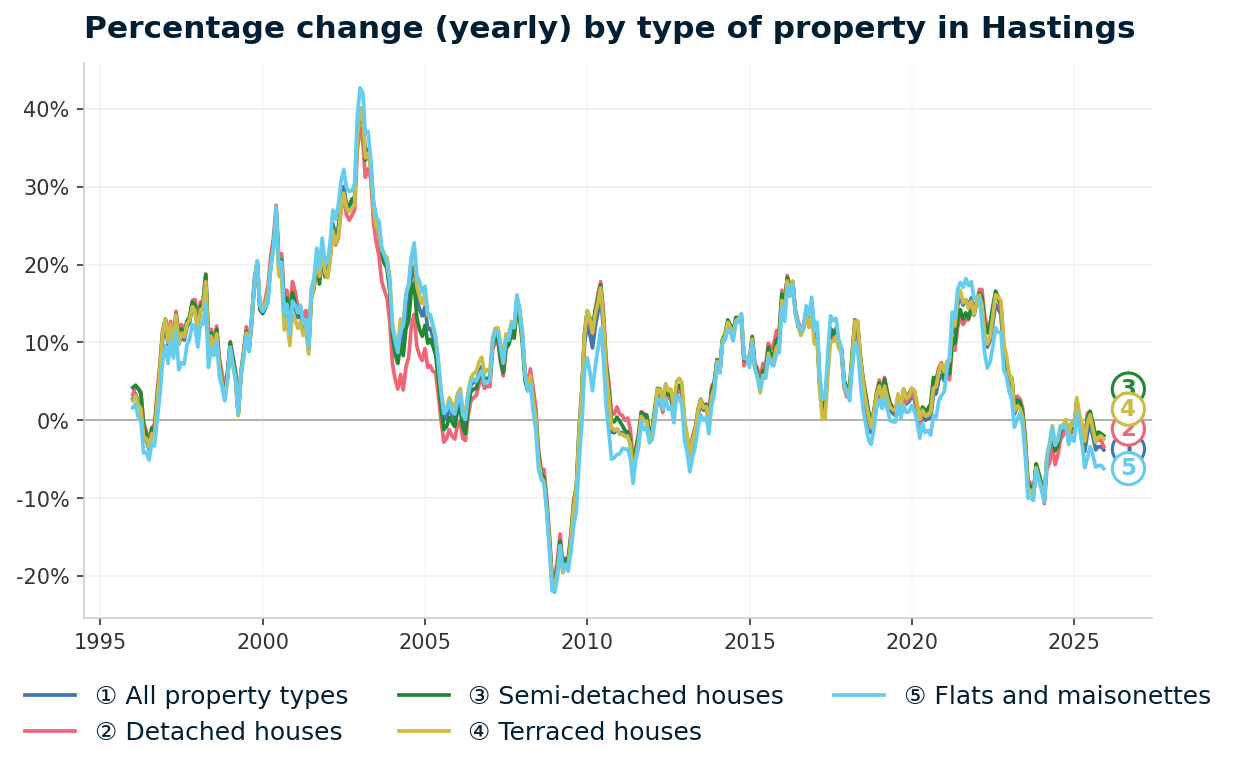
Hastings property prices peaked at £155,267 in December 2007 and fell 24.3% to a trough of £117,468 by June 2009. That decline was sharper than both the England average (18.2%) and the South East average (20.0%). Recovery to the pre-crash peak took over seven years.
- 1995 to 2007 (The Boom): Prices started at £33,083 in January 1995. By 2000 they had reached £53,153 (+60.7%). The sharpest acceleration came between 2000 and 2005, when prices surged to £129,176. Growth continued to the pre-crash peak of £155,267 in December 2007, a 369% increase from 1995.
- 2008 to 2009 (Financial Crisis): From the December 2007 peak of £155,267, prices fell to £117,468 by June 2009. That is a 24.3% decline. The worst single annual change reading was -21.3% in January 2009. England peaked at £183,883 in September 2007 and troughed at £150,438 in March 2009 (decline of 18.2%). The South East peaked at £240,647 in October 2007 and troughed at £192,598 in March 2009 (decline of 20.0%). Hastings fell harder than both benchmarks.
- 2010 to 2013 (Stagnation): Prices bounced to £136,282 by January 2010 but drifted back down to £130,417 by January 2013. For six years after the crash, Hastings remained below its pre-crash peak.
- 2014 to 2016 (Recovery): Growth returned from 2014. Hastings first passed its pre-crash peak in April 2015 when prices reached £156,026. That was over seven years after the December 2007 peak. By January 2017, prices had climbed to £192,645.
- 2017 to 2019 (Pre-pandemic growth): Steady growth took prices from £192,645 (January 2017) to £210,914 (December 2019), a 9.5% increase over three years. Annual growth remained positive throughout this period.
- 2020 to 2022 (Pandemic surge): Prices accelerated from £213,915 (January 2020) to an all-time peak of £283,459 in September 2022, a 32.5% increase in under three years. The strongest annual growth reading during this period was 15.3% in January 2022.
- 2023 (Rate correction begins): Prices began correcting from the September 2022 peak. Annual growth fell from 5.0% in January 2023 to 0.5% by June 2023 as higher mortgage rates took effect.
- 2024 to present: The correction continued. By January 2024, annual growth had reached -8.6%. Prices stand at £240,579 as of December 2025 with an annual change of -3.8%. That represents a 15.1% decline from the September 2022 all-time peak of £283,459.
Long-term growth from January 1995 to December 2025:
- 5 years (December 2020 to December 2025): 7.8% (£223,223 to £240,579)
- 10 years (December 2015 to December 2025): 44.0% (£167,033 to £240,579)
- 15 years (December 2010 to December 2025): 80.7% (£133,146 to £240,579)
- 20 years (December 2005 to December 2025): 86.2% (£129,218 to £240,579)
- 30 years (December 1995 to December 2025): 608.4% (£33,963 to £240,579)
The 2008 crash took 24.3% off Hastings prices and the recovery to pre-crash levels took over seven years. The current correction from the September 2022 peak is following a different pattern. Prices have dropped 15.1% over 39 months rather than the abrupt crash seen in 2008 to 2009. Interest rate rises, not a banking crisis, are the driver. Hastings prices at £240,579 remain 54.9% above the pre-crash peak of £155,267 set in December 2007.
Source: HM Land Registry House Price Index for Hastings, January 1995 to December 2025.
Thinking of Buying?
We have off-market investment properties averaging 8%+ annual yield.
View Property DealsSold House Prices in Hastings
Hastings' average sold price of £240,579 sits 17.6% below the England average of £291,865. But the headline figure masks a striking split by property type. Detached, semi-detached, and terraced houses in Hastings are all priced above their England equivalents. The entire discount is concentrated in flats and maisonettes, which sit 34.7% below the national average.
| Property Type | Hastings Average | England Average | Difference |
|---|---|---|---|
| Detached houses | £481,487 | £471,667 | +2.1% |
| Semi-detached houses | £328,073 | £289,135 | +13.5% |
| Terraced houses | £256,882 | £244,830 | +4.9% |
| Flats and maisonettes | £143,222 | £219,340 | -34.7% |
| All property types | £240,579 | £291,865 | -17.6% |
Detached houses at £481,487 are 2.1% above the England average of £471,667. Detached properties make up a smaller share of the Hastings housing stock, concentrated in the borough's outer areas and the rural fringes covered by TN33 and TN35.
Semi-detached houses at £328,073 sit 13.5% above England's £289,135. This is the widest positive gap of any property type in Hastings. The South East's higher baseline and the desirability of family-sized housing along the coast both contribute to this premium.
Terraced houses at £256,882 are 4.9% above England's £244,830. Victorian and Edwardian terraces are a significant part of Hastings' central housing stock, particularly in TN34 and TN37.
Flats and maisonettes at £143,222 are 34.7% below England's £219,340. Coastal towns typically carry a large flat stock, much of it in converted period buildings. This flat weighting pulls the overall Hastings average below England despite three of four property types sitting above their national benchmarks.
Property Data Sources
Our location guide relies on diverse, authoritative datasets including:
- HM Land Registry UK House Price Index
- Ministry of Housing, Communities and Local Government
- Ordnance Survey Data Hub
- Propertydata.co.uk
We update our property data quarterly to ensure accuracy. Last update: March 2026. All data is presented as provided by our sources without adjustments or amendments.
Price Per Square Foot in Hastings
TN37 (St Leonards-on-Sea) and TN34 (Hastings Town Centre, Ore) share the lowest per-square-foot cost at £311 and £312 respectively. TN33 (Battle, Sedlescombe) commands the highest rate at £378 per square foot. The full range across all six postcodes spans just £67.
| Rank | Area | Price per sq ft |
|---|---|---|
| 1 | TN37 (St Leonards-on-Sea) | £311 |
| 2 | TN34 (Hastings Town Centre, Ore) | £312 |
| 3 | TN38 (St Leonards West, Maze Hill) | £325 |
| 4 | TN35 (Ore, Fairlight, Pett) | £328 |
| 5 | TN39 (Bexhill-on-Sea) | £338 |
| 6 | TN33 (Battle, Sedlescombe) | £378 |
The £1 gap between TN37 and TN34 at the bottom of the table is essentially negligible. Both postcodes offer the most space per pound in Hastings. TN38, which leads the borough on yield, sits mid-table at £325 per square foot. TN33's higher rate at £378 reflects the larger detached properties in the Battle and Sedlescombe area rather than a denser or more expensive housing type.
For Sale Asking Prices in Hastings
A £207,232 gap separates the cheapest and most expensive Hastings postcodes. Asking prices range from £289,017 in TN38 (St Leonards West, Maze Hill) to £496,249 in TN33 (Battle, Sedlescombe), with a six-postcode mean of £366,342.
| Rank | Area | Asking Price |
|---|---|---|
| 1 | TN38 (St Leonards West, Maze Hill) | £289,017 |
| 2 | TN37 (St Leonards-on-Sea) | £305,451 |
| 3 | TN34 (Hastings Town Centre, Ore) | £322,584 |
| 4 | TN35 (Ore, Fairlight, Pett) | £384,548 |
| 5 | TN39 (Bexhill-on-Sea) | £400,204 |
| 6 | TN33 (Battle, Sedlescombe) | £496,249 |
Three postcodes sit below £325,000: TN38, TN37, and TN34. These three cover St Leonards-on-Sea and Hastings town centre, the borough's core urban area. TN35 and TN39 step up to the £384,000 to £400,000 range, while TN33 at nearly half a million reflects the rural, detached-heavy character of the Battle and Sedlescombe area.

House Price Growth in Hastings
The short-term and long-term growth figures for Hastings tell different stories. Over five years, TN37 (St Leonards-on-Sea) leads at 17.3%, while TN38 (St Leonards West, Maze Hill) recorded 14.6%. Over one year, TN35 (Ore, Fairlight, Pett) is the only postcode showing strong positive growth at 6.4%, while TN38 sits at -3.2% and TN33 at -1.9%.
| Area | 1 Year | 3 Years | 5 Years |
|---|---|---|---|
| TN37 (St Leonards-on-Sea) | 0.7% | 4.0% | 17.3% |
| TN38 (St Leonards West, Maze Hill) | -3.2% | -4.8% | 14.6% |
| TN39 (Bexhill-on-Sea) | 0.1% | 3.1% | 12.2% |
| TN35 (Ore, Fairlight, Pett) | 6.4% | -4.6% | 10.8% |
| TN34 (Hastings Town Centre, Ore) | 2.1% | 0.4% | 8.1% |
| TN33 (Battle, Sedlescombe) | -1.9% | 5.5% | -1.3% |
TN37's 17.3% five-year growth stands out as the strongest across the borough. This is a postcode with mid-range asking prices (£305,451) and a 4.1% yield. It combines long-term appreciation with reasonable entry costs. TN38 follows at 14.6% over five years, though the negative one-year (-3.2%) and three-year (-4.8%) figures show the post-2022 correction has hit this postcode harder in the short term.
TN33 is the only postcode with negative five-year growth at -1.3%. At an asking price of £496,249, it is also the most expensive postcode in Hastings with no rental data available. TN35's 6.4% one-year growth is the strongest short-term figure, but its -4.6% three-year decline shows recent volatility.
Monthly Property Sales in Hastings
TN34 (Hastings Town Centre, Ore) records the highest monthly sales volume at 35 transactions per month. Turnover rates vary significantly across the borough: TN38 at 29% and TN39 at 26% show particularly high churn compared to TN33's 7% and TN35's 8%.
| Area | Sales per Month | Turnover | Asking Price |
|---|---|---|---|
| TN34 (Hastings Town Centre, Ore) | 35 | 10% | £322,584 |
| TN39 (Bexhill-on-Sea) | 29 | 26% | £400,204 |
| TN38 (St Leonards West, Maze Hill) | 27 | 29% | £289,017 |
| TN37 (St Leonards-on-Sea) | 22 | 10% | £305,451 |
| TN35 (Ore, Fairlight, Pett) | 17 | 8% | £384,548 |
| TN33 (Battle, Sedlescombe) | 12 | 7% | £496,249 |
TN38's combination of the lowest asking price (£289,017) and the highest turnover (29%) points to a liquid market. Properties in this postcode change hands more frequently than anywhere else in the borough. At the other end, TN33 (Battle, Sedlescombe) has the lowest volume (12 per month) and lowest turnover (7%), consistent with a higher-priced, less liquid rural market where properties take longer to sell.
Property Data Sources
Our location guide relies on diverse, authoritative datasets including:
- HM Land Registry UK House Price Index
- Ministry of Housing, Communities and Local Government
- Ordnance Survey Data Hub
- Propertydata.co.uk
We update our property data quarterly to ensure accuracy. Last update: March 2026. All data is presented as provided by our sources without adjustments or amendments.

Hastings Rental Market Analysis
For investors weighing up whether rental property is a worthwhile investment in Hastings, the data below breaks down average monthly rents and gross rental yields across the borough's postcodes.
Five of six Hastings postcodes have rental data, with monthly rents ranging from £1,044 (TN34) to £1,316 (TN35) and yields from 3.4% (TN39) to 4.9% (TN38). If you are looking to build a property portfolio in the South East, Hastings' sold prices 17.6% below the England average create lower entry costs than much of the region.
Average Rent & Gross Rental Yields in Hastings
TN38 (St Leonards West, Maze Hill) delivers the highest gross rental yield in Hastings at 4.9%, combining £1,170 per month in rent with the borough's lowest asking price of £289,017. Three postcodes cluster between 3.9% and 4.1%, while TN39 (Bexhill-on-Sea) sits at 3.4%. TN33 (Battle, Sedlescombe) has no rental data available.
| Area | Monthly Rent | Asking Price | Gross Yield |
|---|---|---|---|
| TN38 (St Leonards West, Maze Hill) | £1,170 | £289,017 | 4.9% |
| TN35 (Ore, Fairlight, Pett) | £1,316 | £384,548 | 4.1% |
| TN37 (St Leonards-on-Sea) | £1,054 | £305,451 | 4.1% |
| TN34 (Hastings Town Centre, Ore) | £1,044 | £322,584 | 3.9% |
| TN39 (Bexhill-on-Sea) | £1,127 | £400,204 | 3.4% |
| TN33 (Battle, Sedlescombe) | Not enough data | £496,249 | Not enough data |
TN38's 4.9% yield is driven by its low asking price rather than exceptionally high rent. TN35 commands the highest monthly rent at £1,316 but its higher asking price of £384,548 compresses the yield to 4.1%. TN37 achieves the same 4.1% yield at a lower price point (£305,451 vs £384,548), making it a lower entry cost route to a comparable return. TN39 has the weakest yield at 3.4%, where a £400,204 asking price dilutes £1,127 per month in rent.
Is Hastings Rent High?
Rent in Hastings absorbs between 36.1% and 45.5% of gross monthly income across the five postcodes with rental data. The table below shows how much of a resident's gross monthly income goes to rent in each postcode, using the local authority median salary rather than postcode-level earnings.
The median gross weekly salary in Hastings is £667.60, which equates to £2,893 per month or £34,714 per year. This is below the South East regional median of £800.30 per week and the Great Britain median of £752.40 per week. Data from the Nomis Labour Market Profile (ASHE 2025).
| Rank | Area | Rent as % of Income |
|---|---|---|
| 1 | TN35 (Ore, Fairlight, Pett) | 45.5% |
| 2 | TN38 (St Leonards West, Maze Hill) | 40.5% |
| 3 | TN39 (Bexhill-on-Sea) | 38.9% |
| 4 | TN37 (St Leonards-on-Sea) | 36.4% |
| 5 | TN34 (Hastings Town Centre, Ore) | 36.1% |
| — | TN33 (Battle, Sedlescombe) | Not enough data |
TN35 takes the highest share of income at 45.5%. This reflects TN35's higher rents (£1,316 per month, the most expensive in Hastings) rather than a postcode-specific earnings difference. The Nomis earnings data covers the entire Hastings local authority, not individual postcodes. All five postcodes with rental data sit above 36% of income, which is consistent with Hastings' lower median salary compared to the South East as a whole.
Thinking of Buying?
We have off-market investment properties averaging 8%+ annual yield.
View Property DealsBuy-to-Let Considerations
Are House Prices High? Price-to-Earnings Ratios
Purchasing a property in Hastings requires between 8.3 and 14.3 times the median annual salary. This is based on the Nomis Labour Market Profile for Hastings showing the median gross annual income for Hastings residents is £34,714.
The England benchmark is 7.5 times the Great Britain median annual salary (£291,865 / £39,125). All six Hastings postcodes sit above this benchmark.
| Rank | Area | Price-to-Earnings |
|---|---|---|
| 1 | TN38 (St Leonards West, Maze Hill) | 8.3x |
| 2 | TN37 (St Leonards-on-Sea) | 8.8x |
| 3 | TN34 (Hastings Town Centre, Ore) | 9.3x |
| 4 | TN35 (Ore, Fairlight, Pett) | 11.1x |
| 5 | TN39 (Bexhill-on-Sea) | 11.5x |
| 6 | TN33 (Battle, Sedlescombe) | 14.3x |
TN38 at 8.3 times local earnings is closest to the England benchmark of 7.5. TN37 and TN34 also fall within a relatively narrow range at 8.8 and 9.3 respectively. The gap to TN33 (14.3x) reflects the higher property prices in the Battle and Sedlescombe area, where the larger detached housing stock pushes average asking prices to nearly £500,000.
Deposit Requirements in Hastings
A 30% deposit on the cheapest Hastings postcode, TN38 (St Leonards West, Maze Hill), comes to £86,705. The range extends to £148,875 for TN33 (Battle, Sedlescombe). The difference between the lowest and highest deposit is £62,170.
| Rank | Area | 30% Deposit Required |
|---|---|---|
| 1 | TN38 (St Leonards West, Maze Hill) | £86,705 |
| 2 | TN37 (St Leonards-on-Sea) | £91,635 |
| 3 | TN34 (Hastings Town Centre, Ore) | £96,775 |
| 4 | TN35 (Ore, Fairlight, Pett) | £115,365 |
| 5 | TN39 (Bexhill-on-Sea) | £120,061 |
| 6 | TN33 (Battle, Sedlescombe) | £148,875 |
The three most affordable postcodes (TN38, TN37, TN34) all require deposits under £100,000. TN38 and TN37 are separated by just £4,930 in deposit requirements despite offering different yield profiles (4.9% vs 4.1%). Stamp duty and other buy-to-let costs apply on top of the deposit figure.
For investors seeking below market value properties, Hastings' post-correction pricing creates wider margins relative to comparable South East locations where peak-to-current declines have been smaller. Those exploring lower-capital strategies can also read about no-deposit investment property options.
What the Hastings Data Tells Buy-to-Let Investors
TN38 (St Leonards West, Maze Hill) leads the Hastings data on multiple measures: the highest yield at 4.9%, the lowest asking price at £289,017, the lowest price-to-earnings ratio at 8.3x, and the highest turnover at 29%. Five-year growth of 14.6% shows prices have risen over the medium term despite the recent one-year decline of -3.2%. A 30% deposit of £86,705 is the lowest entry point across all six postcodes.
TN37 (St Leonards-on-Sea) recorded the strongest five-year growth at 17.3%. At £305,451, it offers the second-lowest asking price and a 4.1% yield. TN35 (Ore, Fairlight, Pett) has the strongest one-year growth at 6.4% and the highest monthly rents at £1,316, though the three-year decline of -4.6% is worth reading alongside the longer-term trend.
TN33 (Battle, Sedlescombe) has no rental data and is the only postcode with negative five-year growth (-1.3%). Asking prices of £496,249 and 12 sales per month indicate a lower-volume, higher-value market. The data does not support a rental investment assessment for this postcode.
Hastings Borough Council maintains a register of licensed HMO properties. Investors considering multi-occupancy conversions can check current selective licensing schemes that apply in the area. Hastings' current average sold price of £240,579 represents a 15.1% decline from the September 2022 peak of £283,459. Across the wider investment property market, this level of correction from the pandemic peak is more pronounced than the England (-3.8% vs +1.7% annual) and South East (0.0% annual) averages.
How Hastings Compares
Hastings' mean asking price of £366,342 positions it between Eastbourne (£333,016) at the lower end and Crawley (£412,102), Brighton (£420,745), and Maidstone (£477,473) at the higher end. The table below compares these five South East locations on three headline metrics.
| Location | Mean Asking Price | Mean Monthly Rent | Top Gross Yield |
|---|---|---|---|
| Eastbourne | £333,016 | £1,287 | 5.4% |
| Hastings | £366,342 | £1,142 | 4.9% |
| Crawley | £412,102 | £1,369 | 4.8% |
| Brighton | £420,745 | £1,825 | 6.6% |
| Maidstone | £477,473 | £1,539 | 5.3% |
Hastings has the second-lowest mean asking price of the five locations but records the second-lowest top yield at 4.9%. Eastbourne, with a lower mean asking price, delivers a higher top yield (5.4%). Brighton commands the highest rents (£1,825 per month) and the highest yield (6.6%), though at a significantly higher price point (£420,745). Crawley's top yield of 4.8% is marginally below Hastings despite higher asking prices (£412,102).
Investors comparing these markets can read our guides to Eastbourne buy-to-let, Crawley buy-to-let, Brighton buy-to-let, and Maidstone buy-to-let. For a broader view of the UK's top-performing locations, see our guide to the best buy-to-let areas.
Frequently Asked Questions
Is Hastings a good area for property investment?
Hastings delivers gross rental yields of 3.4% to 4.9% with average sold prices 17.6% below the England average at £240,579. Five-year house price growth ranges from -1.3% (TN33) to 17.3% (TN37). Annual growth across the borough is currently -3.8% (December 2025 Land Registry data), following a 15.1% correction from the September 2022 peak of £283,459. Monthly rents range from £1,044 to £1,316, and 30% deposits start from £86,705 in TN38.
How does Hastings compare to Eastbourne for buy-to-let?
Eastbourne edges Hastings on headline metrics: a lower mean asking price (£333,016 vs £366,342) and a higher top gross yield (5.4% vs 4.9%). Mean monthly rents are higher in Eastbourne at £1,287 compared to Hastings' £1,142. At the individual postcode level, Hastings' TN38 at £289,017 sits below any Eastbourne postcode average. Both locations are on the East Sussex coast with similar demographic profiles. The comparison section above summarises the headline metrics across five South East locations.
Is St Leonards-on-Sea a good area for buy-to-let?
St Leonards-on-Sea is covered by two Hastings postcodes: TN37 (St Leonards-on-Sea) and TN38 (St Leonards West, Maze Hill). TN38 records the highest yield in Hastings at 4.9% with the lowest asking price (£289,017) and the highest turnover (29%). TN37 has the strongest five-year growth at 17.3% with a 4.1% yield and an asking price of £305,451. Between them, these two postcodes represent the most affordable part of Hastings with yields at or above 4.1%.
Why are Hastings house prices falling?
Hastings prices have fallen 15.1% from the September 2022 peak of £283,459 to £240,579 (December 2025 Land Registry data). The annual change reading is -3.8%. This correction followed the pandemic-era surge when prices rose 32.5% between January 2020 and September 2022, partly driven by stamp duty holiday demand and remote working patterns. Hastings' annual decline has been steeper than the England average (+1.7%) and the South East average (0.0%) over the same period.
Can I find buy-to-let property under £300,000 in Hastings?
TN38 (St Leonards West, Maze Hill) is the only Hastings postcode with a mean asking price below £300,000, at £289,017. TN37 (St Leonards-on-Sea) at £305,451 is the next closest. Individual properties below £300,000 are available across multiple postcodes, but these figures represent the postcode averages from PropertyData. Off-market properties can sometimes offer pricing below the published average.
Where can I find houses for sale in Hastings for investment?
Asking prices for houses for sale in Hastings range from £289,017 (TN38, St Leonards West) to £496,249 (TN33, Battle). The three most affordable postcodes are TN38, TN37 (£305,451), and TN34 (£322,584). Monthly sales volumes across the borough total 142 transactions, with TN34 recording the highest at 35 per month and TN38 at 27. Hastings' average sold price of £240,579 sits 17.6% below the England average. Investors looking for renovation properties or repossessed houses for sale may find additional stock below these averages.
What are flats to rent like in Hastings for buy-to-let investors?
Flats and maisonettes in Hastings have an average sold price of £143,222, which is 34.7% below the England flat average of £219,340. Monthly rents across the five postcodes with data range from £1,044 (TN34) to £1,316 (TN35). These are all-property averages rather than flat-specific figures. The flat stock in Hastings is significant, particularly in the central and seafront postcodes (TN34, TN37, TN38), and the steep discount to the national flat average is the primary driver behind Hastings' overall 17.6% below-England pricing.