
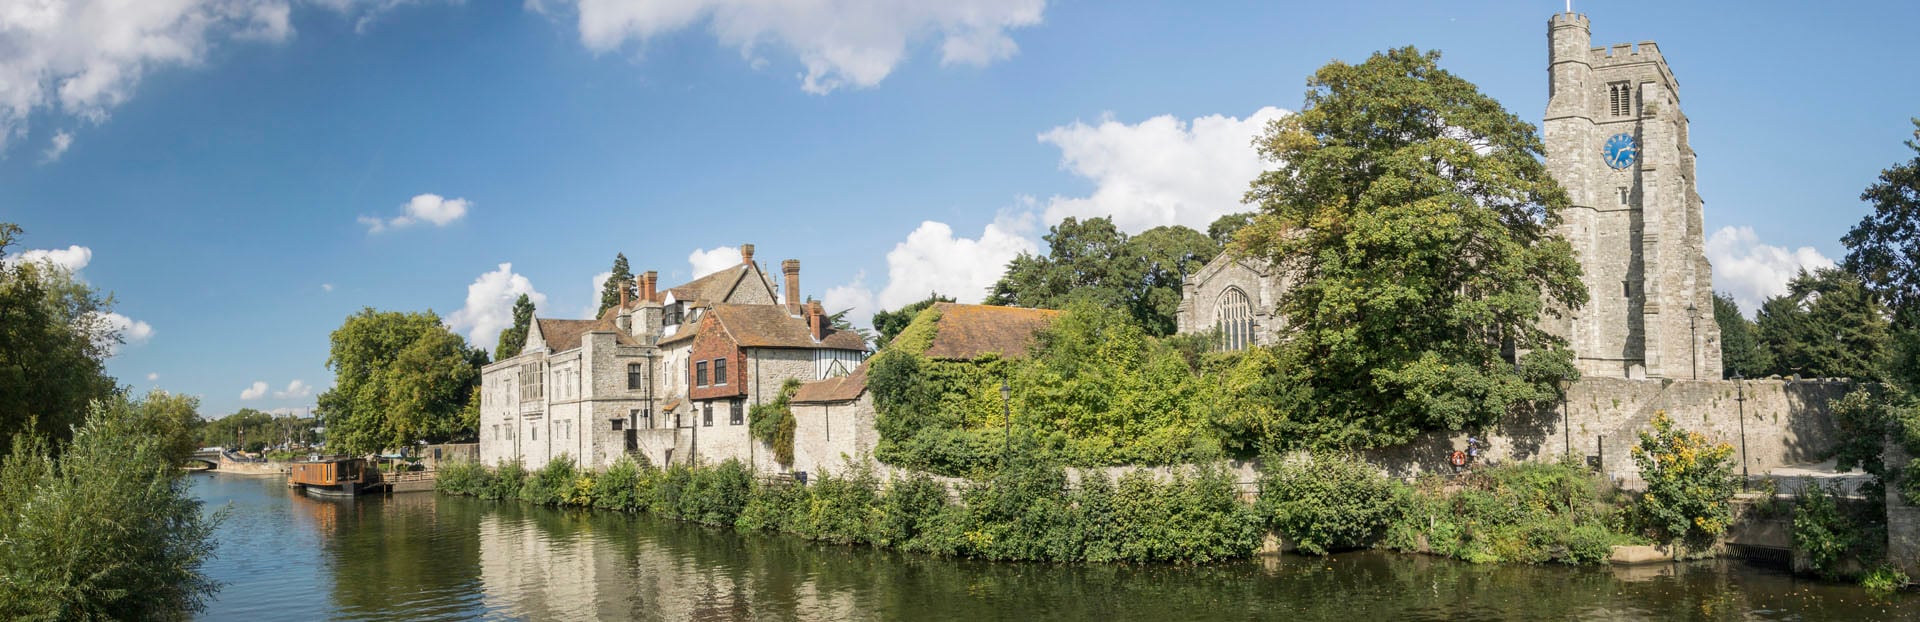
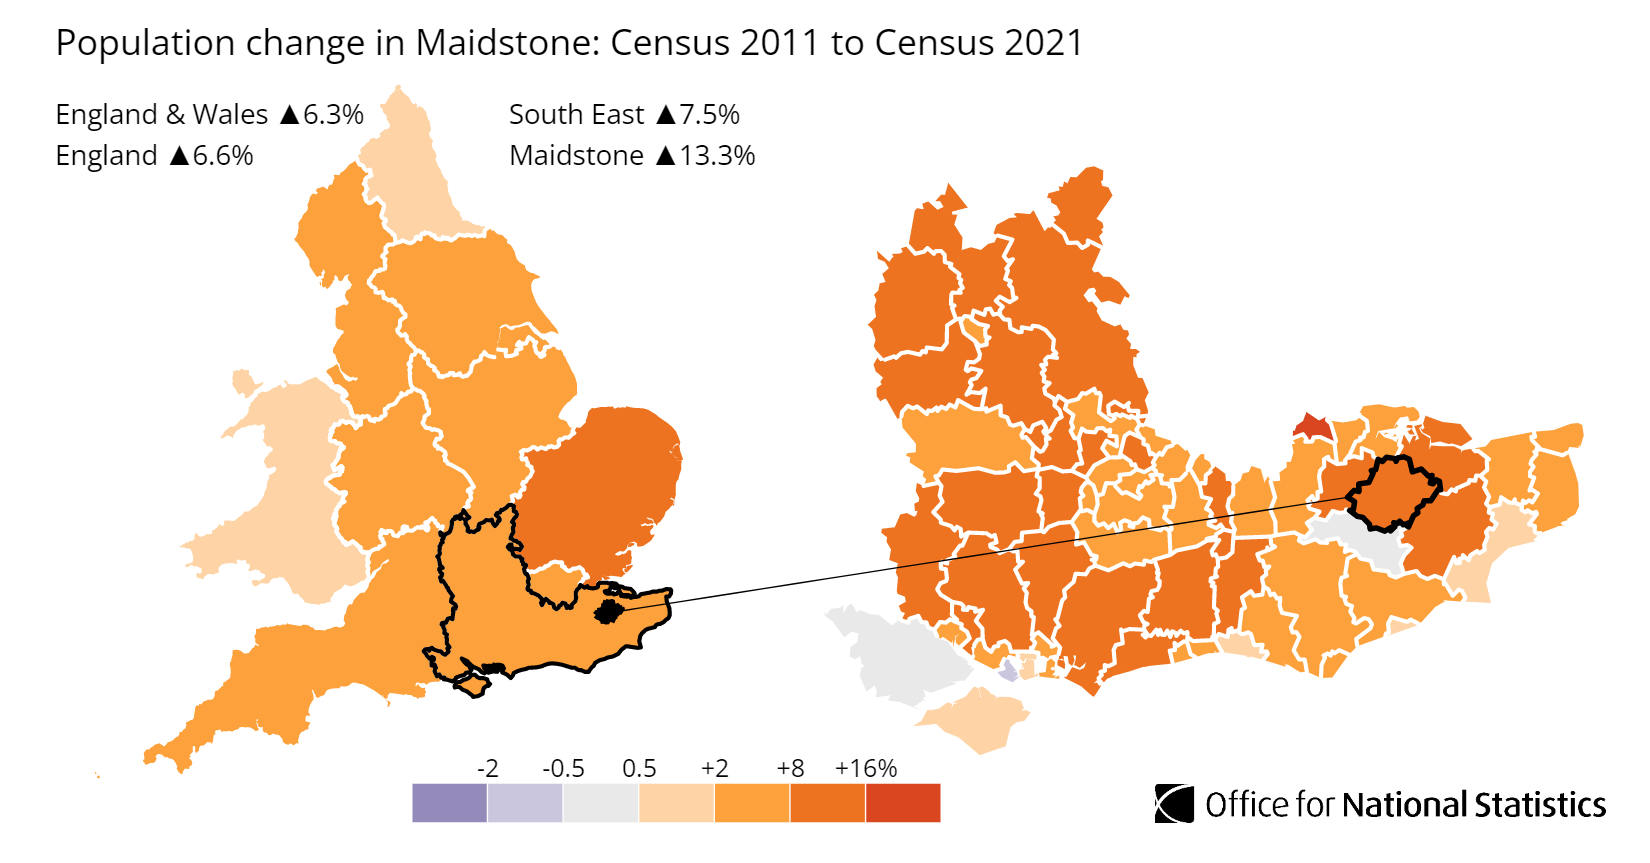
Maidstone is the county town of Kent, in the South East of England. Maidstone's average sold price of £365,560 on the HM Land Registry House Price Index sits 26.1% above the England average of £289,946, yet still 3.4% below the South East regional average of £378,515. That places Kent's county town in the middle band of the South East: dearer than the county's coastal and estuary towns, cheaper than the Weald villages and the west-Kent commuter belt around Sevenoaks. Maidstone Borough Council's population grew 13.3% between the 2011 and 2021 censuses, from 155,143 to 175,782 residents, close to double the England and Wales rate of 6.3%.
What makes Maidstone read as two markets in one borough is the split between its postcodes. The three central postcodes (ME14, ME15, ME16) carry asking prices from £347,843 to £376,871, while the rural and semi-rural south and west push past £500,000 and up to £660,345 in TN17. For an investor the yield story runs against the price: the top gross yield of 4.8% sits with ME20 (Aylesford, Ditton) at £404,610, not with the pricier Weald postcodes where high rents fail to keep pace with the asking prices.
This guide covers Maidstone Borough Council (ONS code E07000110) across ten postcodes: ME14, ME15, ME16, ME17, ME18, ME19, ME20, TN12, TN17, and TN27. Maidstone sits in the South East, 35 miles south-east of central London, with the borough stretching from the town south through the Weald villages towards Cranbrook and Headcorn. The wider Kent buy-to-let region also covers Canterbury to the east and the Medway towns to the north.
Article updated: July 2026

Why Invest in Maidstone?
Maidstone Borough Council, the local authority the town sits within, grew its population 13.3% between the 2011 and 2021 censuses, from 155,143 to 175,782 residents. That is more than double the England and Wales rate of 6.3%, and it is the kind of sustained growth that keeps a rental market fed. Maidstone's pull is straightforward: it is the administrative and retail centre of Kent, with direct rail to London and motorway access south to the coast and north to the M25.
The local employment rate of 81.3% sits above Great Britain's 75.6%. Employment leans on public administration (the county council and borough council are both based here), logistics and distribution along the M20 corridor, retail, and health and social care. Commuting is part of the picture too: Maidstone East and Maidstone West stations run trains to London Victoria and, via Strood, to London St Pancras, so a share of the working population earns London wages while renting in Kent.
Median gross annual earnings for people working in Maidstone are £38,191, which is below both the South East median of £41,616 and the Great Britain median of £39,125. That is the tension at the heart of the borough's numbers: asking prices carry a South East premium, but local wages do not, so affordability ratios run high and rents take a larger share of a local salary than they would further north. For a landlord it means the strongest tenant demand tends to sit where the homes are most affordable rather than where they are most expensive.
Maidstone Economic Summary
- Population (Maidstone): 175,782 (2021 Census). Growth of 13.3% from 2011.
- Median annual salary: £38,191 (local), £41,616 (South East), £39,125 (Great Britain)
- Employment rate: 81.3% (local), 75.6% (Great Britain)
- Key employment sectors: Public administration, logistics and distribution, retail, health and social care
Source: ONS Census 2021, Nomis Labour Market Profile (ASHE 2025)
Regeneration and Investment in Maidstone
More than £130 million of committed investment is reshaping Maidstone's housing stock, most of it concentrated on new-build residential and estate regeneration rather than retail or leisure. For a rental market that runs on affordability, the balance matters: the biggest schemes here are adding homes at the more accessible end, near the town and its stations.
- Shepway Estate Regeneration (Phase 1 under construction, £60 million): Golding Homes is delivering 236 affordable homes across three phases, with 119 homes due in early 2026 replacing 1950s council stock. The scheme adds new homes to the rental pool in one of the more affordable parts of the borough, close to the ME15 area. Updates at Kent Online.
- Maidstone East Development (Planning approved, £50 million): 180 apartments across five blocks on the former Royal Mail sorting office site next to Maidstone East station, with commercial space and a new town centre park. Station-adjacent flats of this kind tend to draw commuter tenants, and they add to a central flat stock that is currently thin. Updates at The Construction Index.
- Senacre and Park Wood Trailblazer Neighbourhood (Funding announced, £20 million): Two Maidstone estates were selected under a national £500 million government programme, the only Kent locations chosen. The funding targets housing quality, safety, and community infrastructure over a ten-year delivery period. Updates at Kent Online.
Source: Office for National Statistics - Population for Maidstone
Maidstone Property Market Analysis
A Maidstone home that changed hands for £66,998 in January 1995 would fetch £365,560 on the same Land Registry index today, a 445.6% climb over three decades. The sections below trace that path cycle by cycle, then break the borough down postcode by postcode for sold prices, price per square foot, asking prices, growth, and monthly sales volumes.
When was the last house price crash in Maidstone?
All sold prices for Maidstone come from HM Land Registry at borough level. The House Price Index tracks the average from January 1995 to the latest reading of March 2026, covering 31 years of the market's ups and downs.
The 1995 to 2007 boom: Maidstone started at £66,998 in January 1995. By December 2000 the average had reached £114,395, a 70.7% climb in six years driven by cheap credit and the spread of buy-to-let lending. Growth ran hot through the early 2000s, with the annual change touching 15.5% in December 2000. The average passed £200,000 by December 2005 and peaked at £237,509 in January 2008.
2008 to 2009, the financial crisis: Prices fell from the January 2008 peak of £237,509 to a trough of £189,681 in May 2009, a drop of 20.1% over 16 months. The worst year-on-year reading was -17.6% in January 2009. That fall was steeper than the England decline of 18.2% over the same crisis and roughly matched the wider South East, where higher-value markets fell more steeply than lower-priced regions further north. Maidstone's exposure to London-facing buyers, who pulled back sharply when credit dried up, is part of why the correction here was deeper than the national one.
The 2010 to 2013 stagnation: Prices bounced off the May 2009 trough but then went sideways, oscillating in a band between £202,056 and £225,045 for close to four years. By December 2013 the average stood at £225,045, still short of the pre-crash peak. Maidstone, like much of the South East outside London, spent the early 2010s unable to push past where it had been in 2008.
Recovery, 2014 to 2016: The market finally regained its footing. The average passed the January 2008 pre-crash peak in August 2014, reaching £239,775, six and a half years after the top. Help to Buy, London overspill demand, and low mortgage rates carried prices from £228,385 in early 2014 to £285,227 by March 2016.
The 2017 to 2019 plateau: Growth slowed hard. Prices drifted around the £300,000 mark, and the annual change turned negative through 2019 as the South East cooled ahead of the pandemic. By December 2019 the average sat at £301,503.
2020 to 2022, the pandemic surge: The stamp duty holiday and the race for space away from London lit up Maidstone. Prices climbed from £302,385 in January 2020 to an all-time high of £367,409 in December 2022, with the annual change peaking at 15.5% that same month. The borough's mix of larger homes and Weald villages suited buyers looking for space within commuting reach.
The 2023 rate shock: Higher mortgage rates cooled the market. The average eased from the December 2022 high to £339,956 by July 2024, a fall of 7.5% from the peak. The worst annual reading in this pullback was -4.9% in December 2023, a much shallower correction than the financial crisis and over far more quickly.
2024 to present: Prices found a floor and edged back up, reaching £353,087 by June 2025 and £365,560 by the latest reading in March 2026, with annual growth back to 2.3%. The current price is just 0.5% below the December 2022 all-time high of £367,409, so the market has all but recovered the pandemic peak.
Long-term growth summary:
- 5 years (March 2021 to March 2026): 18.1% growth (£309,485 to £365,560)
- 10 years (March 2016 to March 2026): 28.2% growth (£285,227 to £365,560)
- 15 years (March 2011 to March 2026): 75.8% growth (£207,893 to £365,560)
- 20 years (March 2006 to March 2026): 79.2% growth (£204,037 to £365,560)
- 30 years (March 1996 to March 2026): 450.0% growth (£66,464 to £365,560)
Maidstone's 20.1% crash was deeper than the England average, reflecting a market more tied to London buyers and higher-value stock. The recovery to the pre-crash peak took six and a half years, longer than England's, because of the drawn-out stagnation between 2010 and 2013. Set against that, the 30-year return of 445.6% is strong, and an investor who bought at the exact January 2008 peak would be up 53.9% on the Land Registry average today.
- All property types
- Detached
- Semi-detached
- Terraced
- Flats
Source: HM Land Registry House Price Index
| Year | All property types | Detached | Semi-detached | Terraced | Flats |
|---|---|---|---|---|---|
| 1995-01 | £66,998 | £117,639 | £67,882 | £52,358 | £43,569 |
| 1995-02 | £68,930 | £119,697 | £70,199 | £54,047 | £44,870 |
| 1995-03 | £68,557 | £118,483 | £69,863 | £53,936 | £44,626 |
| 1995-04 | £67,956 | £116,811 | £69,353 | £53,583 | £44,342 |
| 1995-05 | £66,717 | £114,738 | £68,086 | £52,576 | £43,574 |
| 1995-06 | £66,903 | £115,329 | £68,327 | £52,548 | £43,780 |
| 1995-07 | £67,037 | £116,047 | £68,439 | £52,566 | £43,578 |
| 1995-08 | £67,460 | £117,477 | £68,741 | £52,842 | £43,498 |
| 1995-09 | £67,396 | £117,783 | £68,587 | £52,785 | £43,176 |
| 1995-10 | £67,484 | £118,000 | £68,785 | £52,697 | £43,363 |
| 1995-11 | £68,279 | £119,319 | £69,680 | £53,204 | £44,115 |
| 1995-12 | £69,433 | £120,912 | £70,977 | £54,136 | £44,950 |
| 1996-01 | £70,288 | £122,423 | £71,852 | £54,870 | £45,221 |
| 1996-02 | £68,918 | £119,718 | £70,549 | £53,884 | £44,195 |
| 1996-03 | £66,464 | £115,911 | £68,097 | £51,822 | £42,315 |
| 1996-04 | £66,409 | £115,658 | £67,981 | £51,889 | £42,334 |
| 1996-05 | £66,866 | £116,383 | £68,340 | £52,403 | £42,549 |
| 1996-06 | £67,676 | £117,658 | £69,061 | £53,117 | £43,370 |
| 1996-07 | £68,100 | £118,681 | £69,536 | £53,360 | £43,382 |
| 1996-08 | £68,862 | £120,845 | £70,264 | £53,744 | £43,522 |
| 1996-09 | £68,549 | £120,821 | £69,883 | £53,472 | £42,836 |
| 1996-10 | £68,804 | £121,523 | £70,155 | £53,579 | £42,897 |
| 1996-11 | £68,701 | £120,986 | £70,087 | £53,558 | £43,032 |
| 1996-12 | £71,641 | £125,732 | £73,245 | £55,869 | £44,910 |
| 1997-01 | £72,007 | £126,330 | £73,583 | £56,252 | £44,974 |
| 1997-02 | £72,362 | £127,265 | £73,954 | £56,443 | £44,986 |
| 1997-03 | £72,803 | £128,126 | £74,227 | £56,860 | £45,347 |
| 1997-04 | £73,576 | £129,052 | £75,103 | £57,490 | £46,027 |
| 1997-05 | £74,900 | £131,053 | £76,573 | £58,604 | £46,672 |
| 1997-06 | £75,114 | £131,788 | £76,888 | £58,683 | £46,391 |
| 1997-07 | £76,309 | £134,388 | £78,068 | £59,610 | £46,671 |
| 1997-08 | £76,227 | £134,836 | £77,934 | £59,429 | £46,421 |
| 1997-09 | £76,980 | £136,542 | £78,689 | £59,927 | £46,757 |
| 1997-10 | £78,385 | £139,119 | £80,187 | £60,923 | £47,646 |
| 1997-11 | £80,046 | £142,118 | £81,883 | £62,182 | £48,710 |
| 1997-12 | £80,475 | £142,608 | £82,474 | £62,497 | £48,943 |
| 1998-01 | £81,060 | £144,057 | £82,903 | £62,956 | £49,255 |
| 1998-02 | £81,382 | £144,177 | £83,259 | £63,259 | £49,677 |
| 1998-03 | £81,358 | £144,032 | £83,181 | £63,313 | £49,616 |
| 1998-04 | £82,089 | £145,099 | £84,115 | £63,838 | £49,961 |
| 1998-05 | £83,007 | £146,700 | £84,996 | £64,666 | £50,324 |
| 1998-06 | £84,502 | £149,599 | £86,426 | £65,772 | £51,412 |
| 1998-07 | £84,229 | £149,372 | £86,068 | £65,569 | £51,151 |
| 1998-08 | £85,728 | £152,965 | £87,521 | £66,564 | £51,832 |
| 1998-09 | £87,235 | £156,220 | £89,018 | £67,653 | £52,524 |
| 1998-10 | £87,889 | £157,158 | £89,704 | £68,137 | £53,191 |
| 1998-11 | £88,731 | £158,620 | £90,676 | £68,657 | £53,892 |
| 1998-12 | £87,095 | £155,203 | £89,120 | £67,373 | £53,174 |
| 1999-01 | £86,278 | £153,907 | £88,306 | £66,680 | £52,648 |
| 1999-02 | £85,788 | £152,538 | £87,842 | £66,376 | £52,468 |
| 1999-03 | £87,826 | £156,065 | £89,880 | £67,956 | £53,823 |
| 1999-04 | £90,044 | £159,299 | £92,124 | £69,903 | £55,204 |
| 1999-05 | £91,037 | £160,769 | £93,107 | £70,823 | £55,720 |
| 1999-06 | £91,981 | £162,505 | £94,049 | £71,645 | £56,071 |
| 1999-07 | £92,150 | £163,785 | £94,120 | £71,634 | £55,965 |
| 1999-08 | £92,464 | £164,954 | £94,300 | £71,875 | £55,960 |
| 1999-09 | £94,955 | £170,180 | £96,695 | £73,671 | £57,500 |
| 1999-10 | £97,399 | £174,456 | £99,299 | £75,393 | £59,272 |
| 1999-11 | £98,048 | £175,384 | £100,053 | £75,788 | £59,941 |
| 1999-12 | £99,009 | £176,025 | £101,068 | £76,698 | £60,882 |
| 2000-01 | £99,530 | £177,481 | £101,584 | £77,087 | £60,865 |
| 2000-02 | £101,263 | £180,654 | £103,215 | £78,477 | £61,959 |
| 2000-03 | £103,994 | £185,876 | £106,137 | £80,530 | £63,260 |
| 2000-04 | £108,171 | £192,135 | £110,350 | £83,941 | £66,329 |
| 2000-05 | £111,168 | £197,401 | £113,574 | £86,172 | £68,127 |
| 2000-06 | £111,311 | £197,309 | £113,788 | £86,231 | £68,423 |
| 2000-07 | £110,720 | £197,709 | £113,262 | £85,520 | £67,472 |
| 2000-08 | £113,872 | £204,323 | £116,443 | £87,627 | £69,383 |
| 2000-09 | £116,134 | £209,912 | £118,491 | £89,074 | £70,662 |
| 2000-10 | £117,087 | £211,263 | £119,600 | £89,653 | £71,530 |
| 2000-11 | £114,834 | £207,235 | £117,219 | £87,868 | £70,342 |
| 2000-12 | £114,395 | £205,331 | £116,814 | £87,550 | £70,685 |
| 2001-01 | £114,345 | £205,151 | £116,383 | £87,651 | £71,004 |
| 2001-02 | £118,012 | £211,142 | £120,071 | £90,667 | £73,357 |
| 2001-03 | £118,924 | £213,153 | £120,973 | £91,409 | £73,645 |
| 2001-04 | £121,275 | £217,546 | £123,194 | £93,342 | £75,040 |
| 2001-05 | £121,257 | £217,325 | £123,126 | £93,427 | £75,051 |
| 2001-06 | £121,235 | £216,677 | £122,974 | £93,516 | £75,475 |
| 2001-07 | £123,250 | £220,364 | £125,131 | £94,995 | £76,617 |
| 2001-08 | £123,980 | £222,315 | £125,661 | £95,470 | £77,175 |
| 2001-09 | £127,430 | £229,877 | £128,931 | £97,965 | £79,107 |
| 2001-10 | £125,946 | £226,746 | £127,486 | £96,699 | £78,623 |
| 2001-11 | £126,941 | £228,058 | £128,677 | £97,290 | £79,574 |
| 2001-12 | £127,332 | £227,162 | £129,304 | £97,547 | £80,574 |
| 2002-01 | £129,258 | £230,595 | £131,261 | £98,929 | £81,973 |
| 2002-02 | £130,951 | £233,052 | £132,763 | £100,536 | £83,208 |
| 2002-03 | £129,892 | £230,889 | £131,776 | £99,898 | £82,236 |
| 2002-04 | £132,881 | £235,130 | £134,674 | £102,409 | £84,682 |
| 2002-05 | £135,926 | £239,717 | £138,017 | £104,693 | £86,839 |
| 2002-06 | £143,317 | £252,394 | £145,206 | £110,578 | £91,999 |
| 2002-07 | £147,140 | £259,740 | £149,072 | £113,570 | £93,965 |
| 2002-08 | £149,692 | £264,746 | £151,509 | £115,573 | £95,447 |
| 2002-09 | £151,526 | £268,714 | £153,651 | £116,748 | £96,075 |
| 2002-10 | £153,602 | £271,814 | £156,094 | £118,132 | £97,606 |
| 2002-11 | £156,965 | £277,743 | £159,526 | £120,588 | £99,986 |
| 2002-12 | £158,016 | £278,194 | £160,760 | £121,397 | £101,340 |
| 2003-01 | £160,392 | £282,195 | £162,723 | £123,544 | £103,167 |
| 2003-02 | £164,051 | £287,119 | £166,757 | £126,465 | £105,809 |
| 2003-03 | £166,690 | £291,792 | £169,281 | £128,678 | £107,400 |
| 2003-04 | £171,022 | £297,803 | £174,189 | £131,993 | £110,446 |
| 2003-05 | £173,268 | £301,042 | £176,506 | £134,052 | £111,689 |
| 2003-06 | £177,979 | £308,291 | £181,323 | £137,754 | £115,245 |
| 2003-07 | £178,980 | £309,815 | £182,451 | £138,686 | £115,546 |
| 2003-08 | £176,543 | £305,834 | £179,955 | £136,721 | £113,976 |
| 2003-09 | £172,710 | £299,433 | £176,206 | £133,931 | £110,698 |
| 2003-10 | £173,872 | £300,994 | £177,249 | £135,008 | £111,677 |
| 2003-11 | £175,847 | £303,607 | £179,384 | £136,667 | £113,055 |
| 2003-12 | £180,830 | £309,998 | £184,482 | £140,886 | £117,153 |
| 2004-01 | £178,914 | £306,553 | £182,487 | £139,403 | £116,082 |
| 2004-02 | £182,251 | £310,961 | £185,639 | £142,327 | £118,825 |
| 2004-03 | £184,138 | £313,855 | £187,352 | £144,037 | £119,943 |
| 2004-04 | £186,742 | £315,440 | £190,229 | £146,857 | £121,592 |
| 2004-05 | £188,276 | £315,753 | £191,827 | £148,765 | £122,641 |
| 2004-06 | £190,366 | £317,254 | £194,066 | £150,811 | £124,358 |
| 2004-07 | £192,405 | £320,600 | £196,381 | £152,416 | £125,410 |
| 2004-08 | £194,530 | £324,703 | £198,674 | £153,978 | £126,492 |
| 2004-09 | £190,264 | £318,848 | £194,397 | £150,457 | £123,091 |
| 2004-10 | £194,752 | £325,805 | £198,488 | £154,048 | £126,958 |
| 2004-11 | £194,477 | £324,992 | £197,941 | £153,857 | £127,326 |
| 2004-12 | £198,751 | £330,155 | £201,883 | £157,659 | £131,167 |
| 2005-01 | £196,536 | £326,454 | £199,258 | £156,118 | £129,857 |
| 2005-02 | £198,716 | £329,388 | £201,514 | £157,817 | £131,538 |
| 2005-03 | £195,699 | £324,448 | £198,535 | £155,353 | £129,305 |
| 2005-04 | £197,058 | £324,670 | £200,174 | £156,710 | £130,382 |
| 2005-05 | £197,027 | £324,492 | £199,860 | £157,008 | £130,307 |
| 2005-06 | £200,339 | £328,993 | £203,236 | £160,062 | £132,375 |
| 2005-07 | £203,390 | £335,533 | £206,511 | £162,506 | £133,710 |
| 2005-08 | £202,875 | £335,313 | £205,963 | £162,319 | £132,944 |
| 2005-09 | £205,838 | £341,483 | £208,806 | £164,698 | £134,585 |
| 2005-10 | £202,622 | £335,420 | £204,952 | £162,196 | £133,159 |
| 2005-11 | £203,433 | £335,658 | £205,754 | £162,866 | £134,062 |
| 2005-12 | £200,483 | £328,910 | £202,406 | £160,563 | £133,021 |
| 2006-01 | £200,468 | £329,264 | £202,398 | £160,828 | £132,590 |
| 2006-02 | £202,843 | £332,648 | £204,568 | £162,917 | £134,508 |
| 2006-03 | £204,037 | £335,740 | £206,113 | £163,949 | £134,590 |
| 2006-04 | £208,738 | £342,388 | £211,111 | £167,865 | £137,727 |
| 2006-05 | £207,217 | £340,374 | £209,816 | £166,601 | £136,285 |
| 2006-06 | £210,048 | £344,237 | £212,779 | £169,069 | £138,145 |
| 2006-07 | £212,116 | £348,483 | £214,795 | £170,974 | £138,880 |
| 2006-08 | £216,144 | £355,922 | £218,886 | £174,561 | £140,678 |
| 2006-09 | £217,470 | £359,858 | £220,305 | £175,552 | £140,761 |
| 2006-10 | £216,484 | £358,353 | £219,201 | £174,609 | £140,377 |
| 2006-11 | £217,563 | £359,824 | £220,453 | £175,417 | £141,125 |
| 2006-12 | £219,495 | £361,169 | £222,201 | £177,333 | £142,983 |
| 2007-01 | £218,594 | £359,935 | £221,313 | £176,659 | £142,185 |
| 2007-02 | £218,765 | £359,643 | £221,281 | £176,675 | £142,930 |
| 2007-03 | £218,523 | £359,669 | £221,204 | £176,553 | £142,257 |
| 2007-04 | £223,029 | £366,060 | £225,719 | £180,665 | £145,058 |
| 2007-05 | £224,790 | £367,980 | £227,386 | £182,516 | £146,177 |
| 2007-06 | £229,300 | £375,356 | £231,677 | £186,246 | £149,316 |
| 2007-07 | £231,299 | £380,242 | £233,657 | £187,613 | £150,317 |
| 2007-08 | £235,901 | £390,180 | £238,473 | £191,457 | £151,973 |
| 2007-09 | £233,571 | £388,065 | £236,063 | £189,310 | £150,132 |
| 2007-10 | £232,189 | £385,502 | £234,409 | £188,209 | £149,608 |
| 2007-11 | £234,433 | £389,419 | £236,446 | £189,601 | £151,779 |
| 2007-12 | £237,215 | £393,366 | £239,190 | £191,859 | £153,923 |
| 2008-01 | £237,509 | £394,743 | £239,482 | £191,787 | £154,156 |
| 2008-02 | £232,227 | £385,817 | £234,151 | £187,479 | £150,828 |
| 2008-03 | £228,305 | £379,234 | £230,574 | £184,512 | £147,678 |
| 2008-04 | £231,762 | £384,679 | £234,169 | £187,712 | £149,486 |
| 2008-05 | £229,059 | £379,652 | £231,694 | £185,867 | £147,330 |
| 2008-06 | £229,026 | £380,056 | £231,648 | £185,785 | £147,242 |
| 2008-07 | £221,653 | £368,060 | £224,660 | £179,670 | £142,195 |
| 2008-08 | £218,712 | £364,795 | £221,770 | £177,014 | £140,050 |
| 2008-09 | £216,670 | £364,110 | £219,508 | £174,975 | £138,515 |
| 2008-10 | £209,576 | £352,718 | £212,036 | £169,006 | £134,312 |
| 2008-11 | £203,247 | £341,568 | £205,631 | £163,935 | £130,366 |
| 2008-12 | £197,832 | £330,840 | £200,410 | £159,952 | £126,750 |
| 2009-01 | £195,688 | £328,551 | £198,023 | £157,975 | £125,436 |
| 2009-02 | £194,584 | £327,300 | £196,801 | £156,947 | £124,795 |
| 2009-03 | £191,479 | £322,352 | £193,349 | £154,225 | £123,327 |
| 2009-04 | £192,014 | £320,874 | £194,420 | £155,318 | £123,288 |
| 2009-05 | £189,681 | £316,288 | £192,255 | £153,826 | £121,337 |
| 2009-06 | £191,646 | £319,727 | £194,695 | £155,775 | £121,453 |
| 2009-07 | £191,667 | £321,580 | £194,915 | £155,808 | £120,277 |
| 2009-08 | £196,663 | £331,062 | £200,282 | £160,088 | £122,206 |
| 2009-09 | £200,249 | £337,722 | £204,025 | £163,045 | £123,960 |
| 2009-10 | £206,584 | £348,356 | £210,659 | £168,269 | £127,599 |
| 2009-11 | £210,394 | £355,461 | £214,318 | £171,486 | £129,738 |
| 2009-12 | £208,890 | £351,460 | £213,090 | £170,655 | £128,640 |
| 2010-01 | £211,221 | £357,679 | £216,023 | £172,642 | £128,216 |
| 2010-02 | £211,074 | £357,736 | £216,760 | £172,623 | £126,868 |
| 2010-03 | £211,946 | £361,475 | £217,797 | £173,185 | £126,492 |
| 2010-04 | £209,308 | £355,536 | £215,121 | £171,159 | £125,488 |
| 2010-05 | £208,523 | £354,331 | £214,154 | £170,486 | £125,222 |
| 2010-06 | £212,323 | £360,319 | £218,205 | £173,857 | £127,133 |
| 2010-07 | £217,326 | £370,920 | £223,423 | £177,808 | £129,046 |
| 2010-08 | £218,184 | £373,637 | £224,768 | £178,162 | £128,748 |
| 2010-09 | £220,538 | £379,644 | £227,141 | £179,820 | £129,498 |
| 2010-10 | £215,443 | £370,344 | £221,800 | £175,680 | £126,916 |
| 2010-11 | £213,363 | £367,240 | £219,352 | £173,898 | £125,990 |
| 2010-12 | £212,386 | £364,734 | £218,520 | £172,991 | £125,818 |
| 2011-01 | £211,633 | £364,283 | £217,407 | £172,312 | £125,480 |
| 2011-02 | £213,929 | £368,396 | £219,227 | £174,318 | £127,241 |
| 2011-03 | £207,893 | £359,891 | £212,581 | £169,229 | £123,475 |
| 2011-04 | £208,228 | £359,890 | £212,837 | £169,585 | £123,966 |
| 2011-05 | £202,056 | £347,896 | £206,673 | £164,602 | £120,744 |
| 2011-06 | £203,817 | £348,868 | £208,856 | £166,309 | £122,001 |
| 2011-07 | £204,024 | £348,618 | £209,134 | £166,625 | £122,143 |
| 2011-08 | £208,755 | £358,136 | £214,499 | £170,509 | £123,549 |
| 2011-09 | £211,330 | £364,210 | £217,116 | £172,505 | £124,400 |
| 2011-10 | £210,839 | £364,898 | £217,014 | £171,696 | £123,397 |
| 2011-11 | £209,012 | £361,173 | £214,876 | £170,092 | £123,110 |
| 2011-12 | £207,821 | £358,096 | £213,893 | £169,021 | £122,780 |
| 2012-01 | £208,319 | £358,225 | £214,618 | £169,690 | £122,807 |
| 2012-02 | £206,963 | £356,299 | £213,400 | £168,854 | £121,194 |
| 2012-03 | £206,190 | £353,919 | £212,615 | £168,680 | £120,721 |
| 2012-04 | £206,517 | £354,092 | £212,722 | £169,026 | £121,335 |
| 2012-05 | £212,157 | £362,755 | £218,547 | £173,821 | £124,938 |
| 2012-06 | £214,110 | £366,322 | £220,402 | £175,755 | £125,620 |
| 2012-07 | £214,575 | £367,435 | £220,813 | £176,336 | £125,464 |
| 2012-08 | £215,689 | £369,820 | £222,046 | £177,426 | £125,426 |
| 2012-09 | £216,373 | £372,118 | £222,661 | £177,811 | £125,556 |
| 2012-10 | £214,880 | £368,976 | £221,296 | £176,574 | £124,814 |
| 2012-11 | £211,479 | £363,043 | £217,682 | £173,794 | £123,023 |
| 2012-12 | £210,372 | £361,468 | £216,763 | £172,665 | £122,236 |
| 2013-01 | £213,147 | £366,566 | £219,934 | £174,915 | £123,271 |
| 2013-02 | £217,014 | £373,387 | £224,015 | £178,057 | £125,316 |
| 2013-03 | £216,966 | £373,308 | £223,917 | £177,944 | £125,428 |
| 2013-04 | £212,202 | £364,882 | £218,714 | £174,230 | £122,873 |
| 2013-05 | £209,845 | £360,095 | £216,336 | £172,329 | £121,794 |
| 2013-06 | £209,284 | £358,215 | £215,877 | £172,218 | £121,307 |
| 2013-07 | £214,529 | £367,053 | £221,245 | £176,641 | £124,320 |
| 2013-08 | £219,032 | £375,448 | £226,051 | £180,303 | £126,421 |
| 2013-09 | £220,781 | £379,538 | £227,714 | £181,604 | £127,220 |
| 2013-10 | £222,275 | £383,391 | £229,460 | £182,432 | £127,718 |
| 2013-11 | £221,762 | £382,196 | £229,037 | £181,993 | £127,484 |
| 2013-12 | £225,045 | £386,226 | £232,842 | £184,616 | £129,839 |
| 2014-01 | £228,385 | £391,465 | £236,204 | £187,359 | £132,142 |
| 2014-02 | £230,032 | £394,730 | £237,749 | £188,617 | £133,199 |
| 2014-03 | £231,392 | £397,268 | £239,254 | £189,756 | £133,705 |
| 2014-04 | £233,944 | £400,737 | £241,892 | £192,217 | £135,114 |
| 2014-05 | £235,485 | £402,144 | £243,545 | £193,865 | £136,011 |
| 2014-06 | £236,696 | £404,079 | £244,816 | £194,967 | £136,614 |
| 2014-07 | £237,353 | £405,590 | £245,645 | £195,493 | £136,673 |
| 2014-08 | £239,775 | £410,914 | £248,203 | £197,278 | £137,735 |
| 2014-09 | £243,208 | £417,537 | £251,523 | £200,056 | £139,658 |
| 2014-10 | £243,647 | £418,359 | £252,001 | £200,173 | £140,183 |
| 2014-11 | £246,368 | £422,852 | £254,870 | £202,264 | £141,976 |
| 2014-12 | £247,941 | £425,733 | £256,543 | £203,359 | £143,013 |
| 2015-01 | £249,352 | £428,456 | £258,130 | £204,338 | £143,797 |
| 2015-02 | £249,941 | £429,940 | £258,453 | £204,668 | £144,404 |
| 2015-03 | £249,316 | £429,741 | £258,015 | £203,787 | £143,922 |
| 2015-04 | £253,390 | £436,937 | £262,062 | £207,333 | £146,058 |
| 2015-05 | £255,930 | £440,923 | £265,055 | £209,393 | £147,371 |
| 2015-06 | £261,309 | £449,311 | £270,704 | £214,433 | £149,930 |
| 2015-07 | £262,340 | £450,742 | £272,059 | £215,269 | £150,412 |
| 2015-08 | £266,609 | £458,551 | £276,474 | £218,997 | £152,330 |
| 2015-09 | £268,839 | £464,059 | £278,541 | £220,393 | £153,650 |
| 2015-10 | £272,376 | £470,812 | £282,255 | £223,324 | £155,268 |
| 2015-11 | £272,544 | £471,583 | £282,636 | £223,249 | £155,224 |
| 2015-12 | £271,991 | £470,588 | £282,346 | £222,721 | £154,751 |
| 2016-01 | £275,498 | £476,577 | £286,443 | £225,149 | £156,948 |
| 2016-02 | £279,196 | £483,067 | £290,319 | £228,098 | £159,080 |
| 2016-03 | £285,227 | £493,613 | £296,368 | £232,882 | £162,882 |
| 2016-04 | £284,225 | £491,152 | £294,935 | £232,518 | £162,415 |
| 2016-05 | £281,619 | £484,576 | £291,891 | £230,703 | £161,827 |
| 2016-06 | £283,751 | £487,498 | £293,924 | £232,821 | £163,067 |
| 2016-07 | £287,342 | £493,927 | £297,506 | £235,740 | £165,181 |
| 2016-08 | £291,729 | £502,891 | £302,056 | £239,178 | £167,227 |
| 2016-09 | £292,169 | £503,934 | £302,935 | £239,178 | £167,422 |
| 2016-10 | £292,013 | £504,919 | £302,883 | £238,260 | £167,725 |
| 2016-11 | £292,023 | £506,795 | £303,038 | £237,488 | £167,785 |
| 2016-12 | £293,450 | £509,819 | £304,133 | £238,408 | £169,060 |
| 2017-01 | £294,289 | £511,510 | £304,967 | £239,181 | £169,337 |
| 2017-02 | £297,586 | £515,696 | £307,767 | £241,982 | £172,014 |
| 2017-03 | £293,569 | £508,898 | £303,783 | £238,413 | £169,706 |
| 2017-04 | £293,006 | £507,508 | £302,820 | £237,944 | £169,785 |
| 2017-05 | £293,668 | £507,264 | £304,131 | £238,399 | £170,270 |
| 2017-06 | £302,441 | £520,875 | £313,050 | £245,951 | £175,553 |
| 2017-07 | £307,821 | £529,317 | £318,941 | £250,247 | £178,799 |
| 2017-08 | £309,476 | £533,593 | £320,463 | £252,127 | £178,909 |
| 2017-09 | £307,074 | £530,911 | £318,157 | £250,070 | £177,020 |
| 2017-10 | £304,122 | £526,821 | £315,481 | £247,625 | £174,768 |
| 2017-11 | £304,497 | £527,704 | £316,401 | £247,590 | £174,872 |
| 2017-12 | £308,052 | £533,302 | £320,633 | £250,570 | £176,642 |
| 2018-01 | £312,132 | £540,413 | £324,928 | £253,736 | £179,079 |
| 2018-02 | £313,701 | £544,974 | £326,318 | £254,763 | £179,672 |
| 2018-03 | £314,915 | £547,415 | £327,608 | £255,850 | £180,024 |
| 2018-04 | £314,871 | £547,188 | £327,847 | £256,495 | £178,979 |
| 2018-05 | £315,165 | £546,862 | £328,754 | £257,045 | £178,595 |
| 2018-06 | £311,372 | £539,829 | £325,262 | £253,793 | £176,405 |
| 2018-07 | £315,324 | £547,774 | £329,179 | £256,702 | £178,694 |
| 2018-08 | £316,455 | £549,074 | £330,250 | £257,854 | £179,484 |
| 2018-09 | £321,547 | £558,749 | £335,436 | £262,103 | £181,973 |
| 2018-10 | £318,235 | £552,806 | £332,284 | £259,297 | £180,021 |
| 2018-11 | £314,017 | £546,441 | £328,173 | £255,761 | £177,014 |
| 2018-12 | £308,179 | £536,135 | £322,224 | £250,729 | £173,977 |
| 2019-01 | £301,878 | £526,189 | £315,725 | £245,284 | £170,233 |
| 2019-02 | £305,453 | £533,577 | £319,354 | £247,645 | £172,458 |
| 2019-03 | £306,080 | £535,723 | £320,319 | £248,130 | £172,068 |
| 2019-04 | £309,380 | £540,234 | £323,906 | £251,397 | £173,764 |
| 2019-05 | £303,331 | £528,072 | £317,977 | £247,229 | £169,938 |
| 2019-06 | £304,065 | £528,437 | £318,666 | £248,007 | £170,688 |
| 2019-07 | £306,400 | £532,507 | £321,014 | £249,962 | £172,037 |
| 2019-08 | £308,703 | £537,551 | £323,215 | £251,806 | £173,065 |
| 2019-09 | £309,764 | £539,749 | £323,885 | £253,148 | £173,403 |
| 2019-10 | £308,300 | £537,142 | £323,056 | £251,820 | £172,057 |
| 2019-11 | £308,031 | £536,320 | £323,356 | £251,273 | £171,860 |
| 2019-12 | £301,503 | £524,566 | £316,994 | £245,843 | £168,032 |
| 2020-01 | £302,385 | £526,845 | £317,847 | £246,802 | £167,973 |
| 2020-02 | £301,622 | £525,420 | £316,738 | £246,684 | £167,401 |
| 2020-03 | £303,407 | £529,247 | £318,620 | £248,044 | £168,208 |
| 2020-04 | £298,142 | £521,318 | £312,923 | £244,013 | £164,474 |
| 2020-05 | £299,519 | £524,255 | £314,860 | £244,612 | £165,022 |
| 2020-06 | £304,951 | £532,031 | £320,968 | £249,755 | £167,686 |
| 2020-07 | £309,443 | £538,160 | £325,684 | £253,527 | £170,985 |
| 2020-08 | £309,945 | £539,677 | £326,286 | £254,571 | £170,087 |
| 2020-09 | £309,949 | £542,337 | £326,175 | £254,215 | £169,185 |
| 2020-10 | £308,359 | £540,688 | £324,478 | £253,026 | £167,596 |
| 2020-11 | £307,624 | £538,814 | £323,178 | £252,770 | £167,686 |
| 2020-12 | £306,372 | £535,982 | £321,513 | £252,243 | £167,149 |
| 2021-01 | £308,671 | £535,958 | £323,778 | £254,632 | £170,222 |
| 2021-02 | £310,622 | £535,296 | £325,497 | £256,677 | £173,473 |
| 2021-03 | £309,485 | £529,247 | £323,880 | £256,155 | £175,204 |
| 2021-04 | £309,866 | £530,237 | £323,784 | £256,394 | £175,878 |
| 2021-05 | £310,404 | £531,853 | £324,257 | £256,757 | £175,925 |
| 2021-06 | £314,903 | £537,914 | £328,646 | £261,544 | £178,660 |
| 2021-07 | £317,853 | £542,981 | £332,419 | £263,463 | £180,139 |
| 2021-08 | £321,317 | £550,402 | £336,790 | £265,734 | £180,959 |
| 2021-09 | £324,960 | £558,076 | £341,289 | £267,909 | £182,241 |
| 2021-10 | £321,952 | £556,371 | £337,832 | £264,965 | £179,207 |
| 2021-11 | £325,304 | £563,447 | £341,280 | £267,500 | £180,592 |
| 2021-12 | £318,128 | £553,864 | £333,771 | £261,008 | £175,423 |
| 2022-01 | £329,398 | £571,552 | £346,183 | £270,926 | £181,377 |
| 2022-02 | £331,176 | £573,154 | £348,074 | £272,630 | £183,168 |
| 2022-03 | £342,671 | £593,405 | £360,648 | £281,696 | £189,222 |
| 2022-04 | £341,629 | £590,768 | £359,154 | £281,564 | £188,801 |
| 2022-05 | £346,819 | £599,396 | £364,815 | £286,436 | £190,759 |
| 2022-06 | £345,535 | £595,273 | £363,357 | £286,327 | £190,309 |
| 2022-07 | £352,168 | £606,353 | £371,018 | £291,944 | £193,078 |
| 2022-08 | £353,836 | £609,475 | £372,696 | £293,899 | £193,062 |
| 2022-09 | £357,944 | £617,718 | £377,158 | £297,358 | £194,106 |
| 2022-10 | £363,383 | £627,851 | £382,617 | £301,730 | £197,063 |
| 2022-11 | £363,445 | £628,711 | £382,667 | £301,356 | £197,151 |
| 2022-12 | £367,409 | £634,569 | £386,824 | £304,746 | £199,970 |
| 2023-01 | £358,256 | £619,450 | £377,609 | £296,636 | £194,614 |
| 2023-02 | £361,217 | £626,150 | £380,599 | £298,364 | £196,324 |
| 2023-03 | £361,469 | £629,758 | £381,323 | £297,001 | £195,765 |
| 2023-04 | £364,789 | £636,776 | £384,766 | £299,194 | £197,647 |
| 2023-05 | £356,439 | £620,237 | £376,374 | £292,458 | £193,501 |
| 2023-06 | £348,727 | £605,100 | £367,917 | £287,139 | £189,306 |
| 2023-07 | £347,959 | £602,819 | £367,399 | £286,989 | £188,495 |
| 2023-08 | £352,848 | £612,170 | £372,602 | £291,555 | £190,079 |
| 2023-09 | £353,613 | £613,680 | £373,595 | £292,357 | £190,026 |
| 2023-10 | £351,730 | £609,343 | £371,405 | £290,963 | £189,544 |
| 2023-11 | £347,479 | £603,003 | £367,147 | £286,638 | £187,443 |
| 2023-12 | £349,411 | £605,601 | £369,243 | £287,884 | £189,179 |
| 2024-01 | £348,144 | £604,073 | £367,761 | £287,071 | £188,063 |
| 2024-02 | £347,249 | £600,137 | £366,818 | £287,018 | £187,908 |
| 2024-03 | £343,976 | £594,740 | £362,977 | £284,241 | £186,466 |
| 2024-04 | £346,417 | £596,935 | £365,504 | £286,396 | £188,640 |
| 2024-05 | £347,050 | £597,081 | £365,975 | £287,078 | £189,467 |
| 2024-06 | £343,999 | £589,552 | £362,942 | £285,546 | £187,652 |
| 2024-07 | £339,956 | £582,449 | £358,801 | £282,980 | £184,587 |
| 2024-08 | £343,754 | £589,376 | £362,745 | £286,852 | £185,791 |
| 2024-09 | £347,749 | £598,840 | £367,434 | £289,717 | £186,723 |
| 2024-10 | £351,063 | £605,586 | £370,605 | £291,961 | £188,892 |
| 2024-11 | £349,664 | £603,413 | £369,905 | £290,318 | £187,712 |
| 2024-12 | £350,696 | £606,013 | £370,893 | £291,091 | £188,086 |
| 2025-01 | £352,959 | £611,037 | £374,008 | £292,992 | £188,023 |
| 2025-02 | £354,158 | £613,718 | £374,747 | £294,360 | £188,502 |
| 2025-03 | £357,266 | £613,872 | £377,298 | £297,782 | £192,136 |
| 2025-04 | £354,090 | £611,770 | £374,635 | £294,167 | £189,377 |
| 2025-05 | £351,984 | £609,614 | £372,729 | £292,138 | £187,630 |
| 2025-06 | £353,087 | £616,406 | £375,273 | £292,466 | £185,551 |
| 2025-07 | £353,025 | £612,512 | £375,069 | £293,744 | £185,951 |
| 2025-08 | £356,606 | £618,204 | £379,890 | £296,869 | £187,042 |
| 2025-09 | £352,032 | £610,794 | £375,541 | £293,517 | £183,608 |
| 2025-10 | £355,022 | £616,313 | £379,080 | £295,757 | £184,960 |
| 2025-11 | £356,402 | £618,091 | £380,045 | £297,192 | £186,106 |
| 2025-12 | £358,644 | £620,129 | £382,509 | £299,486 | £187,568 |
| 2026-01 | £363,120 | £626,815 | £388,064 | £304,181 | £188,851 |
| 2026-02 | £362,738 | £626,845 | £388,648 | £303,917 | £187,444 |
| 2026-03 | £365,560 | £632,249 | £392,498 | £306,646 | £187,544 |
- All property types
- Detached
- Semi-detached
- Terraced
- Flats
Source: HM Land Registry House Price Index
| Year | All property types | Detached | Semi-detached | Terraced | Flats |
|---|---|---|---|---|---|
| 1996-01 | +4.9% | +4.1% | +5.8% | +4.8% | +3.8% |
| 1996-02 | 0.0% | 0.0% | +0.5% | -0.3% | -1.5% |
| 1996-03 | -3.1% | -2.2% | -2.5% | -3.9% | -5.2% |
| 1996-04 | -2.3% | -1.0% | -2.0% | -3.2% | -4.5% |
| 1996-05 | +0.2% | +1.4% | +0.4% | -0.3% | -2.4% |
| 1996-06 | +1.2% | +2.0% | +1.1% | +1.1% | -0.9% |
| 1996-07 | +1.6% | +2.3% | +1.6% | +1.5% | -0.4% |
| 1996-08 | +2.1% | +2.9% | +2.2% | +1.7% | +0.1% |
| 1996-09 | +1.7% | +2.6% | +1.9% | +1.3% | -0.8% |
| 1996-10 | +2.0% | +3.0% | +2.0% | +1.7% | -1.1% |
| 1996-11 | +0.6% | +1.4% | +0.6% | +0.7% | -2.5% |
| 1996-12 | +3.2% | +4.0% | +3.2% | +3.2% | -0.1% |
| 1997-01 | +2.4% | +3.2% | +2.4% | +2.5% | -0.5% |
| 1997-02 | +5.0% | +6.3% | +4.8% | +4.7% | +1.8% |
| 1997-03 | +9.5% | +10.5% | +9.0% | +9.7% | +7.2% |
| 1997-04 | +10.8% | +11.6% | +10.5% | +10.8% | +8.7% |
| 1997-05 | +12.0% | +12.6% | +12.0% | +11.8% | +9.7% |
| 1997-06 | +11.0% | +12.0% | +11.3% | +10.5% | +7.0% |
| 1997-07 | +12.1% | +13.2% | +12.3% | +11.7% | +7.6% |
| 1997-08 | +10.7% | +11.6% | +10.9% | +10.6% | +6.7% |
| 1997-09 | +12.3% | +13.0% | +12.6% | +12.1% | +9.2% |
| 1997-10 | +13.9% | +14.5% | +14.3% | +13.7% | +11.1% |
| 1997-11 | +16.5% | +17.5% | +16.8% | +16.1% | +13.2% |
| 1997-12 | +12.3% | +13.4% | +12.6% | +11.9% | +9.0% |
| 1998-01 | +12.6% | +14.0% | +12.7% | +11.9% | +9.5% |
| 1998-02 | +12.5% | +13.3% | +12.6% | +12.1% | +10.4% |
| 1998-03 | +11.8% | +12.4% | +12.1% | +11.3% | +9.4% |
| 1998-04 | +11.6% | +12.4% | +12.0% | +11.0% | +8.5% |
| 1998-05 | +10.8% | +11.9% | +11.0% | +10.3% | +7.8% |
| 1998-06 | +12.5% | +13.5% | +12.4% | +12.1% | +10.8% |
| 1998-07 | +10.4% | +11.2% | +10.2% | +10.0% | +9.6% |
| 1998-08 | +12.5% | +13.4% | +12.3% | +12.0% | +11.7% |
| 1998-09 | +13.3% | +14.4% | +13.1% | +12.9% | +12.3% |
| 1998-10 | +12.1% | +13.0% | +11.9% | +11.8% | +11.6% |
| 1998-11 | +10.8% | +11.6% | +10.7% | +10.4% | +10.6% |
| 1998-12 | +8.2% | +8.8% | +8.1% | +7.8% | +8.6% |
| 1999-01 | +6.4% | +6.8% | +6.5% | +5.9% | +6.9% |
| 1999-02 | +5.4% | +5.8% | +5.5% | +4.9% | +5.6% |
| 1999-03 | +8.0% | +8.4% | +8.1% | +7.3% | +8.5% |
| 1999-04 | +9.7% | +9.8% | +9.5% | +9.5% | +10.5% |
| 1999-05 | +9.7% | +9.6% | +9.5% | +9.5% | +10.7% |
| 1999-06 | +8.9% | +8.6% | +8.8% | +8.9% | +9.1% |
| 1999-07 | +9.4% | +9.6% | +9.4% | +9.2% | +9.4% |
| 1999-08 | +7.9% | +7.8% | +7.7% | +8.0% | +8.0% |
| 1999-09 | +8.9% | +8.9% | +8.6% | +8.9% | +9.5% |
| 1999-10 | +10.8% | +11.0% | +10.7% | +10.6% | +11.4% |
| 1999-11 | +10.5% | +10.6% | +10.3% | +10.4% | +11.2% |
| 1999-12 | +13.7% | +13.4% | +13.4% | +13.8% | +14.5% |
| 2000-01 | +15.4% | +15.3% | +15.0% | +15.6% | +15.6% |
| 2000-02 | +18.0% | +18.4% | +17.5% | +18.2% | +18.1% |
| 2000-03 | +18.4% | +19.1% | +18.1% | +18.5% | +17.5% |
| 2000-04 | +20.1% | +20.6% | +19.8% | +20.1% | +20.2% |
| 2000-05 | +22.1% | +22.8% | +22.0% | +21.7% | +22.3% |
| 2000-06 | +21.0% | +21.4% | +21.0% | +20.4% | +22.0% |
| 2000-07 | +20.2% | +20.7% | +20.3% | +19.4% | +20.6% |
| 2000-08 | +23.2% | +23.9% | +23.5% | +21.9% | +24.0% |
| 2000-09 | +22.3% | +23.3% | +22.5% | +20.9% | +22.9% |
| 2000-10 | +20.2% | +21.1% | +20.4% | +18.9% | +20.7% |
| 2000-11 | +17.1% | +18.2% | +17.2% | +15.9% | +17.4% |
| 2000-12 | +15.5% | +16.6% | +15.6% | +14.1% | +16.1% |
| 2001-01 | +14.9% | +15.6% | +14.6% | +13.7% | +16.7% |
| 2001-02 | +16.5% | +16.9% | +16.3% | +15.5% | +18.4% |
| 2001-03 | +14.4% | +14.7% | +14.0% | +13.5% | +16.4% |
| 2001-04 | +12.1% | +13.2% | +11.6% | +11.2% | +13.1% |
| 2001-05 | +9.1% | +10.1% | +8.4% | +8.4% | +10.2% |
| 2001-06 | +8.9% | +9.8% | +8.1% | +8.4% | +10.3% |
| 2001-07 | +11.3% | +11.5% | +10.5% | +11.1% | +13.6% |
| 2001-08 | +8.9% | +8.8% | +7.9% | +8.9% | +11.2% |
| 2001-09 | +9.7% | +9.5% | +8.8% | +10.0% | +12.0% |
| 2001-10 | +7.6% | +7.3% | +6.6% | +7.9% | +9.9% |
| 2001-11 | +10.5% | +10.0% | +9.8% | +10.7% | +13.1% |
| 2001-12 | +11.3% | +10.6% | +10.7% | +11.4% | +14.0% |
| 2002-01 | +13.0% | +12.4% | +12.8% | +12.9% | +15.4% |
| 2002-02 | +11.0% | +10.4% | +10.6% | +10.9% | +13.4% |
| 2002-03 | +9.2% | +8.3% | +8.9% | +9.3% | +11.7% |
| 2002-04 | +9.6% | +8.1% | +9.3% | +9.7% | +12.8% |
| 2002-05 | +12.1% | +10.3% | +12.1% | +12.1% | +15.7% |
| 2002-06 | +18.2% | +16.5% | +18.1% | +18.2% | +21.9% |
| 2002-07 | +19.4% | +17.9% | +19.1% | +19.6% | +22.6% |
| 2002-08 | +20.7% | +19.1% | +20.6% | +21.1% | +23.7% |
| 2002-09 | +18.9% | +16.9% | +19.2% | +19.2% | +21.5% |
| 2002-10 | +22.0% | +19.9% | +22.4% | +22.2% | +24.1% |
| 2002-11 | +23.7% | +21.8% | +24.0% | +23.9% | +25.7% |
| 2002-12 | +24.1% | +22.5% | +24.3% | +24.5% | +25.8% |
| 2003-01 | +24.1% | +22.4% | +24.0% | +24.9% | +25.9% |
| 2003-02 | +25.3% | +23.2% | +25.6% | +25.8% | +27.2% |
| 2003-03 | +28.3% | +26.4% | +28.5% | +28.8% | +30.6% |
| 2003-04 | +28.7% | +26.7% | +29.3% | +28.9% | +30.4% |
| 2003-05 | +27.5% | +25.6% | +27.9% | +28.0% | +28.6% |
| 2003-06 | +24.2% | +22.1% | +24.9% | +24.6% | +25.3% |
| 2003-07 | +21.6% | +19.3% | +22.4% | +22.1% | +23.0% |
| 2003-08 | +17.9% | +15.5% | +18.8% | +18.3% | +19.4% |
| 2003-09 | +14.0% | +11.4% | +14.7% | +14.7% | +15.2% |
| 2003-10 | +13.2% | +10.7% | +13.6% | +14.3% | +14.4% |
| 2003-11 | +12.0% | +9.3% | +12.4% | +13.3% | +13.1% |
| 2003-12 | +14.4% | +11.4% | +14.8% | +16.1% | +15.6% |
| 2004-01 | +11.5% | +8.6% | +12.1% | +12.8% | +12.5% |
| 2004-02 | +11.1% | +8.3% | +11.3% | +12.5% | +12.3% |
| 2004-03 | +10.5% | +7.6% | +10.7% | +11.9% | +11.7% |
| 2004-04 | +9.2% | +5.9% | +9.2% | +11.3% | +10.1% |
| 2004-05 | +8.7% | +4.9% | +8.7% | +11.0% | +9.8% |
| 2004-06 | +7.0% | +2.9% | +7.0% | +9.5% | +7.9% |
| 2004-07 | +7.5% | +3.5% | +7.6% | +9.9% | +8.5% |
| 2004-08 | +10.2% | +6.2% | +10.4% | +12.6% | +11.0% |
| 2004-09 | +10.2% | +6.5% | +10.3% | +12.3% | +11.2% |
| 2004-10 | +12.0% | +8.2% | +12.0% | +14.1% | +13.7% |
| 2004-11 | +10.6% | +7.0% | +10.3% | +12.6% | +12.6% |
| 2004-12 | +9.9% | +6.5% | +9.4% | +11.9% | +12.0% |
| 2005-01 | +9.8% | +6.5% | +9.2% | +12.0% | +11.9% |
| 2005-02 | +9.0% | +5.9% | +8.6% | +10.9% | +10.7% |
| 2005-03 | +6.3% | +3.4% | +6.0% | +7.9% | +7.8% |
| 2005-04 | +5.5% | +2.9% | +5.2% | +6.7% | +7.2% |
| 2005-05 | +4.6% | +2.8% | +4.2% | +5.5% | +6.3% |
| 2005-06 | +5.2% | +3.7% | +4.7% | +6.1% | +6.4% |
| 2005-07 | +5.7% | +4.7% | +5.2% | +6.6% | +6.6% |
| 2005-08 | +4.3% | +3.3% | +3.7% | +5.4% | +5.1% |
| 2005-09 | +8.2% | +7.1% | +7.4% | +9.5% | +9.3% |
| 2005-10 | +4.0% | +3.0% | +3.3% | +5.3% | +4.9% |
| 2005-11 | +4.6% | +3.3% | +3.9% | +5.9% | +5.3% |
| 2005-12 | +0.9% | -0.4% | +0.3% | +1.8% | +1.4% |
| 2006-01 | +2.0% | +0.9% | +1.6% | +3.0% | +2.1% |
| 2006-02 | +2.1% | +1.0% | +1.5% | +3.2% | +2.3% |
| 2006-03 | +4.3% | +3.5% | +3.8% | +5.5% | +4.1% |
| 2006-04 | +5.9% | +5.5% | +5.5% | +7.1% | +5.6% |
| 2006-05 | +5.2% | +4.9% | +5.0% | +6.1% | +4.6% |
| 2006-06 | +4.8% | +4.6% | +4.7% | +5.6% | +4.4% |
| 2006-07 | +4.3% | +3.9% | +4.0% | +5.2% | +3.9% |
| 2006-08 | +6.5% | +6.1% | +6.3% | +7.5% | +5.8% |
| 2006-09 | +5.7% | +5.4% | +5.5% | +6.6% | +4.6% |
| 2006-10 | +6.8% | +6.8% | +7.0% | +7.7% | +5.4% |
| 2006-11 | +6.9% | +7.2% | +7.1% | +7.7% | +5.3% |
| 2006-12 | +9.5% | +9.8% | +9.8% | +10.4% | +7.5% |
| 2007-01 | +9.0% | +9.3% | +9.3% | +9.8% | +7.2% |
| 2007-02 | +7.8% | +8.1% | +8.2% | +8.4% | +6.3% |
| 2007-03 | +7.1% | +7.1% | +7.3% | +7.7% | +5.7% |
| 2007-04 | +6.8% | +6.9% | +6.9% | +7.6% | +5.3% |
| 2007-05 | +8.5% | +8.1% | +8.4% | +9.6% | +7.3% |
| 2007-06 | +9.2% | +9.0% | +8.9% | +10.2% | +8.1% |
| 2007-07 | +9.0% | +9.1% | +8.8% | +9.7% | +8.2% |
| 2007-08 | +9.1% | +9.6% | +8.9% | +9.7% | +8.0% |
| 2007-09 | +7.4% | +7.8% | +7.2% | +7.8% | +6.7% |
| 2007-10 | +7.3% | +7.6% | +6.9% | +7.8% | +6.6% |
| 2007-11 | +7.8% | +8.2% | +7.3% | +8.1% | +7.5% |
| 2007-12 | +8.1% | +8.9% | +7.6% | +8.2% | +7.7% |
| 2008-01 | +8.7% | +9.7% | +8.2% | +8.6% | +8.4% |
| 2008-02 | +6.2% | +7.3% | +5.8% | +6.1% | +5.5% |
| 2008-03 | +4.5% | +5.4% | +4.2% | +4.5% | +3.8% |
| 2008-04 | +3.9% | +5.1% | +3.7% | +3.9% | +3.1% |
| 2008-05 | +1.9% | +3.2% | +1.9% | +1.8% | +0.8% |
| 2008-06 | -0.1% | +1.3% | 0.0% | -0.2% | -1.4% |
| 2008-07 | -4.2% | -3.2% | -3.9% | -4.2% | -5.4% |
| 2008-08 | -7.3% | -6.5% | -7.0% | -7.5% | -7.8% |
| 2008-09 | -7.2% | -6.2% | -7.0% | -7.6% | -7.7% |
| 2008-10 | -9.7% | -8.5% | -9.5% | -10.2% | -10.2% |
| 2008-11 | -13.3% | -12.3% | -13.0% | -13.5% | -14.1% |
| 2008-12 | -16.6% | -15.9% | -16.2% | -16.6% | -17.7% |
| 2009-01 | -17.6% | -16.8% | -17.3% | -17.6% | -18.6% |
| 2009-02 | -16.2% | -15.2% | -16.0% | -16.3% | -17.3% |
| 2009-03 | -16.1% | -15.0% | -16.1% | -16.4% | -16.5% |
| 2009-04 | -17.2% | -16.6% | -17.0% | -17.3% | -17.5% |
| 2009-05 | -17.2% | -16.7% | -17.0% | -17.2% | -17.6% |
| 2009-06 | -16.3% | -15.9% | -16.0% | -16.2% | -17.5% |
| 2009-07 | -13.5% | -12.6% | -13.2% | -13.3% | -15.4% |
| 2009-08 | -10.1% | -9.2% | -9.7% | -9.6% | -12.7% |
| 2009-09 | -7.6% | -7.2% | -7.1% | -6.8% | -10.5% |
| 2009-10 | -1.4% | -1.2% | -0.6% | -0.4% | -5.0% |
| 2009-11 | +3.5% | +4.1% | +4.2% | +4.6% | -0.5% |
| 2009-12 | +5.6% | +6.2% | +6.3% | +6.7% | +1.5% |
| 2010-01 | +7.9% | +8.9% | +9.1% | +9.3% | +2.2% |
| 2010-02 | +8.5% | +9.3% | +10.1% | +10.0% | +1.7% |
| 2010-03 | +10.7% | +12.1% | +12.6% | +12.3% | +2.6% |
| 2010-04 | +9.0% | +10.8% | +10.6% | +10.2% | +1.8% |
| 2010-05 | +9.9% | +12.0% | +11.4% | +10.8% | +3.2% |
| 2010-06 | +10.8% | +12.7% | +12.1% | +11.6% | +4.7% |
| 2010-07 | +13.4% | +15.3% | +14.6% | +14.1% | +7.3% |
| 2010-08 | +10.9% | +12.9% | +12.2% | +11.3% | +5.4% |
| 2010-09 | +10.1% | +12.4% | +11.3% | +10.3% | +4.5% |
| 2010-10 | +4.3% | +6.3% | +5.3% | +4.4% | -0.5% |
| 2010-11 | +1.4% | +3.3% | +2.3% | +1.4% | -2.9% |
| 2010-12 | +1.7% | +3.8% | +2.5% | +1.4% | -2.2% |
| 2011-01 | +0.2% | +1.8% | +0.6% | -0.2% | -2.1% |
| 2011-02 | +1.4% | +3.0% | +1.1% | +1.0% | +0.3% |
| 2011-03 | -1.9% | -0.4% | -2.4% | -2.3% | -2.4% |
| 2011-04 | -0.5% | +1.2% | -1.1% | -0.9% | -1.2% |
| 2011-05 | -3.1% | -1.8% | -3.5% | -3.5% | -3.6% |
| 2011-06 | -4.0% | -3.2% | -4.3% | -4.3% | -4.0% |
| 2011-07 | -6.1% | -6.0% | -6.4% | -6.3% | -5.3% |
| 2011-08 | -4.3% | -4.1% | -4.6% | -4.3% | -4.0% |
| 2011-09 | -4.2% | -4.1% | -4.4% | -4.1% | -3.9% |
| 2011-10 | -2.1% | -1.5% | -2.2% | -2.3% | -2.8% |
| 2011-11 | -2.0% | -1.7% | -2.0% | -2.2% | -2.3% |
| 2011-12 | -2.1% | -1.8% | -2.1% | -2.3% | -2.4% |
| 2012-01 | -1.6% | -1.7% | -1.3% | -1.5% | -2.1% |
| 2012-02 | -3.3% | -3.3% | -2.7% | -3.1% | -4.8% |
| 2012-03 | -0.8% | -1.7% | 0.0% | -0.3% | -2.2% |
| 2012-04 | -0.8% | -1.6% | -0.1% | -0.3% | -2.1% |
| 2012-05 | +5.0% | +4.3% | +5.7% | +5.6% | +3.5% |
| 2012-06 | +5.1% | +5.0% | +5.5% | +5.7% | +3.0% |
| 2012-07 | +5.2% | +5.4% | +5.6% | +5.8% | +2.7% |
| 2012-08 | +3.3% | +3.3% | +3.5% | +4.1% | +1.5% |
| 2012-09 | +2.4% | +2.2% | +2.6% | +3.1% | +0.9% |
| 2012-10 | +1.9% | +1.1% | +2.0% | +2.8% | +1.1% |
| 2012-11 | +1.2% | +0.5% | +1.3% | +2.2% | -0.1% |
| 2012-12 | +1.2% | +0.9% | +1.3% | +2.2% | -0.4% |
| 2013-01 | +2.3% | +2.3% | +2.5% | +3.1% | +0.4% |
| 2013-02 | +4.9% | +4.8% | +5.0% | +5.5% | +3.4% |
| 2013-03 | +5.2% | +5.5% | +5.3% | +5.5% | +3.9% |
| 2013-04 | +2.8% | +3.0% | +2.8% | +3.1% | +1.3% |
| 2013-05 | -1.1% | -0.7% | -1.0% | -0.9% | -2.5% |
| 2013-06 | -2.3% | -2.2% | -2.1% | -2.0% | -3.4% |
| 2013-07 | 0.0% | -0.1% | +0.2% | +0.2% | -0.9% |
| 2013-08 | +1.5% | +1.5% | +1.8% | +1.6% | +0.8% |
| 2013-09 | +2.0% | +2.0% | +2.3% | +2.1% | +1.3% |
| 2013-10 | +3.4% | +3.9% | +3.7% | +3.3% | +2.3% |
| 2013-11 | +4.9% | +5.3% | +5.2% | +4.7% | +3.6% |
| 2013-12 | +7.0% | +6.8% | +7.4% | +6.9% | +6.2% |
| 2014-01 | +7.1% | +6.8% | +7.4% | +7.1% | +7.2% |
| 2014-02 | +6.0% | +5.7% | +6.1% | +5.9% | +6.3% |
| 2014-03 | +6.6% | +6.4% | +6.8% | +6.6% | +6.6% |
| 2014-04 | +10.2% | +9.8% | +10.6% | +10.3% | +10.0% |
| 2014-05 | +12.2% | +11.7% | +12.6% | +12.5% | +11.7% |
| 2014-06 | +13.1% | +12.8% | +13.4% | +13.2% | +12.6% |
| 2014-07 | +10.6% | +10.5% | +11.0% | +10.7% | +9.9% |
| 2014-08 | +9.5% | +9.4% | +9.8% | +9.4% | +8.9% |
| 2014-09 | +10.2% | +10.0% | +10.5% | +10.2% | +9.8% |
| 2014-10 | +9.6% | +9.1% | +9.8% | +9.7% | +9.8% |
| 2014-11 | +11.1% | +10.6% | +11.3% | +11.1% | +11.4% |
| 2014-12 | +10.2% | +10.2% | +10.2% | +10.2% | +10.1% |
| 2015-01 | +9.2% | +9.4% | +9.3% | +9.1% | +8.8% |
| 2015-02 | +8.7% | +8.9% | +8.7% | +8.5% | +8.4% |
| 2015-03 | +7.7% | +8.2% | +7.8% | +7.4% | +7.6% |
| 2015-04 | +8.3% | +9.0% | +8.3% | +7.9% | +8.1% |
| 2015-05 | +8.7% | +9.6% | +8.8% | +8.0% | +8.4% |
| 2015-06 | +10.4% | +11.2% | +10.6% | +10.0% | +9.7% |
| 2015-07 | +10.5% | +11.1% | +10.8% | +10.1% | +10.1% |
| 2015-08 | +11.2% | +11.6% | +11.4% | +11.0% | +10.6% |
| 2015-09 | +10.5% | +11.1% | +10.7% | +10.2% | +10.0% |
| 2015-10 | +11.8% | +12.5% | +12.0% | +11.6% | +10.8% |
| 2015-11 | +10.6% | +11.5% | +10.9% | +10.4% | +9.3% |
| 2015-12 | +9.7% | +10.5% | +10.1% | +9.5% | +8.2% |
| 2016-01 | +10.5% | +11.2% | +11.0% | +10.2% | +9.1% |
| 2016-02 | +11.7% | +12.4% | +12.3% | +11.4% | +10.2% |
| 2016-03 | +14.4% | +14.9% | +14.9% | +14.3% | +13.2% |
| 2016-04 | +12.2% | +12.4% | +12.5% | +12.1% | +11.2% |
| 2016-05 | +10.0% | +9.9% | +10.1% | +10.2% | +9.8% |
| 2016-06 | +8.6% | +8.5% | +8.6% | +8.6% | +8.8% |
| 2016-07 | +9.5% | +9.6% | +9.4% | +9.5% | +9.8% |
| 2016-08 | +9.4% | +9.7% | +9.3% | +9.2% | +9.8% |
| 2016-09 | +8.7% | +8.6% | +8.8% | +8.5% | +9.0% |
| 2016-10 | +7.2% | +7.2% | +7.3% | +6.7% | +8.0% |
| 2016-11 | +7.1% | +7.5% | +7.2% | +6.4% | +8.1% |
| 2016-12 | +7.9% | +8.3% | +7.7% | +7.0% | +9.2% |
| 2017-01 | +6.8% | +7.3% | +6.5% | +6.2% | +7.9% |
| 2017-02 | +6.6% | +6.8% | +6.0% | +6.1% | +8.1% |
| 2017-03 | +2.9% | +3.1% | +2.5% | +2.4% | +4.2% |
| 2017-04 | +3.1% | +3.3% | +2.7% | +2.3% | +4.5% |
| 2017-05 | +4.3% | +4.7% | +4.2% | +3.3% | +5.2% |
| 2017-06 | +6.6% | +6.8% | +6.5% | +5.6% | +7.7% |
| 2017-07 | +7.1% | +7.2% | +7.2% | +6.2% | +8.2% |
| 2017-08 | +6.1% | +6.1% | +6.1% | +5.4% | +7.0% |
| 2017-09 | +5.1% | +5.4% | +5.0% | +4.6% | +5.7% |
| 2017-10 | +4.1% | +4.3% | +4.2% | +3.9% | +4.2% |
| 2017-11 | +4.3% | +4.1% | +4.4% | +4.3% | +4.2% |
| 2017-12 | +5.0% | +4.6% | +5.4% | +5.1% | +4.5% |
| 2018-01 | +6.1% | +5.7% | +6.5% | +6.1% | +5.8% |
| 2018-02 | +5.4% | +5.7% | +6.0% | +5.3% | +4.5% |
| 2018-03 | +7.3% | +7.6% | +7.8% | +7.3% | +6.1% |
| 2018-04 | +7.5% | +7.8% | +8.3% | +7.8% | +5.4% |
| 2018-05 | +7.3% | +7.8% | +8.1% | +7.8% | +4.9% |
| 2018-06 | +3.0% | +3.6% | +3.9% | +3.2% | +0.5% |
| 2018-07 | +2.4% | +3.5% | +3.2% | +2.6% | -0.1% |
| 2018-08 | +2.3% | +2.9% | +3.1% | +2.3% | +0.3% |
| 2018-09 | +4.7% | +5.2% | +5.4% | +4.8% | +2.8% |
| 2018-10 | +4.6% | +4.9% | +5.3% | +4.7% | +3.0% |
| 2018-11 | +3.1% | +3.6% | +3.7% | +3.3% | +1.2% |
| 2018-12 | 0.0% | +0.5% | +0.5% | +0.1% | -1.5% |
| 2019-01 | -3.3% | -2.6% | -2.8% | -3.3% | -4.9% |
| 2019-02 | -2.6% | -2.1% | -2.1% | -2.8% | -4.0% |
| 2019-03 | -2.8% | -2.1% | -2.2% | -3.0% | -4.4% |
| 2019-04 | -1.7% | -1.3% | -1.2% | -2.0% | -2.9% |
| 2019-05 | -3.8% | -3.4% | -3.3% | -3.8% | -4.8% |
| 2019-06 | -2.3% | -2.1% | -2.0% | -2.3% | -3.2% |
| 2019-07 | -2.8% | -2.8% | -2.5% | -2.6% | -3.7% |
| 2019-08 | -2.4% | -2.1% | -2.1% | -2.3% | -3.6% |
| 2019-09 | -3.7% | -3.4% | -3.4% | -3.4% | -4.7% |
| 2019-10 | -3.1% | -2.8% | -2.8% | -2.9% | -4.4% |
| 2019-11 | -1.9% | -1.9% | -1.5% | -1.8% | -2.9% |
| 2019-12 | -2.2% | -2.2% | -1.6% | -1.9% | -3.4% |
| 2020-01 | +0.2% | +0.1% | +0.7% | +0.6% | -1.3% |
| 2020-02 | -1.3% | -1.5% | -0.8% | -0.4% | -2.9% |
| 2020-03 | -0.9% | -1.2% | -0.5% | 0.0% | -2.2% |
| 2020-04 | -3.6% | -3.5% | -3.4% | -2.9% | -5.3% |
| 2020-05 | -1.3% | -0.7% | -1.0% | -1.1% | -2.9% |
| 2020-06 | +0.3% | +0.7% | +0.7% | +0.7% | -1.8% |
| 2020-07 | +1.0% | +1.1% | +1.5% | +1.4% | -0.6% |
| 2020-08 | +0.4% | +0.4% | +1.0% | +1.1% | -1.7% |
| 2020-09 | +0.1% | +0.5% | +0.7% | +0.4% | -2.4% |
| 2020-10 | 0.0% | +0.7% | +0.4% | +0.5% | -2.6% |
| 2020-11 | -0.1% | +0.5% | -0.1% | +0.6% | -2.4% |
| 2020-12 | +1.6% | +2.2% | +1.4% | +2.6% | -0.5% |
| 2021-01 | +2.1% | +1.7% | +1.9% | +3.2% | +1.3% |
| 2021-02 | +3.0% | +1.9% | +2.8% | +4.1% | +3.6% |
| 2021-03 | +2.0% | 0.0% | +1.7% | +3.3% | +4.2% |
| 2021-04 | +3.9% | +1.7% | +3.5% | +5.1% | +6.9% |
| 2021-05 | +3.6% | +1.4% | +3.0% | +5.0% | +6.6% |
| 2021-06 | +3.3% | +1.1% | +2.4% | +4.7% | +6.5% |
| 2021-07 | +2.7% | +0.9% | +2.1% | +3.9% | +5.4% |
| 2021-08 | +3.7% | +2.0% | +3.2% | +4.4% | +6.4% |
| 2021-09 | +4.8% | +2.9% | +4.6% | +5.4% | +7.7% |
| 2021-10 | +4.4% | +2.9% | +4.1% | +4.7% | +6.9% |
| 2021-11 | +5.7% | +4.6% | +5.6% | +5.8% | +7.7% |
| 2021-12 | +3.8% | +3.3% | +3.8% | +3.5% | +5.0% |
| 2022-01 | +6.7% | +6.6% | +6.9% | +6.4% | +6.6% |
| 2022-02 | +6.6% | +7.1% | +6.9% | +6.2% | +5.6% |
| 2022-03 | +10.7% | +12.1% | +11.4% | +10.0% | +8.0% |
| 2022-04 | +10.3% | +11.4% | +10.9% | +9.8% | +7.3% |
| 2022-05 | +11.7% | +12.7% | +12.5% | +11.6% | +8.4% |
| 2022-06 | +9.7% | +10.7% | +10.6% | +9.5% | +6.5% |
| 2022-07 | +10.8% | +11.7% | +11.6% | +10.8% | +7.2% |
| 2022-08 | +10.1% | +10.7% | +10.7% | +10.6% | +6.7% |
| 2022-09 | +10.2% | +10.7% | +10.5% | +11.0% | +6.5% |
| 2022-10 | +12.9% | +12.8% | +13.3% | +13.9% | +10.0% |
| 2022-11 | +11.7% | +11.6% | +12.1% | +12.7% | +9.2% |
| 2022-12 | +15.5% | +14.6% | +15.9% | +16.8% | +14.0% |
| 2023-01 | +8.8% | +8.4% | +9.1% | +9.5% | +7.3% |
| 2023-02 | +9.1% | +9.2% | +9.3% | +9.4% | +7.2% |
| 2023-03 | +5.5% | +6.1% | +5.7% | +5.4% | +3.5% |
| 2023-04 | +6.8% | +7.8% | +7.1% | +6.3% | +4.7% |
| 2023-05 | +2.8% | +3.5% | +3.2% | +2.1% | +1.4% |
| 2023-06 | +0.9% | +1.7% | +1.3% | +0.3% | -0.5% |
| 2023-07 | -1.2% | -0.6% | -1.0% | -1.7% | -2.4% |
| 2023-08 | -0.3% | +0.4% | 0.0% | -0.8% | -1.5% |
| 2023-09 | -1.2% | -0.7% | -0.9% | -1.7% | -2.1% |
| 2023-10 | -3.2% | -2.9% | -2.9% | -3.6% | -3.8% |
| 2023-11 | -4.4% | -4.1% | -4.1% | -4.9% | -4.9% |
| 2023-12 | -4.9% | -4.6% | -4.5% | -5.5% | -5.4% |
| 2024-01 | -2.8% | -2.5% | -2.6% | -3.2% | -3.4% |
| 2024-02 | -3.9% | -4.2% | -3.6% | -3.8% | -4.3% |
| 2024-03 | -4.8% | -5.6% | -4.8% | -4.3% | -4.8% |
| 2024-04 | -5.0% | -6.3% | -5.0% | -4.3% | -4.6% |
| 2024-05 | -2.6% | -3.7% | -2.8% | -1.8% | -2.1% |
| 2024-06 | -1.4% | -2.6% | -1.4% | -0.6% | -0.9% |
| 2024-07 | -2.3% | -3.4% | -2.3% | -1.4% | -2.1% |
| 2024-08 | -2.6% | -3.7% | -2.6% | -1.6% | -2.3% |
| 2024-09 | -1.7% | -2.4% | -1.6% | -0.9% | -1.7% |
| 2024-10 | -0.2% | -0.6% | -0.2% | +0.3% | -0.3% |
| 2024-11 | +0.6% | +0.1% | +0.8% | +1.3% | +0.1% |
| 2024-12 | +0.4% | +0.1% | +0.4% | +1.1% | -0.6% |
| 2025-01 | +1.4% | +1.2% | +1.7% | +2.1% | 0.0% |
| 2025-02 | +2.0% | +2.3% | +2.2% | +2.6% | +0.3% |
| 2025-03 | +3.9% | +3.2% | +3.9% | +4.8% | +3.0% |
| 2025-04 | +2.2% | +2.5% | +2.5% | +2.7% | +0.4% |
| 2025-05 | +1.4% | +2.1% | +1.8% | +1.8% | -1.0% |
| 2025-06 | +2.6% | +4.6% | +3.4% | +2.4% | -1.1% |
| 2025-07 | +3.8% | +5.2% | +4.5% | +3.8% | +0.7% |
| 2025-08 | +3.7% | +4.9% | +4.7% | +3.5% | +0.7% |
| 2025-09 | +1.2% | +2.0% | +2.2% | +1.3% | -1.7% |
| 2025-10 | +1.1% | +1.8% | +2.3% | +1.3% | -2.1% |
| 2025-11 | +1.9% | +2.4% | +2.7% | +2.4% | -0.9% |
| 2025-12 | +2.3% | +2.3% | +3.1% | +2.9% | -0.3% |
| 2026-01 | +2.9% | +2.6% | +3.8% | +3.8% | +0.4% |
| 2026-02 | +2.4% | +2.1% | +3.7% | +3.2% | -0.6% |
| 2026-03 | +2.3% | +3.0% | +4.0% | +3.0% | -2.4% |
Source: HM Land Registry House Price Index for Maidstone, January 1995 to March 2026.
Sold House Prices in Maidstone
The average sold price across all property types in Maidstone is £365,560, which is 26.1% above the England average of £289,946 as of March 2026. That premium is a house-price premium, not a flat one. Detached houses run 34.4% above England and semi-detached 36.2% above, while flats are the one type priced below the national figure, at 12.6% under. The pattern says something about the borough's stock: this is a market of family houses and village detacheds, with a thin apartment layer that trades locally rather than at institutional-investor prices.
| Property Type | Maidstone Average | England Average | Difference |
|---|---|---|---|
| Detached houses | £632,249 | £470,492 | +34.4% |
| Semi-detached houses | £392,498 | £288,185 | +36.2% |
| Terraced houses | £306,646 | £243,788 | +25.8% |
| Flats and maisonettes | £187,544 | £214,563 | -12.6% |
| All property types | £365,560 | £289,946 | +26.1% |
Detached houses at £632,249 carry the largest premium, 34.4% above England's £470,492. This is the Weald end of the borough, the period and modern detacheds on larger plots across TN17, TN27, ME17, and ME18, where a London-facing buyer pool competes for space. Annual growth of 3.0% points to steady rather than heated demand at the top of the market.
Semi-detached houses at £392,498 show the steepest premium of all, 36.2% above England's £288,185. This is the borough's mainstream family stock, and it is where demand from buyers priced out of detached homes concentrates. Annual growth of 4.0% is the strongest of any property type in Maidstone, which fits a market where the semi is doing the heavy lifting.
Terraced houses at £306,646 sit 25.8% above England's £243,788. The terraced stock clusters in the central postcodes, ME14, ME15, and ME16, where Victorian and Edwardian rows sit alongside 1930s streets. Annual growth of 3.0% keeps terraces in step with the wider market, and they remain the more affordable house type for a buy-to-let purchase.
Flats and maisonettes at £187,544 are the only type priced below England, a 12.6% discount to the £214,563 national average. Maidstone is not a flat-heavy town, and the small apartment stock reflects local demand rather than the large city-centre schemes that lift flat values in Brighton or Reading. Annual change of -2.4% confirms a softer market for flats, and it makes them the lowest entry point in a borough where houses carry a consistent premium.
Price Per Square Foot in Maidstone
Just £66 per square foot separates Maidstone's cheapest postcode from its most expensive, with ME16 at £372 and ME19 at £438. Price per square foot strips out property size and gives a cleaner read on location value. The narrow spread here matters: the borough's asking prices range by more than £300,000 across postcodes, but on a per-square-foot basis the gap is small, which tells you the headline price differences are driven mostly by how big the homes are, not by a step-change in build quality or location premium.
| Rank | Area | Price Per Sq Ft |
|---|---|---|
| 1 | ME16 (Maidstone West, Allington) | £372 |
| 2 | ME15 (Maidstone South, Loose) | £375 |
| 3 | ME14 (Maidstone East, Bearsted) | £382 |
| 4 | ME17 (Harrietsham, Lenham) | £389 |
| 5 | TN27 (Headcorn, Biddenden) | £389 |
| 6 | ME18 (Wateringbury, Mereworth) | £393 |
| 7 | ME20 (Aylesford, Ditton) | £399 |
| 8 | TN12 (Paddock Wood, Staplehurst) | £406 |
| 9 | TN17 (Cranbrook, Goudhurst) | £421 |
| 10 | ME19 (West Malling, Kings Hill) | £438 |
ME16 at £372 per square foot is the cheapest bricks-and-mortar value in the borough, and it is also the cheapest postcode by asking price. This is Maidstone West and Allington, a mix of terraces, semis, and a larger share of flats than anywhere else in the borough, which is what keeps the per-square-foot figure down. Based on 683 transactions analysed, ME16 sits 15% below the top of the table.
ME19 at £438 per square foot tops the table. Kings Hill, the modern business park and residential development that anchors ME19, draws corporate tenants and professional buyers, and the per-square-foot premium reflects that. The gap to central Maidstone is 17.7%, far smaller than the 54% asking-price gap between ME19 and ME16, which again points to bigger homes in ME19 rather than a fundamentally different quality of build. All 498 transactions analysed show a consistent premium over the central postcodes.
For Sale Asking Prices in Maidstone
ME16 at £347,843 and TN17 at £660,345 sit 89.8% apart, and the borough's ten postcodes split cleanly into two tiers around the £400,000 line. Four urban and edge-of-town postcodes cluster between £347,843 and £404,610, while six rural and semi-rural postcodes run from £504,403 up to £660,345. The mean asking price across all ten postcodes is £491,082.
| Rank | Area | Asking Price |
|---|---|---|
| 1 | ME16 (Maidstone West, Allington) | £347,843 |
| 2 | ME14 (Maidstone East, Bearsted) | £366,129 |
| 3 | ME15 (Maidstone South, Loose) | £376,871 |
| 4 | ME20 (Aylesford, Ditton) | £404,610 |
| 5 | ME17 (Harrietsham, Lenham) | £504,403 |
| 6 | ME19 (West Malling, Kings Hill) | £535,950 |
| 7 | TN12 (Paddock Wood, Staplehurst) | £538,797 |
| 8 | ME18 (Wateringbury, Mereworth) | £576,734 |
| 9 | TN27 (Headcorn, Biddenden) | £599,131 |
| 10 | TN17 (Cranbrook, Goudhurst) | £660,345 |
ME16 at £347,843 is the lowest way into Maidstone, followed by ME14 and ME15 within £30,000 of it. These three central postcodes plus ME20 are the only four below £405,000, and they are where a buy-to-let purchase in the borough starts. For an investor working to a fixed budget, the central cluster offers the most property for the money and the shortest step up between postcodes.
TN17 at £660,345 is the borough's ceiling, 89.8% above ME16. This is Cranbrook and Goudhurst, deep-Weald villages of period detached homes on large plots, where the buyer is more often a London equity downsizer than a local salary-earner. There is a £99,793 step between ME20 and ME17, the biggest jump in the table, and it is the line that divides the urban borough from the rural one. Older stock in the central postcodes includes properties that may require renovation; the works and eventual value depend on the individual property.
House Price Growth in Maidstone
Three Maidstone postcodes posted positive growth across all three timeframes: ME14 at 2.3% (one-year), 16.1% (three-year), and 10.8% (five-year), ME19 at 2.5%, 0.7%, and 9.6%, and TN17 at 2.5%, 12.3%, and 5.4%. Nine of the ten postcodes delivered a positive five-year return, but the shorter windows are patchy, with several urban and rural postcodes down over one or three years. The growth table shows a market that has been choppy since the 2022 peak rather than uniformly rising.
| Area | 1 Year | 3 Years | 5 Years |
|---|---|---|---|
| ME20 (Aylesford, Ditton) | -0.5% | 1.4% | 15.1% |
| ME14 (Maidstone East, Bearsted) | 2.3% | 16.1% | 10.8% |
| ME19 (West Malling, Kings Hill) | 2.5% | 0.7% | 9.6% |
| ME16 (Maidstone West, Allington) | -4.4% | -3.0% | 8.7% |
| ME17 (Harrietsham, Lenham) | 0.1% | -3.5% | 8.2% |
| TN17 (Cranbrook, Goudhurst) | 2.5% | 12.3% | 5.4% |
| ME15 (Maidstone South, Loose) | -2.2% | -6.0% | 2.6% |
| TN12 (Paddock Wood, Staplehurst) | -0.3% | -6.3% | 1.2% |
| TN27 (Headcorn, Biddenden) | -2.4% | -5.8% | 0.5% |
| ME18 (Wateringbury, Mereworth) | 1.0% | -5.8% | -2.4% |
ME20 has the highest five-year return in the borough at 15.1%, though it is down 0.5% over the past year. Aylesford and Ditton sit against the M20 and the Medway, an area of family stock near the logistics and warehousing employers, and the five-year figure reflects strong demand through the pandemic years. ME14 is the standout on the medium term, up 16.1% over three years and positive across every window, with Bearsted's sought-after village edge doing much of the work.
Among the rural postcodes, TN17 combines a 12.3% three-year gain with a softer 5.4% over five years, while ME18 is the one postcode down over five years at -2.4%. ME18 records just four sales a month, so a single transaction can swing its average, and the negative readings there are best read as thin-market noise rather than a settled trend.
ME16 shows the weakest one-year figure at -4.4%, and the central postcodes ME15 and ME16 have both slipped over one and three years even while holding positive five-year returns. That is the pandemic surge giving back some ground in the more affordable parts of the borough, where the earlier gains were largest.
Monthly Property Sales in Maidstone
Exit liquidity varies widely across Maidstone, with monthly sales running from 4 transactions in ME18 to 41 in ME15. The central postcodes are where the market is busiest, while the rural Weald postcodes are much thinner. Turnover rates, the share of local stock that changes hands each year, run from 4% to 14%.
| Area | Sales Per Month | Turnover | Asking Price |
|---|---|---|---|
| ME15 (Maidstone South, Loose) | 41 | 10% | £376,871 |
| ME16 (Maidstone West, Allington) | 38 | 13% | £347,843 |
| ME14 (Maidstone East, Bearsted) | 34 | 12% | £366,129 |
| TN12 (Paddock Wood, Staplehurst) | 29 | 8% | £538,797 |
| ME17 (Harrietsham, Lenham) | 28 | 9% | £504,403 |
| ME20 (Aylesford, Ditton) | 21 | 14% | £404,610 |
| ME19 (West Malling, Kings Hill) | 20 | 8% | £535,950 |
| TN27 (Headcorn, Biddenden) | 11 | 5% | £599,131 |
| TN17 (Cranbrook, Goudhurst) | 10 | 4% | £660,345 |
| ME18 (Wateringbury, Mereworth) | 4 | 5% | £576,734 |
ME20 records the highest turnover in the borough at 14% on mid-table volumes of 21 sales a month. A high turnover rate on a modest number of sales means the stock in Aylesford and Ditton changes hands more readily than the raw sales figure suggests, which for a buy-to-let investor points to a clearer exit route when the time comes to sell. The three central postcodes pair the highest sales volumes (34 to 41 a month) with steady 10% to 13% turnover, the conventional pattern for an established urban market.
At the other end, TN17 and ME18 sit at 4% and 5% turnover on single-figure monthly sales. These are low-volume, owner-occupier village markets where properties sit longer and sell rarely, so a landlord in the rural Weald should expect a slower sale when exiting rather than the quick turnaround the central postcodes offer.
How Long Properties Take to Sell in Maidstone
Among the three central postcodes with reliable sale-timing data, ME14 (Maidstone East, Bearsted) clears fastest at about 203 days, while ME15 (Maidstone South, Loose) is slowest at roughly 304 days. Days on market is the typical number of days a home is up for sale before it sells, and months of unsold stock shows how much for-sale supply is sitting there at the current rate of sales. Only the central postcodes carry enough for-sale listings to read this reliably; the rural postcodes are too thin to time with any confidence.
| Area | Avg Days to Sell | Months of Unsold Stock | Market |
|---|---|---|---|
| ME14 (Maidstone East, Bearsted) | 203 | 6.7 | Balanced market |
| ME16 (Maidstone West, Allington) | 254 | 8.3 | Balanced market |
| ME15 (Maidstone South, Loose) | 304 | 10.0 | Balanced market |
A yield number tells you nothing about how quickly you can get back out again. ME14's 6.7 months of unsold stock is the quickest turnaround of the three, while ME15's 10.0 months means a home there can take the best part of a year to shift. For a landlord planning an eventual exit, the faster-moving central postcode is the less time spent carrying a property you are trying to sell.
What Type of Property Can You Buy in Maidstone?
Detached homes are the largest single category in most Maidstone postcodes, from 22.9% of stock in ME20 to 61.7% in TN27, while terraces and flats concentrate in the central postcodes ME16 and ME20. The mix shapes which strategies fit where. The figures below are drawn from 2021 Census records for each postcode.
| Area | Detached | Semi-detached | Terraced | Flats |
|---|---|---|---|---|
| ME14 (Maidstone East, Bearsted) | 49.1% | 25.5% | 15.2% | 7.9% |
| ME15 (Maidstone South, Loose) | 35.5% | 34.3% | 19.6% | 9.2% |
| ME16 (Maidstone West, Allington) | 24.0% | 32.8% | 22.3% | 18.3% |
| ME17 (Harrietsham, Lenham) | 54.0% | 26.0% | 10.7% | 4.8% |
| ME18 (Wateringbury, Mereworth) | 42.2% | 29.6% | 10.9% | 5.5% |
| ME19 (West Malling, Kings Hill) | 48.8% | 29.1% | 13.5% | 5.6% |
| ME20 (Aylesford, Ditton) | 22.9% | 39.5% | 27.3% | 9.7% |
| TN12 (Paddock Wood, Staplehurst) | 50.2% | 31.8% | 8.9% | 3.7% |
| TN17 (Cranbrook, Goudhurst) | 58.4% | 26.7% | 9.5% | 4.3% |
| TN27 (Headcorn, Biddenden) | 61.7% | 22.3% | 6.2% | 3.2% |
ME16 holds the largest share of flats at 18.3% and one of the highest terraced shares at 22.3%. That is the smaller-unit stock that usually forms the buy-to-let market, and it lines up with ME16 carrying the lowest asking price and the cheapest price per square foot in the borough. ME20 is similar in a different way, weighted towards semis (39.5%) and terraces (27.3%) rather than detacheds, which fits its position as the borough's highest-yielding postcode.
The Weald postcodes sit at the opposite end. TN27 is the most detached-dominated at 61.7%, with the smallest flat share at 3.2%, and TN17 and TN12 are close behind. Detached and semi-detached houses together account for more than 80% of the stock in each, which matches their premium asking prices and lower yields. The housing here is weighted towards owner-occupier family homes rather than the smaller units that drive rental income.
Flats combine purpose-built and converted units. A small share of mobile and temporary dwellings is not shown, so rows may not total 100%.
Maidstone Rental Market Analysis
Monthly rents in Maidstone range from £1,247 in ME15 to £1,950 in ME19, with gross rental yields from 2.9% to 4.8% across the eight postcodes with enough rental listings to read. For investors weighing up whether buy-to-let is worth it in Maidstone, the sections below break down rents, yields, and tenant affordability postcode by postcode. If you are working out how to start a property business in the South East, Maidstone's mix of commuter access and sub-regional pricing makes it a borough where the rental numbers are worth reading one postcode at a time. Browse current buy-to-let property for sale across the region.
Average Rent & Gross Rental Yields in Maidstone
Gross rental yields in Maidstone range from 2.9% in TN17 to 4.8% in ME20. The top yield sits with a mid-priced postcode rather than the cheapest or the dearest: ME20 pairs an asking price of £404,610 with the borough's second-highest rent of £1,627, and that combination is what lifts its yield above the rest. Two postcodes, ME18 and TN27, have too few rental listings to give a reliable rent or yield.
| Area | Average Monthly Rent | Asking Price | Gross Yield |
|---|---|---|---|
| ME20 (Aylesford, Ditton) | £1,627 | £404,610 | 4.8% |
| ME16 (Maidstone West, Allington) | £1,317 | £347,843 | 4.5% |
| ME19 (West Malling, Kings Hill) | £1,950 | £535,950 | 4.4% |
| ME14 (Maidstone East, Bearsted) | £1,285 | £366,129 | 4.2% |
| ME15 (Maidstone South, Loose) | £1,247 | £376,871 | 4.0% |
| TN12 (Paddock Wood, Staplehurst) | £1,726 | £538,797 | 3.8% |
| ME17 (Harrietsham, Lenham) | £1,424 | £504,403 | 3.4% |
| TN17 (Cranbrook, Goudhurst) | £1,585 | £660,345 | 2.9% |
| ME18 (Wateringbury, Mereworth) | Not enough data | £576,734 | Not enough data |
| TN27 (Headcorn, Biddenden) | Not enough data | £599,131 | Not enough data |
ME20 at 4.8% is the top yield in Maidstone. It benefits from proximity to the M20 junction and the Aylesford industrial area, which draws tenant demand from workers in logistics, warehousing, and light manufacturing, and its £1,627 rent is high for an asking price of £404,610. A 30% deposit of £121,383 buys into the borough's highest-yielding postcode.
ME16 at 4.5% comes second, and it does it the other way round, on the lowest asking price in the borough (£347,843) rather than a high rent. TN17 at 2.9% sits at the bottom: its £1,585 rent is respectable, but against a £660,345 asking price the income return is compressed, which is the recurring story at the top of Maidstone's price range, where high rents cannot keep pace with Weald asking prices.
Is Maidstone Rent High?
Monthly rents in Maidstone consume between 39.2% and 61.3% of the local median gross monthly salary. The widely cited threshold for rent affordability is 30% of gross income, and every postcode in the borough sits above it. That is the direct result of the borough's wage-to-price gap: asking prices carry a South East premium while local earnings run below the regional median, so rents take a large bite of a single local salary.
The median gross weekly salary in Maidstone is £734.40, which equates to £3,183 per month or £38,191 per year. This is below the South East regional median of £800.30 per week and below the Great Britain median of £752.40 per week. Data from the Nomis Labour Market Profile (ASHE 2025).
| Rank | Area | Rent as % of Income |
|---|---|---|
| 1 | ME19 (West Malling, Kings Hill) | 61.3% |
| 2 | TN12 (Paddock Wood, Staplehurst) | 54.2% |
| 3 | ME20 (Aylesford, Ditton) | 51.1% |
| 4 | TN17 (Cranbrook, Goudhurst) | 49.8% |
| 5 | ME17 (Harrietsham, Lenham) | 44.8% |
| 6 | ME16 (Maidstone West, Allington) | 41.4% |
| 7 | ME14 (Maidstone East, Bearsted) | 40.4% |
| 8 | ME15 (Maidstone South, Loose) | 39.2% |
| - | ME18 (Wateringbury, Mereworth) | Not enough data |
| - | TN27 (Headcorn, Biddenden) | Not enough data |
ME15 at 39.2% is the closest thing to affordable in the borough, with ME14 (40.4%) and ME16 (41.4%) not far behind. The three central postcodes sit lowest because they pair the lowest rents (£1,247 to £1,317) with the local median salary, and for a landlord that headroom matters: tenants who are not stretched to the limit tend to pay on time and stay put. Even here, though, rent takes close to 40% of a single local wage, which points to households on two incomes or with a London earner as the realistic tenant.
ME19 at 61.3% is the least affordable against a single local salary, but the figure needs reading with care. Kings Hill's £1,950 rent reflects larger family homes let to dual-income professionals and corporate tenants, not single earners on the borough median, so the practical affordability for the actual tenant profile there is better than the headline ratio suggests.
How Big Is Maidstone's Private Rented Sector?
The private rented sector is deepest in ME18 and TN17, where it accounts for 18.4% and 16.9% of households, and shallowest in ME20 at 11.0%. The share of homes already rented privately is a guide to how large the established tenant pool is and how active the local lettings market. Set against the owned and social-rented shares below, it shows where renting is already part of the fabric and where it is the exception.
| Area | Owned Outright | Owned with Mortgage | Private Rented | Social Rented |
|---|---|---|---|---|
| ME18 (Wateringbury, Mereworth) | 45.8% | 29.3% | 18.4% | 5.7% |
| TN17 (Cranbrook, Goudhurst) | 45.8% | 32.0% | 16.9% | 4.5% |
| TN12 (Paddock Wood, Staplehurst) | 43.9% | 34.4% | 16.3% | 4.3% |
| ME16 (Maidstone West, Allington) | 36.5% | 33.4% | 15.5% | 12.4% |
| ME14 (Maidstone East, Bearsted) | 41.3% | 37.8% | 15.4% | 4.8% |
| ME17 (Harrietsham, Lenham) | 43.3% | 34.8% | 15.2% | 5.6% |
| TN27 (Headcorn, Biddenden) | 47.7% | 32.7% | 13.6% | 5.1% |
| ME15 (Maidstone South, Loose) | 38.0% | 35.7% | 13.3% | 11.3% |
| ME19 (West Malling, Kings Hill) | 40.7% | 37.1% | 13.2% | 8.3% |
| ME20 (Aylesford, Ditton) | 33.3% | 38.3% | 11.0% | 16.1% |
The private rented sector in Maidstone is fairly even across the borough, sitting between 11.0% and 18.4% of households everywhere, without a standout lettings hub. The Weald postcodes ME18, TN17, and TN12 have the largest rented shares, which reflects a mix of village lets and second homes rather than a deep local tenant market. ME20, the highest-yielding postcode, actually has the smallest private rented sector at 11.0% and the largest social rented share at 16.1%, a reminder that yield and the size of the existing lettings market are two different signals.
Only the three central postcodes carry enough rental listings to read the lettings market with any confidence. Across ME14, ME15, and ME16 the picture is a landlord's market at the moment: homes are letting in roughly 32 to 43 days, and there is a little over a month of rental stock available at a time, which points to demand running ahead of supply rather than a glut. The rural postcodes have too few rental listings at any one time to read reliably.
Local Housing Allowance Rates in Maidstone
Most of Maidstone falls within the Maidstone Broad Rental Market Area, where Local Housing Allowance runs from £102.37 a week for a shared room to £356.71 a week for a four-bedroom home, but two Weald postcodes sit in different areas with their own rates. Local Housing Allowance sets the maximum housing support a tenant on benefits can receive, so it fixes what the benefit will meet; market rents can sit above or below it. Eight of the borough's ten postcodes use the Maidstone rates below; TN17 falls in the High Weald BRMA and TN27 in the Ashford BRMA. To check the current rate for a specific address, you can use the government's official Local Housing Allowance calculator.
| Property Size | Weekly LHA Rate | Monthly Equivalent |
|---|---|---|
| Shared accommodation | £102.37 | £444 |
| 1 bedroom | £172.60 | £748 |
| 2 bedrooms | £208.27 | £903 |
| 3 bedrooms | £276.16 | £1,197 |
| 4 bedrooms | £356.71 | £1,546 |
The two-bedroom Maidstone rate of £208.27 a week works out at about £903 a month, well below the £1,247 to £1,950 open-market rents recorded across the borough's postcodes. A benefit-backed tenancy at the LHA rate therefore sits under Maidstone's market rents, and the stock that fits within these rates is concentrated in the central postcodes, where both asking prices and rents are lowest. The two Weald exceptions run a little higher for larger homes: the High Weald area covering TN17 pays £247.40 a week for a two-bed and £420.00 for a four-bed, while the Ashford area covering TN27 pays £195.62 and £331.40 respectively.
Buy-to-Let Considerations
Are House Prices High in Maidstone? Price-to-Earnings Ratios
Purchasing a property in Maidstone requires between 9.1 and 17.3 times the median annual salary. This is based on the Nomis Labour Market Profile for Maidstone showing the median gross annual income for Maidstone residents is £38,191.
As a yardstick, England's average sold price of £289,946 works out at 7.4 times the Great Britain median salary of £39,125. Every Maidstone postcode runs above that, which is normal for the South East commuter belt, but the gap is stretched further here because local wages of £38,191 sit below the national median while asking prices carry a regional premium.
| Rank | Area | Price-to-Earnings Ratio |
|---|---|---|
| 1 | ME16 (Maidstone West, Allington) | 9.1x |
| 2 | ME14 (Maidstone East, Bearsted) | 9.6x |
| 3 | ME15 (Maidstone South, Loose) | 9.9x |
| 4 | ME20 (Aylesford, Ditton) | 10.6x |
| 5 | ME17 (Harrietsham, Lenham) | 13.2x |
| 6 | ME19 (West Malling, Kings Hill) | 14.0x |
| 7 | TN12 (Paddock Wood, Staplehurst) | 14.1x |
| 8 | ME18 (Wateringbury, Mereworth) | 15.1x |
| 9 | TN27 (Headcorn, Biddenden) | 15.7x |
| 10 | TN17 (Cranbrook, Goudhurst) | 17.3x |
ME16 at 9.1x is the most affordable postcode against local earnings, followed by ME14 and ME15. All three central postcodes sit around 9 to 10 times income, which is above the national benchmark of 7.4x but consistent with the South East as a whole. For a buy-to-let purchase, these are the postcodes where mortgage affordability will pass a lender's stress test most easily.
TN17 at 17.3x is more than double the national benchmark, and it reflects a fundamentally different buyer. Cranbrook and Goudhurst attract London equity downsizers and lifestyle buyers rather than local salary-earners, so the price-to-earnings ratio says less about local affordability than it does about where the money comes from. For an investor, the elevated ratio flags where lender stress tests will bite hardest and where the payback period runs longest.
Deposit Requirements in Maidstone
A 30% deposit on a buy-to-let property in Maidstone ranges from £104,353 in ME16 to £198,104 in TN17. The gap between the cheapest and most expensive deposit is £93,751, close to the size of a whole second deposit in the central postcodes. For investors comparing Maidstone with other South East locations, these deposit requirements sit above the county's coastal towns but below the west-Kent commuter belt.
Beyond the deposit, the stamp duty calculator and other buy-to-let running costs affect the total capital required.
| Rank | Area | 30% Deposit Required |
|---|---|---|
| 1 | ME16 (Maidstone West, Allington) | £104,353 |
| 2 | ME14 (Maidstone East, Bearsted) | £109,839 |
| 3 | ME15 (Maidstone South, Loose) | £113,061 |
| 4 | ME20 (Aylesford, Ditton) | £121,383 |
| 5 | ME17 (Harrietsham, Lenham) | £151,321 |
| 6 | ME19 (West Malling, Kings Hill) | £160,785 |
| 7 | TN12 (Paddock Wood, Staplehurst) | £161,639 |
| 8 | ME18 (Wateringbury, Mereworth) | £173,020 |
| 9 | TN27 (Headcorn, Biddenden) | £179,739 |
| 10 | TN17 (Cranbrook, Goudhurst) | £198,104 |
ME16 is the cheapest way into Maidstone, at a £104,353 deposit. Stepping up to ME20 costs roughly £17,000 more, and that outlay buys a different profile rather than just a bigger number: ME20 is the borough's highest-yielding postcode at 4.8% and its best five-year growth at 15.1%, in an area where 14% of homes change hands a year. ME16 keeps the entry cost down on the lowest asking price in the borough; ME20 trades that for the stronger income and growth pairing. Repossessed houses for sale can occasionally offer below-asking entry points in any of these postcodes.
At the other end, the deposits climb steeply through the Weald. ME18 and TN27 are within £6,700 of each other on deposit, at £173,020 and £179,739, but they are not the same investment: both are thin, low-turnover village markets, and neither carries enough rental listings to give a reliable yield, so the higher deposit buys into a slower, more owner-occupier-led market than the numbers in the central postcodes.
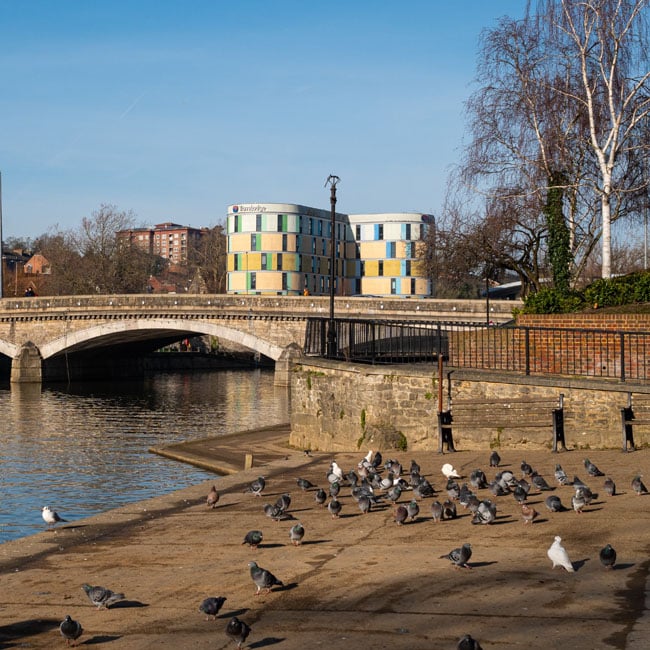
What the Maidstone Data Tells Buy-to-Let Investors
In Maidstone the best yield does not sit with the cheapest postcode or the dearest, but in the middle with ME20. ME20 (Aylesford, Ditton) has the top yield at 4.8%, the borough's strongest five-year growth at 15.1%, and the highest turnover at 14%, on an asking price of £404,610 and a 30% deposit of £121,383 for a home renting at £1,627 a month. It is the one postcode where yield, growth, and liquidity line up.
The three central postcodes give the lowest way in. ME16 (Maidstone West, Allington) is the cheapest to buy at £347,843 for an investment property, with the cheapest deposit at £104,353 and a 4.5% yield. ME14 (Maidstone East, Bearsted) is the only postcode positive across one, three, and five years, up 16.1% over three, and both it and ME15 keep rent below 41% of local income, which supports steadier occupancy than the pricier postcodes.
The rural Weald postcodes (ME17, ME18, TN12, TN17, TN27) tell the opposite story: high asking prices from £504,403 up to £660,345, yields of 2.9% to 3.8% where the data exists, and thin transaction volumes. Two of them, ME18 and TN27, do not carry enough rental listings to give a yield at all, which marks them as owner-occupier village markets rather than buy-to-let territory. Buyers who want to come in below the asking prices here often work through off-market property channels.
Maidstone does not run a selective licensing scheme for private landlords at borough level, though a larger shared house still needs a mandatory HMO licence. You can check the current position on Maidstone Borough Council's HMO licensing page. With population growth well above the national rate and a wage base that runs below the region, Maidstone reads as a borough where the strongest tenant demand and the best returns sit at the affordable end, not the premium one.
How Maidstone Compares
Maidstone's mean asking price of £491,082 is the highest of six South East locations compared here, and its top yield of 4.8% is the lowest, the clearest sign of the Kent premium at work. The comparison below places Maidstone alongside five nearby locations, each with a different investor profile. The mean asking price and mean monthly rent are simple averages across all postcodes with data, and the top gross yield is the single highest postcode yield in each location.
| Location | Mean Asking Price | Mean Monthly Rent | Mean Gross Yield | Top Yield (postcode) |
|---|---|---|---|---|
| Eastbourne | £331,156 | £1,349 | 4.9% | 5.8% (BN24) |
| Medway | £339,902 | £1,333 | 4.7% | 6.3% (ME4) |
| Hastings | £375,731 | £1,155 | 3.7% | 4.7% (TN38) |
| Crawley | £407,518 | £1,492 | 4.4% | 5.0% (RH11) |
| Canterbury | £412,829 | £1,360 | 4.0% | 5.2% (CT1) |
| Maidstone | £491,082 | £1,520 | 3.7% | 4.8% (ME20) |
Maidstone is the most expensive location in this comparison at £491,082 mean asking price, and its top yield of 4.8% is the lowest of the six. That is the trade-off it presents: a wealthier, more spread-out borough with higher asking prices and thinner headline yields than its neighbours. Its mean monthly rent of £1,520 is the second-highest in the group, behind only Crawley, which softens the yield gap but does not close it.
For investors prioritising income, the Medway towns at 6.3% and Eastbourne at 5.8% deliver the highest top-line yields on the lowest asking prices in the group. Canterbury at 5.2% pairs a university tenant base with a mid-range price, and Crawley at 5.0% sits nearest Gatwick with an airport-driven tenant market. Hastings combines a lower coastal entry point with a 4.7% top yield. Maidstone competes for a different investor: one who wants the county-town position and larger-home stock, and accepts a lower yield for it. For a data-driven comparison across all UK locations, see our top buy-to-let locations guide.
Frequently Asked Questions
Is Maidstone a good place to live for buy-to-let tenants?
For a lot of tenants, yes, and it comes down to work and connections. Maidstone is the administrative centre of Kent, so there is a steady base of public-sector, logistics, retail, and health jobs, and the employment rate of 81.3% sits above the national 75.6%. The catch is affordability: local wages of £38,191 run below both the South East and Great Britain medians, so a single earner is stretched by the borough's rents.
It also suits commuters. Direct trains to London Victoria and, via Strood, to London St Pancras mean a share of tenants earn London wages while renting in Kent, and that London-facing demand is a big part of what has kept the rental market fed as the population grew 13.3% in a decade.
What are the best areas in Maidstone for property investment?
The borough splits into three tiers. The central postcodes (ME14, ME15, ME16) are the cheapest way in, from £347,843 in ME16, with the busiest sales markets and rents that take under 41% of local income. ME20 (Aylesford, Ditton) sits between the town and the rural fringe, and it carries the borough's top yield at 4.8% and its strongest five-year growth at 15.1%.
The Weald postcodes (ME17, ME18, TN12, TN17, TN27) are the premium, larger-home end, priced from £504,403 up to £660,345, with lower yields and thinner transaction volumes. So if income and growth together matter most, ME20 leads; if the lowest entry cost matters most, ME16 does; the Weald is more owner-occupier territory than buy-to-let.
How does Maidstone compare to Canterbury for buy-to-let?
They pull in different directions. Maidstone has the higher asking prices, a mean of £491,082 against Canterbury's £412,829, and a slightly lower top yield, 4.8% versus 5.1%. Canterbury's rental demand leans on its two universities, which brings a student market and the seasonal pattern that comes with it. Maidstone's demand is more commuter and local-worker led, along the M20 corridor and the London rail lines.
On rent, Maidstone's mean of £1,520 a month runs ahead of Canterbury's £1,360, which is why the yield gap between them is narrow despite the price difference. Both sit within Kent and are covered in our Kent buy-to-let guide.
Can I find buy-to-let property under £350,000 in Maidstone?
Only just, and only in one postcode on average. ME16 (Maidstone West, Allington) is the cheapest at an asking price of £347,843, so the borough as a whole sits right on that line. Below it, the way in is by property type rather than postcode: flats across Maidstone average £187,544 on the Land Registry index, well under the house prices, and the central postcodes hold most of the terraced and flatted stock. If sub-£350,000 is the target, ME16 flats and terraces are where to look, or explore below market value properties.
Is there demand for student accommodation in Maidstone?
Some, but it is a smaller factor here than in a university city like Canterbury. Maidstone has further and higher education provision rather than a large campus population, so the rental market runs more on commuters and local workers than on students. For a purely student-led investment, a dedicated university town is usually the better fit, and our guide to purpose-built student accommodation covers that end of the market.
On the HMO side, the room data for Maidstone is thin. A sample of double rooms with a shared bathroom in ME16 puts the typical rent at around £153 a week, with most between £111 and £173, and a similar figure of about £148 in ME15. Those were the only room types with enough live adverts to read, so ensuite and single-room rents across the borough are harder to pin down. For how the numbers work on a shared house, see our complete guide to investing in HMOs.
When will the Maidstone East development affect property prices?
Not for a few years yet. The Maidstone East scheme, 180 apartments on the former Royal Mail sorting office site next to the station, has planning approval but has still to be built, so any effect on the wider market is some way off. Its more immediate value is that it adds central flat stock in a borough where the apartment layer is thin, which matters more for the type of stock available than for headline prices.
The Shepway estate regeneration, delivering 119 homes in its first phase in early 2026, is affordable-led, so its effect is on the rental pool and local supply rather than on open-market prices. New homes at that end tend to steady a rental market rather than move sold prices.
What are average house prices in Maidstone?
The average sold price across Maidstone is £365,560 on the Land Registry index, about 26.1% above the England average of £289,946 and 3.4% below the South East average of £378,515 as of March 2026. Asking prices by postcode run from £347,843 in ME16 (Maidstone West, Allington) up to £660,345 in TN17 (Cranbrook, Goudhurst), with a borough-wide mean of £491,082. By type, detached homes average £632,249, semi-detached £392,498, terraced £306,646, and flats £187,544.
Through a buy-to-let lens, ME16 is the cheapest entry and ME20 the highest-yielding at 4.8%, while the Weald postcodes are the dearest and lowest-yielding.
What are the Local Housing Allowance rates in Maidstone?
Most of the borough uses the Maidstone Broad Rental Market Area rates. As of June 2026 those run at £102.37 a week for a shared room, £172.60 for a one-bed, £208.27 for two beds, £276.16 for three, and £356.71 for four. Two Weald postcodes are exceptions: TN17 falls in the High Weald area (higher for larger homes, at £247.40 for a two-bed) and TN27 in the Ashford area (a little lower, £195.62 for a two-bed). The LHA figure is the most a tenant on housing support can claim towards rent, so it fixes the benefit's contribution rather than the rent itself.
What type of property is most common in Maidstone?
Detached houses, in most postcodes, and overwhelmingly so in the Weald. They run from 22.9% of stock in ME20 up to 61.7% in TN27. The smaller homes that usually suit buy-to-let, terraces and flats, are most concentrated in ME16, at 22.3% and 18.3%, and in ME20, which is heavy on semis and terraces. The rural postcodes hold the fewest flats, with TN27 at just 3.2%.
How do I buy an investment property in Maidstone?
Start by deciding whether you are buying for income, growth, or the lowest entry cost, because in Maidstone those point at different postcodes. ME20 (Aylesford, Ditton) pairs the top yield at 4.8% with the strongest five-year growth at 15.1%. ME16 (Maidstone West, Allington) is the cheapest at £347,843. Budget for a 30% deposit, which runs from £104,353 in ME16 to £198,104 in TN17.
Beyond what is listed openly, plenty of experienced investors buy below asking through off market properties and BMV property. To see what is available now, browse investment properties or buy-to-let homes for sale.
Ready to buy property?
Browse investment properties with prices and gross yields shown for each opportunity.
Get property alerts