Manchester Population | Growth, Density & Home Ownership Statistics
Manchester's population growth is a strong reason behind its ongoing transformation.
The changing skyline, from city centre skyscrapers to sprawling suburban housing estates and new home developments, clearly reflects the demographic shifts revealed in housing trend data.
Manchester's significant population growth (+9.70% since 2011) combines with one of the highest proportions of renters in the country, 62.0% of all households rent privately or socially. This high level of renting notably surpasses even London's overall rental rate (approximately 53.3%). Showing lower rental and higher population and property ownership stats in London.
This local Manchester rental market, alongside considerably lower-than-average homeownership rates (38.0%), underscores a strong, persistent tenant demand within Manchester, particularly relevant for landlords looking to buy a property investment. This demand is reflected in Manchester's high rental yields.
Furthermore, Manchester's high population density, especially in central postcodes like M4, points towards intense land use and the continued importance of optimising living for small spaces, which is especially important in smaller apartments where developers are maximising volume.
Below we provide a range of datasets across Manchester postcodes, including population stats, housing tenure, rental and ownership statistics across the city.
Providing an interesting look at demographic and ownership data for buy-to-let investors in Manchester.
Article updated: April 2025.
Manchester Population & Housing: Key Statistics
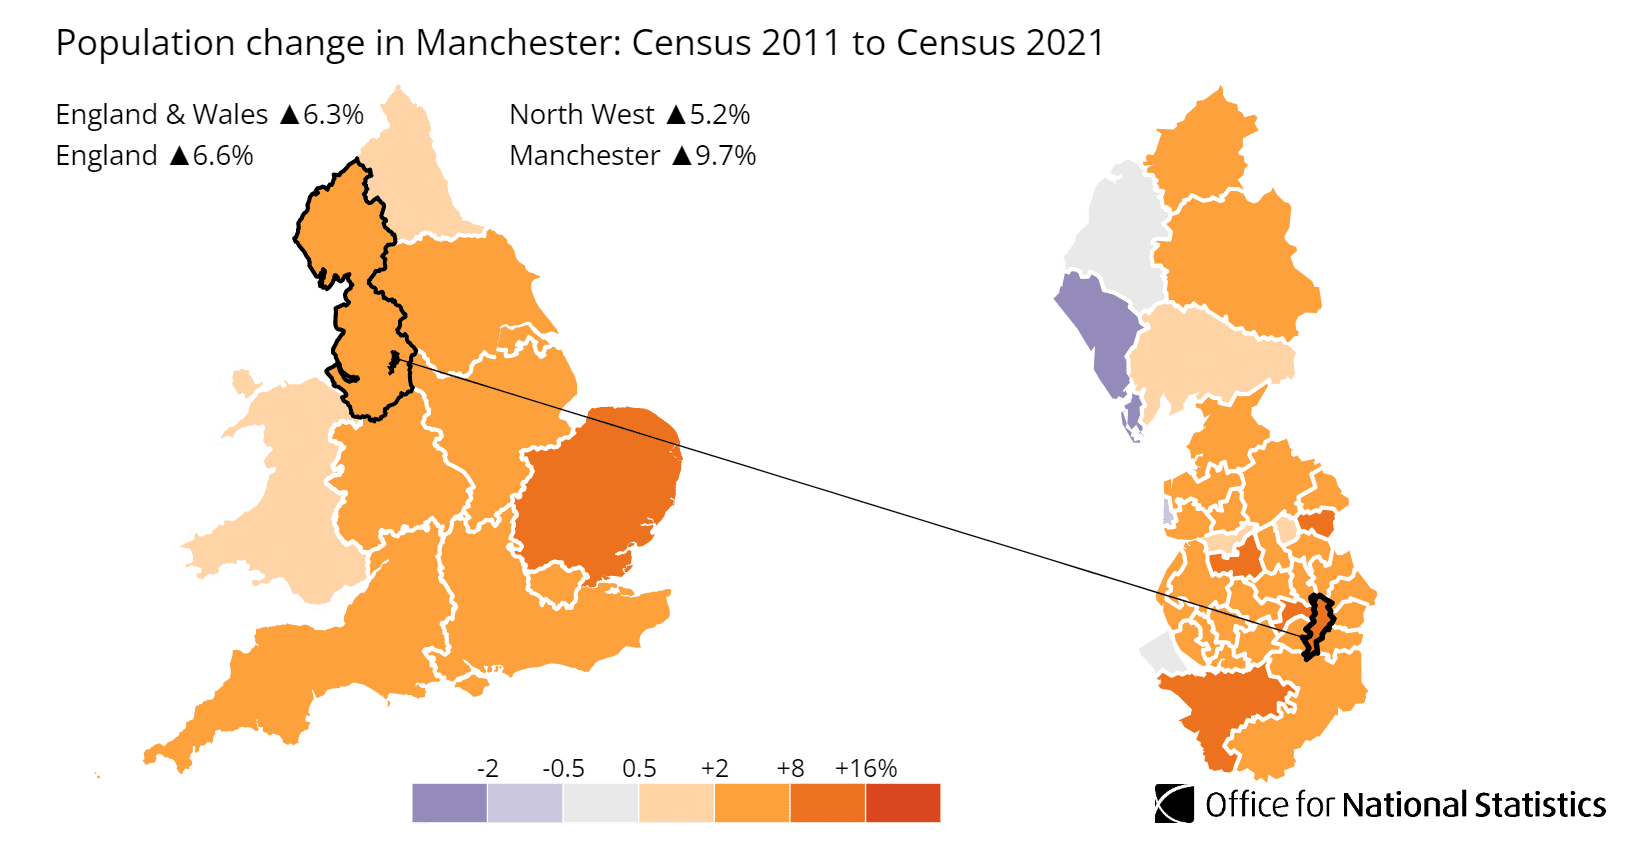
- Manchester's population reached 551,938 residents in the 2021 Census, marking a 9.70% growth since 2011 (outpacing both the North West's 5.20% and England's 6.60% growth).
- Homeownership in Manchester stands at 38.0% (owned outright or with a mortgage), significantly lower than the 62.3% average across England.
- Conversely, renting is more prevalent: 32.5% of households rent privately (vs. 20.6% nationally) and 29.5% rent socially (vs. 17.1% nationally).
- The city's overall population density is 4,772 people per square kilometre, much higher than the North West (525) and England (433) averages.
- The most densely populated postcode areas include M4 (Northern Quarter) (25,848 people/sq mile), M14 (Fallowfield) (24,422 people/sq mile), and M15 (Hulme) (21,841 people/sq mile).
Contents

-
by Robert Jones, Founder of Property Investments UK
With two decades in UK property, Rob has been investing in buy-to-let since 2005, and uses property data to develop tools for property market analysis.
Property Data Sources
Our location guide relies on authoritative datasets including:
Demographic data may not be updated until the next national Government Census, however we check our population statistics with latest Government publications annually to ensure accuracy and check for any changes. Last update: April 2025. Next update: April 2026. All data is presented as provided by our sources without adjustments or amendments.
Manchester Population Statistics Finder
Select your region to find statistics about the local population and housing tenure. Perfect for investors, landlords, researchers, journalists, and market analysts.
Your population and housing statistics will appear here after selecting a region and area.
Manchester Population by Postcode
Use this interactive tool to explore and compare Manchester population statistics by postcodes. Compare population density, household counts, and total population across different Manchester regions. Data from the 2021 Census.
Showing data for: All Manchester Regions | Sorted by: Population (High to Low)
| Postcode | Area | Population (2021) | Population Density |
|---|
Data source: Office for National Statistics (ONS) Census 2021 Housing Tenure data.
Tool © 2025 Created by Property Investment Company www.propertyinvestmentsuk.co.uk.
Love our Manchester population by postcode tool? Please share this page with attribution.
Manchester Population Growth
The total population of Manchester was around 551,900 as of the 2021 Manchester Census.
Manchester's population has grown by 9.7%, rising from around 503,100 in 2011. This growth has driven house prices up recently across the city, however, there are still many affordable postcodes to live across Manchester.
This growth rate significantly outpaced both the North West region (5.2%) and England overall (6.6%), making it the third-largest percentage increase in the North West, behind only Salford (15.4%) and Chorley (9.9%).
The average (median) age in Manchester increased from 29 to 31 years between the two censuses. This indicates a notably younger demographic profile compared to both the North West region and England overall, which had median ages of 40 years. Despite the slight increase, Manchester maintained its position as having the lowest average age in the North West.
Notable age-related changes in Manchester's population between 2011 and 2021 include:
- The number of residents aged 50-64 years increased by approximately 16,900 (a 27.4% rise)
- The 20-24 age group decreased by around 5,100 (a 7.6% reduction)
- The proportion of residents aged 50-64 grew by 2.0 percentage points, now representing 14.3% of the population
Population density in Manchester has also increased, with the area now home to approximately 34.1 people per football pitch-sized piece of land, up from 31.1 in 2011. This makes Manchester the most densely populated local authority area across the North West.
This puts pressure on housing demand in already popular areas, and is one of the reasons the most expensive street in Manchester is well over £2 million per property sale.

