Buy to Let in Caernarfon: Historic Five-Year Growth of 29.8%
Caernarfon is a walled town in Gwynedd, North West Wales, UK. Five-year asking price growth reaches 29.8% in LL55, with average sold prices across Gwynedd sitting 8.7% below the Wales average at £196,260. Between the 2011 and 2021 censuses, Gwynedd's population fell 3.7% to 117,393.
Gwynedd's average sold price of £196,260 positions this part of North Wales well below both the Wales and England averages. That figure sits 32.8% below England's £291,865. PropertyData returns no rental yield figures for either of Caernarfon's two postcodes, reflecting the dominance of holiday lets and seasonal accommodation over conventional long-term rentals in this part of Wales.
This guide covers both Caernarfon postcodes, LL54 and LL55, under the Gwynedd unitary authority (ONS code W06000002). Caernarfon sits on the Menai Strait in North West Wales, at the western gateway to Eryri (Snowdonia National Park). Investors comparing options in Wales may also consider Bangor, Wrexham, or Swansea. Browse all our Wales location guides.
Article updated: April 2026
Caernarfon Buy-to-Let Market Overview 2026
Caernarfon offers entry prices below the Wales average in a market shaped by tourism and holiday lets rather than conventional long-term rentals.
- Average sold price: £196,260 (Gwynedd, 8.7% below Wales's £214,883)
- Asking price range: £241,451 (LL54) to £269,135 (LL55)
- Rental yields: Not available (insufficient rental listings for both postcodes)
- Price per sq ft: Sold prices from £191/sq ft (LL54) to £213/sq ft (LL55)
- Market activity: Sales ranging from 8 per month (LL54) to 15 per month (LL55)
- Deposit requirements: 30% deposits from £72,435 (LL54) to £80,740 (LL55)
- Affordability ratios: Property prices from 6.9x to 7.7x Gwynedd's median annual salary of £34,798
Contents

-
by Robert Jones, Founder of Property Investments UK
With two decades in UK property, Rob has been investing in buy-to-let since 2005, and uses property data to develop tools for property market analysis.

Property Data Sources
Our location guide relies on diverse, authoritative datasets including:
- HM Land Registry UK House Price Index
- Ministry of Housing, Communities and Local Government
- Ordnance Survey Data Hub
- Propertydata.co.uk
We update our property data quarterly to ensure accuracy. Last update: April 2026. All data is presented as provided by our sources without adjustments or amendments.
Why Invest in Caernarfon?
Caernarfon Castle drew over 155,000 visitors in 2024-25 following a £5 million Cadw investment, and the town's median annual salary of £34,798 sits 12.7% below the Great Britain figure of £39,863. The castle is part of the UNESCO World Heritage Site "Castles and Town Walls of King Edward in Gwynedd". Tourism is not a side note here. It is the primary economic engine, built on Caernarfon's position at the meeting point of the Menai Strait and the western gateway to Eryri (Snowdonia National Park).
That tourism economy shapes the property market in ways that standard buy-to-let metrics do not fully capture. Conventional rental yield data requires a pool of long-term rental listings. In Caernarfon and the surrounding Gwynedd area, a significant share of lettable property operates as holiday lets or seasonal accommodation. PropertyData returns no rental figures for either LL54 or LL55. Investors considering this market are typically looking at holiday let income rather than standard assured shorthold tenancies.
Gwynedd Council has its headquarters in Caernarfon, making the town an administrative centre as well as a tourist destination. Public sector employment provides stability in a region where private sector wages sit below the national average. Bangor University, nine miles to the north, adds further employment and draws students to the wider area.
Between the 2011 and 2021 censuses, Gwynedd's population fell from 121,874 to 117,393, a decline of 3.7%. Gwynedd is one of the Welsh local authorities where population shrank over the decade, driven in part by younger residents moving to larger cities for employment. The 2021 Census also recorded that 64.4% of Gwynedd residents speak Welsh, making it one of the most Welsh-speaking areas in the country.
Earnings in Gwynedd sit below both the Welsh and national averages. The median annual salary is £34,798, compared to £37,404 across Wales and £39,863 for Great Britain. Lower wages combined with the tourism-driven property market create a situation where asking prices are pushed up by demand from buyers outside the area.
Caernarfon Economic Summary
- Population: 117,393 (2021 Census). Decline of 3.7% from 2011.
- Median annual salary: £34,798 (Gwynedd), £37,404 (Wales), £39,863 (Great Britain)
- Employment rate: 72.0% (Gwynedd)
- Unemployment rate: 6.3% (Gwynedd)
- Key employment sectors: Tourism, public administration, education, agriculture, outdoor recreation
Source: ONS Census 2021, Nomis Labour Market Profile (ASHE 2025, Employment Oct 2024-Sep 2025)
Gwynedd's employment rate of 72.0% sits below national averages, which partly reflects the seasonal nature of tourism work and higher economic inactivity in rural areas. The unemployment rate of 6.3% is also above the national level. For property investors, the local earnings data matters less in a market where buyer and tenant demand comes substantially from outside the local authority area.
Regeneration and Investment in Caernarfon
Over £20 million in public investment has flowed into Caernarfon's tourism infrastructure, waterfront, and housing in recent years. The town's UNESCO World Heritage status and its position as a gateway to Eryri attract public funding that most towns of this size would not secure.
- Caernarfon Castle £5m Investment (completed 2024): Cadw completed a three-year conservation project on the principal gatehouse, installing a rooftop deck, new flooring, a lift providing step-free access to upper levels, and new catering, educational, and retail spaces. The project included £1.04 million from the European Regional Development Fund. Over 155,000 visitors passed through in 2024-25. Updates at Cadw.
- Caernarfon Waterfront and Town Centre Regeneration (£15m, substantially complete): Gwynedd Council secured £15 million through Vibrant and Viable Places (£2.6m) and the Tourism Attractor Destination programme (£12m). Delivered projects include Galeri 2 (two-screen cinema, opened 2018, exceeded targets with 65,000 cinema tickets in year one), the Welsh Highland Railway terminus (opened 2019), and Cei Llechi (19 artisan business units and 3 holiday lets, opened 2020). Updates at Gwynedd Council.
- Adra Housing Development (21 flats, Llanberis Road): A four-storey residential building providing 21 social rental flats for individuals aged 55 and over, on the former Garej Lleiod site. Funded through the Welsh Government's Social Housing Grant. Read Construction Holdings Ltd is the contractor, with completion anticipated by winter 2025. Over 4,500 people are on Gwynedd's social housing waiting list. Updates at Adra.

Caernarfon Property Market Analysis
When Was the Last House Price Crash in Caernarfon?
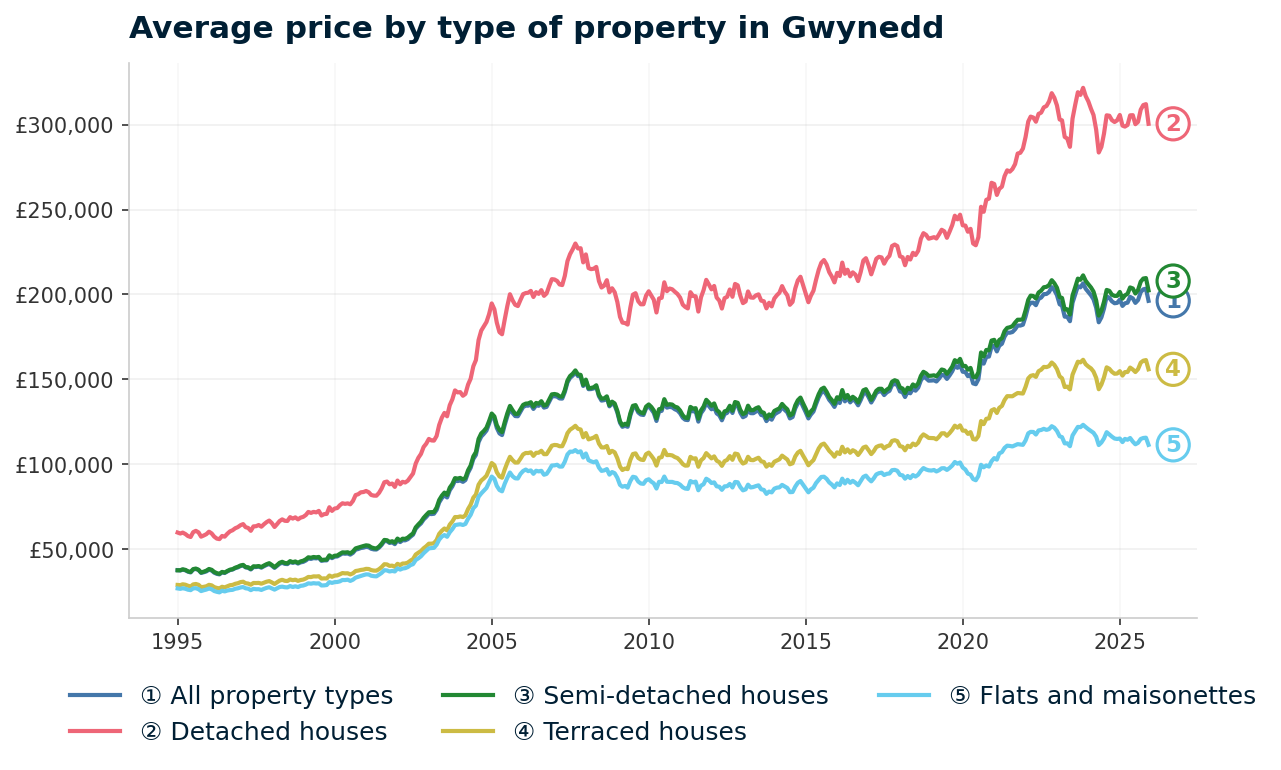
Gwynedd prices peaked at £154,168 in September 2007, crashed 20.8% to £122,155 by March 2009, and took 12 years to recover. Caernarfon falls within the Gwynedd local authority area, so all sold property prices from the HM Land Registry House Price Index are recorded at the Gwynedd level. The data runs from January 1995 to December 2025.
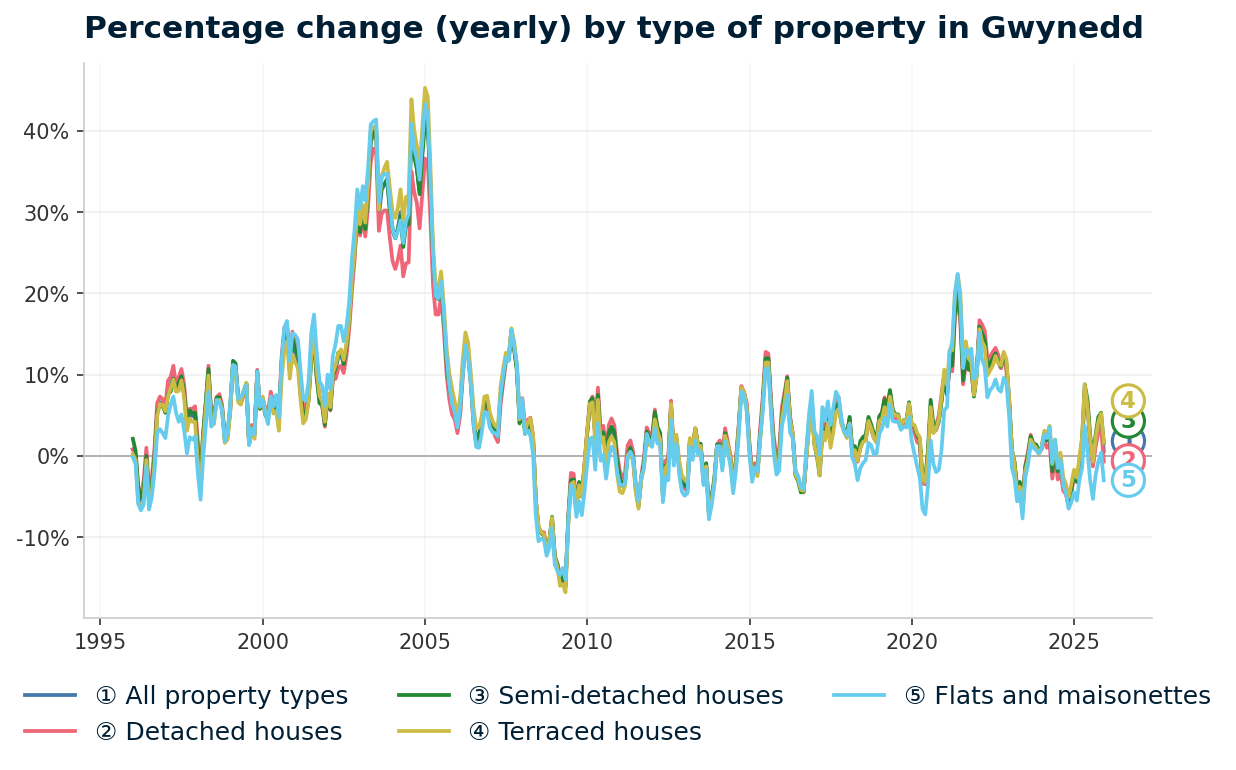
- 1995-2000 (Gradual growth): Gwynedd began January 1995 at £37,786. Prices rose slowly, reaching £51,063 by December 2000. Annual growth rates were modest: 0.8% in 1996, 5.6% in 1997, and 7.1% by 2000. While London and the South East accelerated through the late 1990s, Gwynedd barely moved.
- 2001-2005 (Explosive boom): Gwynedd's market caught fire. Annual growth hit 12.7% in January 2001, then 27.9% in 2003 and 27.7% in 2004. January 2005 recorded an extraordinary 42.0% annual growth. Prices more than doubled in four years from £51,550 to £128,584. The second-home and holiday-let market was a significant driver. Gwynedd's coastal and mountain locations attracted buyers from English cities at the height of cheap credit.
- 2006-2007 (Deceleration then peak): Growth slowed sharply to 4.0% in 2006 and 4.8% in 2007. Prices kept climbing but the momentum had gone. The peak came in September 2007 at £154,168.
- 2007-2009 (The financial crisis): From the peak of £154,168 in September 2007 to the trough of £122,155 in March 2009, Gwynedd lost 20.8% of its value in 18 months. The worst annual change reading was -16.2% in May 2009. Gwynedd fell harder than Wales as a whole, where the decline from August 2007 (£142,328) to March 2009 (£116,562) was 18.1%. The holiday-let and second-home market that drove the boom amplified the bust.
- 2009-2015 (Long stagnation): Prices bounced off the trough but then went nowhere. December 2010: £131,803. December 2015: £133,849. Six years produced barely £2,000 of growth. The holiday-let market contracted, second-home demand evaporated, and local wages could not fill the gap.
- 2016-2019 (Slow recovery): Growth returned at a walking pace. Prices finally passed the pre-crash peak in September 2019 at £154,835. That recovery took a full 12 years from the September 2007 peak. Gwynedd was one of the slowest areas in the UK to recover, well behind most English cities where prices passed pre-crash levels between 2013 and 2016.
- 2020-2022 (Pandemic surge): The combination of stamp duty relief, remote working, and the domestic tourism boom sent Gwynedd prices surging. December 2020: £169,319. By November 2022, prices hit £204,339. That is 20.7% growth in under two years. Holiday-let demand surged as UK travellers replaced overseas holidays with trips to Snowdonia.
- 2023-2024 (Rate correction): Interest rate rises cooled the market. Prices declined from the November 2022 peak of £204,339 to £183,647 by May 2024. A 10.1% correction over 18 months. The drop was deeper and longer than in many English cities, reflecting the sensitivity of a tourism and holiday-let market to higher borrowing costs.
- 2024-2025 (Stabilisation): Prices have partially recovered. December 2025: £196,260 with annual growth of +0.6%. The market appears to be finding a floor in the £190,000 to £200,000 range, still below the pandemic peak but 27.3% above the pre-2008 high.
From peak to present: a 20.8% crash in 2007-2009, six years of stagnation, a 12-year recovery to pre-crash levels, a 20.7% pandemic surge, then a 10.1% correction before stabilising at £196,260.
Long-Term Property Value Growth in Gwynedd
- 5 years (2020-2025): +15.9% (£169,319 to £196,260)
- 10 years (2015-2025): +46.6% (£133,849 to £196,260)
- 15 years (2010-2025): +48.9% (£131,803 to £196,260)
- 20 years (2005-2025): +49.8% (£131,023 to £196,260)
- 30 years (1995-2025): +429.4% (£37,069 to £196,260)
The near-identical 15 and 20 year figures tell the story of Gwynedd's lost decade. Prices in December 2005 (£131,023), December 2010 (£131,803), and December 2015 (£133,849) all sat within a £3,000 range. A buyer who purchased in 2005 at the top of the boom waited 15 years for meaningful appreciation. A buyer who purchased in 2015 after the stagnation captured all the pandemic-era growth. Timing mattered more in Gwynedd than in most markets. Distressed stock can emerge after corrections. Our repossessed houses for sale page tracks current listings.
Source: HM Land Registry House Price Index for Gwynedd
Source: HM Land Registry House Price Index for Gwynedd, January 1995 to December 2025.
Thinking of Buying?
We have off-market investment properties averaging 8%+ annual yield.
View Property DealsSold House Prices in Caernarfon
The latest sold house price index by the Land Registry confirms Gwynedd's position below the Wales average. The headline figure of £196,260 is 8.7% below Wales's £214,883 and 32.8% below England's £291,865. The discount is consistent across all property types, with flats showing the widest gap.
Flats in Gwynedd average £111,526, which is 14.5% below the Wales average of £130,402. Flat stock in Gwynedd is limited and concentrated in towns like Caernarfon, Bangor, and Porthmadog. The lower average reflects smaller unit sizes and an older housing stock compared to the purpose-built apartments that inflate flat averages in Cardiff and Swansea.
| Property Type | Gwynedd Average | Wales Average | Difference |
|---|---|---|---|
| Detached houses | £300,420 | £334,835 | -10.3% |
| Semi-detached houses | £202,394 | £214,549 | -5.7% |
| Terraced houses | £155,962 | £172,365 | -9.5% |
| Flats and maisonettes | £111,526 | £130,402 | -14.5% |
| All property types | £196,260 | £214,883 | -8.7% |
Semi-detached houses show the narrowest discount at 5.7%. At £202,394, Gwynedd's semis sit close to the Wales average. Solid demand for family housing in Gwynedd's towns keeps semi prices within reach of the national benchmark.
Detached houses sit 10.3% below Wales at £300,420. Gwynedd has plenty of detached stock, particularly in the rural areas surrounding Caernarfon. Many detached properties serve as second homes or holiday lets, and the gap to the Wales average reflects distance from major employment centres.
Terraced houses average £155,962, a 9.5% discount to Wales. The terraced stock in Caernarfon town centre and the surrounding villages represents the most affordable entry point into the Gwynedd market. At a 30% deposit, a terraced property at the Gwynedd average would require £46,789.
Flats at 14.5% below Wales show the widest gap. At £111,526, Gwynedd's flat prices reflect limited stock and the absence of premium new-build apartment developments that push flat averages higher in larger Welsh cities.
Property Data Sources
Our location guide relies on diverse, authoritative datasets including:
- HM Land Registry UK House Price Index
- Ministry of Housing, Communities and Local Government
- Ordnance Survey Data Hub
- Propertydata.co.uk
We update our property data quarterly to ensure accuracy. Last update: April 2026. All data is presented as provided by our sources without adjustments or amendments.
Price Per Square Foot in Caernarfon
Caernarfon's price per square foot ranges from £191 in LL54 to £213 in LL55, a spread of just £22. What does that narrow gap actually mean? Two postcodes serving the same local market rather than dramatically different neighbourhoods. Price per square foot strips out the size bias that skews average asking prices when one postcode has larger detached stock and the other has smaller terraces.
| Rank | Area | Price Per Sq Ft |
|---|---|---|
| 1 | LL54 (Caernarfon Rural, Llanrug) | £191 |
| 2 | LL55 (Caernarfon Town Centre, Llanberis) | £213 |
LL54 at £191 per square foot covers the rural areas south and west of Caernarfon, including Llanrug. Larger detached and semi-detached properties in these villages keep the per-foot cost lower. The housing stock here is predominantly family homes with gardens rather than tourist-facing properties.
LL55 at £213 per square foot takes in Caernarfon town centre and stretches east to Llanberis at the foot of Yr Wyddfa (Snowdon). The premium reflects a mix of period town houses, properties within the medieval town walls, and holiday-let stock near the castle and waterfront. Llanberis adds further demand from the outdoor tourism sector.
Figures reflect averages across all property types and ages. Individual values depend on condition, location within the postcode, and building age.
For Sale Asking Prices in Caernarfon
Caernarfon's asking prices range from £241,451 in LL54 to £269,135 in LL55, a gap of £27,684. Both sit above the Gwynedd Land Registry average of £196,260. That premium is typical where asking prices capture current market conditions while sold prices blend recent transactions with older sales across a longer period.
| Rank | Area | Average Asking Price |
|---|---|---|
| 1 | LL54 (Caernarfon Rural, Llanrug) | £241,451 |
| 2 | LL55 (Caernarfon Town Centre, Llanberis) | £269,135 |
LL55 at £269,135 carries a premium from Caernarfon town centre's tourist appeal and Llanberis's position as a base for Yr Wyddfa. Properties with holiday-let potential command higher asking prices than equivalent stock in the rural villages. A converted town house within walking distance of the castle can sit well above the postcode average.
LL54 at £241,451 offers a lower entry point for rural stock. The villages surrounding Caernarfon, including Llanrug and Bontnewydd, provide family housing at prices that reflect local residential demand rather than tourism premiums. The £27,684 gap between postcodes is modest enough that property type and location matter more than pure budget. Older properties in need of work may appear below these averages. Our renovation property finder can surface stock that does not show up on mainstream portals.
The mean asking price across both Caernarfon postcodes is £255,293. That figure appears in the comparison section, where Caernarfon is measured against Bangor, Wrexham, Swansea, and Cardiff.

House Price Growth in Caernarfon
An investor who bought in LL55 five years ago at roughly £207,000 would now be looking at an asking price of £269,135. That is over £61,000 in equity growth. LL55 has delivered 29.8% five-year growth, with LL54 close behind at 25.7%. The three-year picture is different. Both postcodes show marginal negative three-year growth, reflecting the rate correction from late 2022 through 2024.
| Area | 1 Year | 3 Years | 5 Years |
|---|---|---|---|
| LL55 (Caernarfon Town Centre, Llanberis) | 5.8% | -0.8% | 29.8% |
| LL54 (Caernarfon Rural, Llanrug) | 10.6% | -0.2% | 25.7% |
LL54 shows the stronger one-year recovery at 10.6%, nearly double LL55's 5.8%. Rural stock around Caernarfon has bounced back faster from the rate correction than town centre properties. The smaller number of transactions in LL54 (8 per month versus 15 in LL55) means individual sales can move the average more sharply, but the direction is clear.
The negative three-year figures for both postcodes are not a warning signal. They reflect the specific timing of the three-year window: asking prices in early 2023 were near the pandemic peak, and the rate correction that followed pulled values back. The five-year view, which includes the pre-pandemic base, shows the underlying growth trajectory.
Monthly Property Sales in Caernarfon
Caernarfon's combined monthly sales total 23 across both postcodes, with LL55 accounting for 15 and LL54 contributing 8. If you need to sell, how quickly can you? These are small numbers compared to urban markets, but they are typical for a Welsh town of this size. The more telling figure is turnover: 27% in LL54 versus just 9% in LL55.
| Area | Sales Per Month | Turnover | Asking Price |
|---|---|---|---|
| LL55 (Caernarfon Town Centre, Llanberis) | 15 | 9% | £269,135 |
| LL54 (Caernarfon Rural, Llanrug) | 8 | 27% | £241,451 |
LL55's low turnover of 9% is the standout figure in this table. Despite higher sales volumes, properties in the town centre and Llanberis change hands slowly relative to the total stock. That is consistent with a market where a large portion of properties are held as second homes or holiday lets and rarely come to market. Owners hold for the long term.
LL54's 27% turnover on just 8 sales per month indicates a smaller but more active residential market. Rural properties around Llanrug and the villages south of Caernarfon turn over faster, reflecting more conventional residential sales rather than the holiday-let holds that characterise LL55.
Property Data Sources
Our location guide relies on diverse, authoritative datasets including:
- HM Land Registry UK House Price Index
- Ministry of Housing, Communities and Local Government
- Ordnance Survey Data Hub
- Propertydata.co.uk
We update our property data quarterly to ensure accuracy. Last update: April 2026. All data is presented as provided by our sources without adjustments or amendments.

Caernarfon Rental Market Analysis
For investors weighing up whether rental property is a worthwhile investment in Caernarfon, the data below addresses a gap that defines this market. PropertyData returns no rental figures for either of Caernarfon's two postcodes.
That means conventional gross yield calculations are not possible from our standard data sources. Neither LL54 nor LL55 has sufficient current long-term rental listings for reliable figures. This reflects a market where a significant share of lettable property operates as holiday lets or seasonal accommodation rather than assured shorthold tenancies. Investors looking to build a property portfolio in North Wales may find that buy-to-let properties in Caernarfon require a different income model from conventional yield-driven markets.
Average Rent & Gross Rental Yields in Caernarfon
Neither of Caernarfon's two postcodes has sufficient current rental listings for PropertyData to calculate average rents or gross yields. The table below records this data gap. For context, nearby Bangor (9 miles north) shows average rents of £899 and a top yield of 4.3%. Wrexham records average rents of £780 and a top yield of 3.9%. Gross rental yield is calculated from the average asking price and average monthly rent. It does not account for void periods, maintenance, management fees, or mortgage costs.
| Area | Average Monthly Rent | Average Asking Price | Gross Yield |
|---|---|---|---|
| LL54 (Caernarfon Rural, Llanrug) | Not enough data | £241,451 | Not enough data |
| LL55 (Caernarfon Town Centre, Llanberis) | Not enough data | £269,135 | Not enough data |
The absence of rental data is the defining characteristic of Caernarfon's property market for investors. Across Wales, Gwynedd has one of the highest concentrations of second homes and holiday lets relative to its total housing stock. Properties that would appear as long-term rentals in a city like Cardiff or Swansea are instead operating as short-term holiday accommodation. The income these properties generate does not appear in conventional rental yield databases.
Welsh Government regulations on holiday lets add a further dimension. Since April 2023, holiday lets in Wales must be occupied for at least 182 days per year to qualify for business rates rather than council tax. Properties that do not meet this threshold face higher council tax charges. Gwynedd applies one of the highest second-home council tax premiums in Wales. These rules are reshaping which properties remain as holiday lets and which return to the residential rental or sales market.
Is Caernarfon Rent High?
The median gross weekly salary in Gwynedd is £669.20, equating to £2,900 per month or £34,798 per year. That is below the Wales regional median of £719.30 per week and the Great Britain median of £766.60 per week. Data from the Nomis Labour Market Profile (ASHE 2025).
With no rental data available for either Caernarfon postcode, the rent-to-income ratio cannot be calculated. For reference, nearby Bangor (where rental data is available) shows average rents of £899 per month. Against the Gwynedd median monthly salary of £2,900, that would represent approximately 31% of gross income, at or above the 30% affordability benchmark.
The earnings data also matters for the holiday-let market. Holiday-let income is not constrained by local wages because visitors come from across the UK. A property generating strong nightly rates during peak season earns at levels that bear no relationship to Gwynedd's median salary. The disconnect between local earnings and property prices in Caernarfon is largely explained by this external demand.
Thinking of Buying?
We have off-market investment properties averaging 8%+ annual yield.
View Property DealsBuy-to-Let Considerations
Are Caernarfon House Prices High? Price-to-Earnings Ratios
Purchasing a property in Caernarfon requires between 6.9 and 7.7 times the median annual salary of £34,798. This is based on the Nomis Labour Market Profile for Gwynedd. The national benchmark is approximately 7.3x, calculated from England's average sold price against Great Britain's median annual salary.
Both postcodes straddle that benchmark. LL54 at 6.9x falls just below, while LL55 at 7.7x sits slightly above. For a market where external demand from holiday-let buyers and second-home purchasers substantially influences prices, these ratios are moderate.
| Rank | Area | Price-to-Earnings Ratio |
|---|---|---|
| 1 | LL54 (Caernarfon Rural, Llanrug) | 6.9x |
| 2 | LL55 (Caernarfon Town Centre, Llanberis) | 7.7x |
LL54 at 6.9x represents the more affordable entry point on an earnings basis. Rural villages around Caernarfon are priced closer to what local wages can support. LL55 at 7.7x reflects the tourism premium built into town centre and Llanberis prices.
These ratios are calculated against local Gwynedd earnings. Many buyers in this market are not Gwynedd residents and earn above these levels. The price-to-earnings ratio accurately reflects the challenge for local first-time buyers but understates affordability for external investors.
Deposit Requirements in Caernarfon
Caernarfon's 30% deposit requirements range from £72,435 in LL54 to £80,740 in LL55. The gap between the two postcodes is just £8,305. Both sit below the £100,000 mark. The standard buy-to-let deposit is 30%. The table below reflects this benchmark, which unlocks better interest rates and a wider range of mortgage products.
| Rank | Area | 30% Deposit Required |
|---|---|---|
| 1 | LL54 (Caernarfon Rural, Llanrug) | £72,435 |
| 2 | LL55 (Caernarfon Town Centre, Llanberis) | £80,740 |
At £72,435, LL54 requires the lower deposit. That is based on the average asking price of £241,451. Individual properties, particularly terraced houses and smaller semis, will require less. Gwynedd's Land Registry average for terraced houses is £155,962, which at 30% would need a deposit of £46,789. For investors exploring entry with less capital upfront, our guide to buy-to-let with no deposit covers the available routes.
Wales uses Land Transaction Tax (LTT) rather than Stamp Duty Land Tax. The rates and thresholds differ from England. Use our stamp duty calculator for an estimate, noting that Welsh transactions follow LTT rules. For a full breakdown of purchase costs, see our guide to buy-to-let costs. Investors looking for properties priced below current market values may find opportunities through below market value property listings.

What the Caernarfon Data Tells Buy-to-Let Investors
Caernarfon's two postcodes have delivered 25.7% to 29.8% five-year growth from asking prices of £241,451 to £269,135, with no conventional rental yield data from either postcode. The absence of yield data is not a gap in the analysis. It is the analysis. This market operates differently from conventional buy-to-let locations.
For capital growth, both postcodes have delivered strong five-year returns. LL55 at 29.8% and LL54 at 25.7% outperform many Welsh and English locations over the same period. The Land Registry data for Gwynedd shows average sold prices of £196,260, sitting 8.7% below the Wales average and 32.8% below England. That discount combined with demonstrated growth creates a capital appreciation case.
The holiday-let question runs through the Caernarfon data. PropertyData cannot calculate conventional rental yields because insufficient long-term rental listings exist. The letting market here is dominated by holiday lets and seasonal accommodation serving visitors to Caernarfon Castle, Eryri, and the wider Gwynedd coastline. Conventional buy-to-let with 12-month AST tenancies has limited local demand. Investment properties operating as holiday lets involve a different set of calculations: higher gross income during peak months, void periods in winter, higher management costs, and Welsh Government occupancy rules.
LL54 offers the lower entry point at £72,435 deposit with 25.7% five-year growth and a price-to-earnings ratio of 6.9x. LL55 costs more at £80,740 deposit but has delivered the stronger growth (29.8%) and benefits from proximity to both Caernarfon's tourist centre and Llanberis. The £8,305 deposit difference between postcodes is small enough that the decision depends on property type and intended use rather than pure affordability. For access to off-market property opportunities in North Wales, specialist sourcing can uncover stock that does not appear on the open market.
How Caernarfon Buy-to-Let Compares to Nearby Areas
Caernarfon's mean asking price of £255,293 places it between Swansea (£250,854) and Wrexham (£259,235), with Cardiff the most expensive at £308,726. The table below compares Caernarfon against four Welsh towns and cities using the same methodology: mean asking price across all postcodes, mean monthly rent where available, and top single-postcode gross yield.
| Location | Mean Asking Price | Mean Monthly Rent | Top Gross Yield |
|---|---|---|---|
| Caernarfon | £255,293 | N/A | N/A |
| Bangor | £276,089 | £899 | 4.3% |
| Swansea | £250,854 | £1,233 | 8.8% |
| Wrexham | £259,235 | £780 | 3.9% |
| Cardiff | £308,726 | £1,223 | 7.3% |
Caernarfon's mean asking price of £255,293 places it in the middle of this Welsh group. Swansea at £250,854 is marginally cheaper, while Cardiff at £308,726 is the most expensive entry point. The immediate comparison for Caernarfon investors is Bangor, which sits 9 miles north, costs £20,796 more, but has the advantage of visible rental yield data at 4.3%.
The N/A entries for Caernarfon in the rent and yield columns illustrate the fundamental difference between this market and conventional buy-to-let locations. Every other location in the table has measurable long-term rental income. Caernarfon does not. Investors choosing between Caernarfon and Bangor are choosing between two different investment models: holiday-let income with higher management complexity, or conventional buy-to-let with quantifiable yields. For a broader view of the highest-performing UK locations, see our guide to the best buy-to-let locations.
Frequently Asked Questions
What county is Caernarfon in?
Caernarfon is in Gwynedd, a unitary authority area in North West Wales (ONS code W06000002). Historically, it was the county town of Caernarfonshire before local government reorganisation created the current Gwynedd authority in 1996.
The town sits on the Menai Strait, facing Anglesey across the water, and serves as the administrative centre for Gwynedd Council. For property data purposes, Land Registry records prices at the Gwynedd level rather than for Caernarfon specifically.
Is Caernarfon a good area for holiday lets?
Caernarfon has a UNESCO World Heritage castle that drew over 155,000 visitors in 2024-25, a £15 million waterfront regeneration, and sits at the gateway to Eryri (Snowdonia National Park). PropertyData returns no conventional rental yield data for either postcode, which indicates that holiday and seasonal lets dominate the local letting market rather than standard buy-to-let tenancies.
Since April 2023, Welsh Government rules require holiday lets to be occupied for at least 182 days per year to qualify for business rates. Properties that do not meet this threshold face higher council tax charges. Gwynedd applies one of the highest second-home council tax premiums in Wales. Holiday let income in this area follows seasonal demand, with peak occupancy in summer and school holidays and lower demand in winter months.
How does Caernarfon compare to Bangor for property investment?
Bangor sits 9 miles north with a mean asking price of £276,089 versus Caernarfon's £255,293. Bangor has measurable rental data: average rents of £899 per month and a top gross yield of 4.3%. Caernarfon has no rental yield data from PropertyData.
Bangor benefits from Bangor University (approximately 10,000 students), which creates conventional student and young professional rental demand. Caernarfon's demand comes primarily from tourism and holiday lets. Both sit within Gwynedd, share the same Land Registry sold price data (Gwynedd average £196,260), and use the same median earnings figure of £34,798. The data shows two different investment models: conventional yields with student demand (Bangor) or a tourism-driven market with capital growth of up to 29.8% over five years (Caernarfon).
What is the population of Caernarfon?
The town of Caernarfon has a population of approximately 9,600 (community level, ONS code W04000056). The wider Gwynedd local authority area recorded 117,393 residents in the 2021 Census, a decline of 3.7% from 121,874 in 2011.
Gwynedd is one of several Welsh local authorities where population fell over the decade. The median age rose from 42 to 45 between the two censuses. For broader context on Welsh property markets, see our guide to the cheapest places to live in Wales.
Why is there no rental yield data for Caernarfon?
Both LL54 and LL55 have insufficient conventional rental listings for PropertyData to calculate reliable averages. This is not a data error or a temporary gap.
Gwynedd has one of the highest concentrations of second homes and holiday lets in Wales. A significant share of lettable property in Caernarfon operates as holiday accommodation rather than 12-month assured shorthold tenancies. The income from holiday lets does not appear in standard rental yield databases. Nearby Welsh locations with more conventional rental markets, such as Bangor (4.3% top yield) and Wrexham (3.9%), do return yield data.