Where to Buy Property Investments in Tottenham: Yields of 5.7%
Tottenham's gross rental yields range from 3.5% to 5.7% across five postcodes with rental data, with N17 delivering the highest returns. Average sold prices across the London Borough of Haringey sit 119.3% above the England average, and the borough's population grew 3.65% to 264,238 between the 2011 and 2021 censuses.
Tottenham's five postcodes span a £265,634 asking price range, from £437,618 in N17 to £703,252 in N10. That spread reflects a two-tier market. N17 (Tottenham proper) and N15 (South Tottenham, Seven Sisters) offer entry points below £500,000 with yields above 4.8%. N8 (Crouch End, Hornsey) and N10 (Muswell Hill) trade as premium London suburbs where asking prices exceed £570,000 and yields compress below 4.3%. All five postcodes have both price and rental data.
This guide covers five postcodes within the London Borough of Haringey (ONS code E09000014): N8, N10, N15, N17, and N22. Each postcode crosses or straddles borough boundaries to some extent, but all fall primarily within Haringey and are included in the postcodes_master dataset for this analysis. N8 (Crouch End, Hornsey) and N10 (Muswell Hill) are Haringey postcodes but are not typically described as "Tottenham" by residents. Land Registry, Census, and earnings data are reported at the Haringey local authority level. Postcode-level property data is specific to each area. Investors comparing options across north London may also consider Haringey, Enfield, Hackney, or Barnet. Browse all our London location guides.
Article updated: April 2026
Tottenham Buy-to-Let Market Overview 2026
Tottenham offers a wide entry range within a London borough where stadium-led regeneration and transport connectivity underpin rental demand across five postcodes.
- Average sold price: £637,041 (Haringey, 119.3% above England's £290,437)
- Asking price range: £437,618 (N17) to £703,252 (N10)
- Rental yields: 3.5% (N10) to 5.7% (N17) across postcodes with rental data
- Rental income: Monthly rents from £1,820 (N22) to £2,088 (N17)
- Price per sq ft: Sold prices from £560/sq ft (N17) to £773/sq ft (N8)
- Market activity: Sales ranging from 16 per month (N22) to 30 per month (N8)
- Deposit requirements: 30% deposits range from £131,285 (N17) to £210,976 (N10)
- Affordability ratios: Property prices from 9.9 to 16.0 times Haringey's median annual salary of £43,995
Contents

-
by Robert Jones, Founder of Property Investments UK
With two decades in UK property, Rob has been investing in buy-to-let since 2005, and uses property data to develop tools for property market analysis.

Property Data Sources
Our location guide relies on diverse, authoritative datasets including:
- HM Land Registry UK House Price Index
- Ministry of Housing, Communities and Local Government
- Ordnance Survey Data Hub
- Propertydata.co.uk
We update our property data quarterly to ensure accuracy. Last update: April 2026. All data is presented as provided by our sources without adjustments or amendments.
Why Invest in Tottenham?
Gross yields reach 5.7% in N17, where asking prices of £437,618 sit 31.3% below the Haringey Land Registry average of £637,041. Tottenham sits in the London Borough of Haringey, a north London authority that spans from the premium streets of Muswell Hill and Crouch End to the transport hubs and regeneration zones around Seven Sisters and Tottenham Hale. The Victoria line serves Seven Sisters and Tottenham Hale. The N22 (Wood Green) postcode area adds two further tube stations at Wood Green and Turnpike Lane. Tottenham Hale is a major interchange with Victoria line, National Rail, and Stansted Express services, putting King's Cross within 15 minutes and Stansted Airport within 45.
The London Overground's Weaver line runs through Tottenham with stations at White Hart Lane, Bruce Grove, Northumberland Park, and Seven Sisters, connecting to Liverpool Street and destinations in Enfield and Cheshunt. South Tottenham station on the Suffragette line adds a further Overground connection. That density of rail and tube stations creates consistent tenant demand from commuters who work across inner London and the City.
Between the 2011 and 2021 censuses, Haringey's population grew from 254,926 to 264,238, a rise of 3.65%. Haringey covers approximately 29.6 square kilometres and is the 23rd largest London borough by area. The borough's population is concentrated in the flatter, more connected eastern half where Tottenham sits.
Haringey's median annual salary is £43,995, based on median gross weekly pay of £846.10. That is below the London regional median of £892.60 per week but above the Great Britain median of £752.40. The employment rate stands at 69.9% and unemployment at 6.9%. North Middlesex University Hospital, operated by Royal Free London NHS Foundation Trust since January 2025, serves populations across Haringey and Enfield (approximately 640,000 people) and is one of the area's major employers. The College of Haringey, Enfield and North East London (CONEL) and Haringey Sixth Form College both have centres in the Tottenham area, supporting a younger demographic and further rental demand.
Haringey Economic Summary
- Population: 264,238 (2021 Census). Growth of 3.65% from 2011.
- Median annual salary: £43,995 (Haringey), £892.60/week (London), £752.40/week (Great Britain)
- Employment rate: 69.9% (Haringey)
- Unemployment rate: 6.9% (Haringey)
- Key employment sectors: Healthcare, education, retail, public administration, professional services
Source: ONS Census 2021, Nomis Labour Market Profile (ASHE 2025)
Haringey's employment rate of 69.9% is below the London average, but the unemployment rate of 6.9% is consistent with inner London boroughs where economic inactivity (students, carers, early retirees) pulls down the headline employment figure. For landlords, the relevant signal is that nearly 265,000 people live in the borough, connected by two tube lines and multiple Overground services to some of the largest employment centres in London. Tenants in Tottenham are not dependent on a single employer or sector. Browse our guide to London's population trends for wider context.
Regeneration and Investment in Tottenham
Over £2 billion in combined public and private investment is flowing into three major regeneration programmes across Tottenham. The scale of development is concentrated in N17, directly adjacent to the Tottenham Hotspur Stadium.
- Tottenham Hotspur Stadium and Northumberland Development Project (stadium complete 2019, wider development ongoing, near £1bn private investment): The 62,303-capacity stadium opened in April 2019 and hosts Premier League football, NFL games, concerts, and major events. The wider Northumberland Development Project includes a hotel, retail space, extreme sports centre, and public square, with 3,500 new jobs projected and an estimated £293 million annual economic impact. Updates at Haringey Council.
- High Road West (planning approved August 2022, Lendlease development partner): Over 2,600 new homes planned with 40% affordable housing, including at least 500 council homes at council rent. The scheme will create 3,500+ jobs and transform the area immediately west of the stadium. Updates at Haringey Council.
- Broadwater Farm Estate Regeneration (under construction, £150m investment): 294 new homes planned across the estate, with the first phase of 40 homes starting construction in February 2025 and expected to complete by May 2026. Residents voted 85% in favour of the regeneration plans. Updates at Haringey Council.
Haringey Council has set a target of 3,000 new council homes by 2031, with over 2,000 already underway or completed. The concentration of investment in N17 and surrounding areas is reshaping both the housing stock and the employment base. Investors looking for properties in regeneration corridors can browse our renovation property listings.

Tottenham Property Market Analysis
When Was the Last House Price Crash in Tottenham?
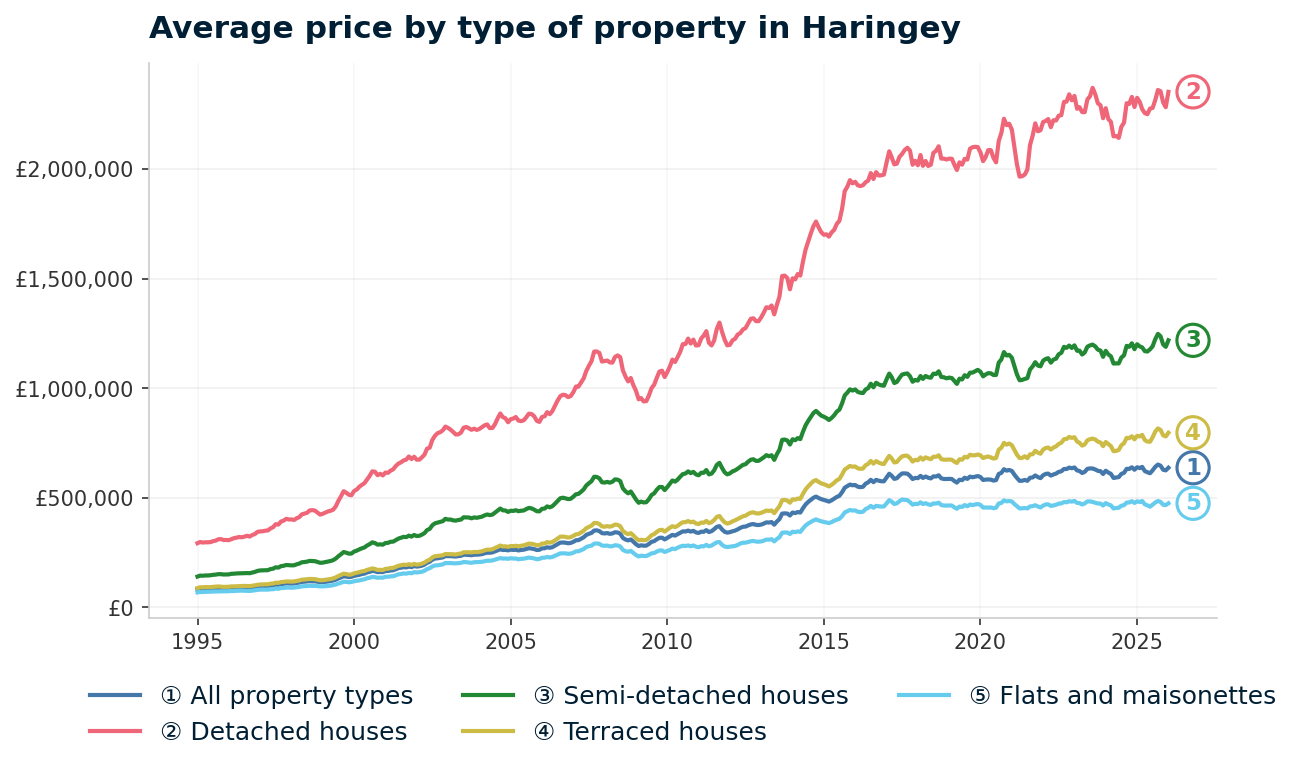
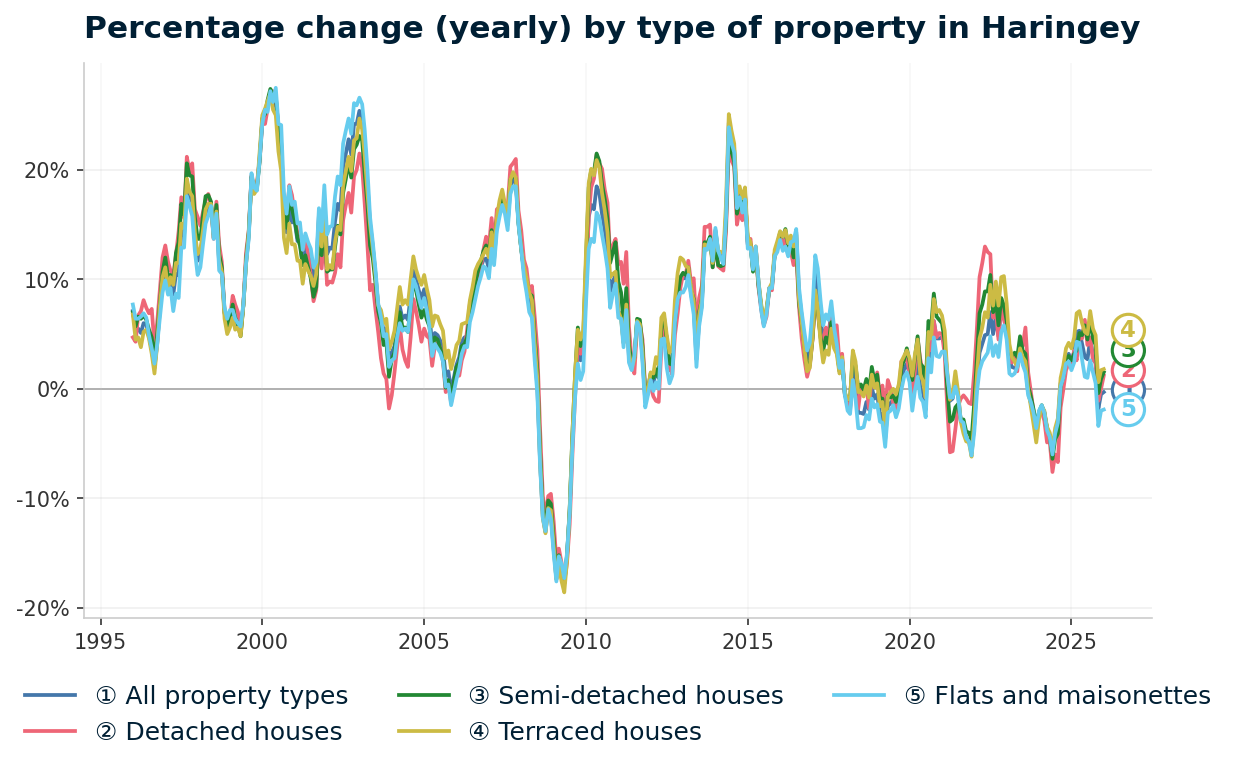
Tottenham is within the London Borough of Haringey, so all sold property prices from the HM Land Registry House Price Index are reported at the Haringey local authority level. The data runs from January 1995 to January 2026 and shows one major crash, a fast recovery, and a prolonged period of high-value stability.
- 1995-2000 (Early growth): Haringey started 1995 at £81,997. By January 2000, prices had roughly doubled as inner London began its sustained upswing. Proximity to inner London and relatively affordable Victorian housing stock drew buyers from more expensive neighbouring boroughs.
- 2000-2007 (The boom): Prices accelerated sharply through the early 2000s. Cheap credit, strong London employment, and growing demand for inner-city living pushed Haringey's average to a pre-crash peak of £351,634 in October 2007. That represents a more than fourfold increase from the 1995 starting price.
- 2007-2009 (The financial crisis): From the peak of £351,634 in October 2007 to the trough of £280,048 in February 2009, Haringey lost 20.4% of its value in 16 months. The decline was broadly in line with inner London and slightly steeper than England's overall drop of 17.3% over the same period (England fell from £183,823 to £151,964). Haringey's flat prices dropped from £292,059 to £232,598, a decline of 20.4%.
- 2009-2011 (Fast recovery): Unlike many UK cities that stagnated for years after the crash, Haringey bounced back quickly. Prices passed the pre-crash peak by April 2011 at £352,594, just 2 years and 2 months after hitting the trough. Inner London's recovery led the national market, and Haringey benefited from its Victoria line connectivity and the additional tube stations in the Wood Green (N22) area.
Post-Recovery: 2011 to Present
- 2011-2016 (Sustained surge): This was Haringey's strongest growth phase. Prices rose from £339,672 in January 2011 to £558,253 by January 2016. That is 64.4% growth in five years, driven by the wider London property boom, international investment flows, and Help to Buy demand. The borough's relative affordability compared to Islington and Hackney attracted buyers moving north along the Victoria line.
- 2017-2019 (Plateau): Growth slowed as London's market cooled. Stamp duty surcharges on additional dwellings (introduced April 2016) and Brexit uncertainty dampened transaction volumes. Haringey's price growth flattened to low single digits, trading sideways around £600,000.
- 2020-2022 (Pandemic era): The stamp duty holiday provided a brief lift, but Haringey did not see the dramatic surges experienced by outer London and commuter belt locations. Prices edged higher through the period. The five-year growth from January 2021 (£622,431) to January 2026 (£637,041) is just 2.3%, confirming that the pandemic did not trigger a second boom in this part of London.
- 2023-2024 (Rate shock and stabilisation): Interest rate rises cooled transaction volumes across London. Haringey's average dipped from its peak but held above £600,000 throughout. The all-time high of £651,593 was reached in September 2025.
- 2025-2026 (Current): The latest data shows Haringey at £637,041 in January 2026, sitting 2.2% below the September 2025 peak. Flats average £474,733. The borough trades at a 119.3% premium to the England average of £290,437 and 14.9% above the London average of £554,422.
Long-Term Property Value Growth in Haringey
- 5 years (2021-2026): +2.3% (£622,431 to £637,041)
- 10 years (2016-2026): +14.1% (£558,253 to £637,041)
- 15 years (2011-2026): +87.5% (£339,672 to £637,041)
- 20 years (2006-2026): +136.5% (£269,341 to £637,041)
- 30 years (1996-2026): +625.6% (£87,790 to £637,041)
The 2008 crash took 20.4% off Haringey prices in 16 months. The recovery took just over two years. That speed of recovery reflected London's structural demand advantages.
The risk profile today is different. Haringey prices are nearly double where they were at the pre-crash peak, five-year growth has flattened to 2.3%, and interest rates remain above their pre-2022 levels. The market is no longer being driven by rapid appreciation. For investors, the current numbers point to a borough where capital growth has slowed while rental yields hold, particularly in the more affordable N17 postcode. The 18-year property cycle provides a framework for understanding where London sits in the broader pattern.
Source: HM Land Registry House Price Index for Haringey, January 1995 to January 2026.
Thinking of Buying?
We have off-market investment properties averaging 8%+ annual yield.
View Property DealsSold House Prices in Tottenham
The latest Land Registry data for Haringey reveals a London borough where every property type trades at a significant premium to the England average. The headline figure of £637,041 sits 119.3% above England's £290,437. That premium is characteristic of inner London, but the size of the gap varies enormously by property type.
Flats in Haringey average £474,733, which is 117.3% above the England average of £218,449. Flats are the dominant stock type across Tottenham's postcodes, particularly in N15 and N17 where Victorian conversions and purpose-built blocks make up the bulk of the rental market. The flat premium is the narrowest of any property type because flat prices face the most competition from supply.
| Property Type | Haringey Average | England Average | Difference |
|---|---|---|---|
| Detached houses | £2,351,015 | £468,546 | +401.8% |
| Semi-detached houses | £1,218,067 | £288,046 | +322.9% |
| Terraced houses | £796,518 | £243,580 | +227.0% |
| Flats and maisonettes | £474,733 | £218,449 | +117.3% |
| All property types | £637,041 | £290,437 | +119.3% |
Detached houses at £2,351,015 sit 401.8% above the England average. This is an extreme premium driven by scarcity. Detached properties in Haringey are rare and concentrated in the Muswell Hill (N10) and Crouch End (N8) areas. The figure reflects a small number of high-value transactions rather than a typical buy-to-let entry point.
Semi-detached houses average £1,218,067, a 322.9% premium. Like detached stock, semis are concentrated in the western postcodes (N8, N10) where tree-lined streets and proximity to Highgate and Hampstead Heath push prices into seven figures. These are owner-occupier markets, not typical yield territory.
Terraced houses average £796,518, sitting 227.0% above England. The Victorian terraces that run through N15, N17, and N22 form the core of Tottenham's rental stock. While the Haringey-wide average is elevated by premium terraces in Crouch End and Muswell Hill, the postcode-level asking price data in the sections below shows where terraced properties are accessible for buy-to-let investors.
Flats at £474,733 represent the most realistic entry point for buy-to-let investors. The 117.3% premium to England is substantial, but flats in N17 trade well below this Haringey average. Postcode-level data separates the premium western stock from the more affordable eastern postcodes where yields are highest.
Property Data Sources
Our location guide relies on diverse, authoritative datasets including:
- HM Land Registry UK House Price Index
- Ministry of Housing, Communities and Local Government
- Ordnance Survey Data Hub
- Propertydata.co.uk
We update our property data quarterly to ensure accuracy. Last update: April 2026. All data is presented as provided by our sources without adjustments or amendments.
Price Per Square Foot in Tottenham
Tottenham's sold price per square foot ranges from £560 in N17 to £773 in N8, a 38% spread across five postcodes. That gap is narrower than the asking price spread (£265,634), which means some of the price difference between postcodes comes from property size rather than underlying value per unit of space.
| Rank | Area | Price Per Sq Ft |
|---|---|---|
| 1 | N17 (Tottenham) | £560 |
| 2 | N15 (South Tottenham, Seven Sisters) | £645 |
| 3 | N22 (Wood Green) | £648 |
| 4 | N10 (Muswell Hill) | £759 |
| 5 | N8 (Crouch End, Hornsey) | £773 |
N17 at £560 per square foot is the cheapest space in Tottenham's postcodes. This is the area closest to the stadium and the regeneration corridor. Older terraced housing and ex-local authority stock keep per-foot costs low. For investors, the combination of the lowest price per square foot and the highest yield (5.7%) means N17 delivers more rental income per pound spent on space than any other postcode in the set.
N15 and N22 sit close together at £645 and £648. South Tottenham and Wood Green offer a middle ground. Both are well connected by tube (Seven Sisters and Wood Green stations respectively) and have established rental markets.
N8 (Crouch End) tops the table at £773 per square foot. Despite not having its own tube station, Crouch End commands the highest price per square foot thanks to its village character, independent shops, and proximity to Highgate. N10 (Muswell Hill) at £759 follows a similar pattern. Both are primarily owner-occupier markets where buy-to-let investors would be paying premium rates for space.
Figures reflect averages across all property types and ages. Individual values depend on condition, location within the postcode, and building age.
For Sale Asking Prices in Tottenham
Tottenham's asking prices range from £437,618 in N17 to £703,252 in N10, with a mean of £543,599 across all five postcodes. Three postcodes sit below the Haringey Land Registry average of £637,041, which means the postcode-level data gives investors more affordable entry points than the borough headline suggests. For those exploring below market value properties, the gap between Haringey's borough average and N17's asking price is over £199,000.
| Rank | Area | Average Asking Price |
|---|---|---|
| 1 | N17 (Tottenham) | £437,618 |
| 2 | N15 (South Tottenham, Seven Sisters) | £481,607 |
| 3 | N22 (Wood Green) | £522,116 |
| 4 | N8 (Crouch End, Hornsey) | £573,400 |
| 5 | N10 (Muswell Hill) | £703,252 |
N17 and N15 form the accessible tier, both below £500,000. N17 at £437,618 is the only postcode in this set where an investor can enter below the London average of £554,422. N15 at £481,607 adds £44,000 to the entry cost but sits on the Victoria line at Seven Sisters, which is one of the best-connected stations in north London.
N10 at £703,252 is the most expensive postcode by a wide margin. Muswell Hill trades at 60.7% above N17. That premium buys tree-lined streets, larger properties, and access to Alexandra Palace, but it compresses gross yields to 3.5%. The gap between N8 and N10 (£129,852) is larger than the gap between N17, N15, and N22 combined. See where Tottenham's postcodes rank across London in our cheapest areas of London guide, or explore repossessed properties for below-asking opportunities.
The mean asking price across all five postcodes is £543,599. That figure appears in the comparison section, where Tottenham is measured against Enfield, Hackney, Barnet, and Islington.

House Price Growth in Tottenham
Growth data shows where prices have moved over 1, 3, and 5 years. For buy-to-let investors, the five-year figure matters most. It captures a full market cycle and filters out short-term noise. One-year growth can swing on a handful of transactions. Five years tells you whether an area is genuinely appreciating.
Three of Tottenham's five postcodes show positive five-year growth, with N8 (Crouch End) leading at 15.5%. An investor who bought a £496,000 property in N8 five years ago would be sitting on a property now asking £573,400. That is roughly £77,000 in equity growth. N10 sits at the other extreme with -10.4% five-year decline, making it the only postcode in the set with negative growth across all three time windows.
| Area | 1 Year | 3 Years | 5 Years |
|---|---|---|---|
| N8 (Crouch End, Hornsey) | 9.0% | 13.1% | 15.5% |
| N22 (Wood Green) | 14.4% | 5.4% | 11.9% |
| N17 (Tottenham) | -1.0% | -7.1% | 4.2% |
| N15 (South Tottenham, Seven Sisters) | 5.1% | -1.2% | 0.0% |
| N10 (Muswell Hill) | -9.0% | -8.5% | -10.4% |
N22 (Wood Green) leads one-year growth at 14.4%. That is a sharp short-term surge, and the five-year figure of 11.9% confirms the trend is not just a spike. Wood Green is part of Haringey's wider regeneration programme. Wood Green station provides direct tube connections to King's Cross. The three-year figure of 5.4% is more modest, suggesting the strongest growth has come in the most recent 12 months.
N8 shows consistent growth across all three windows: 9.0%, 13.1%, and 15.5%. Crouch End has delivered steady appreciation without the volatility seen in other postcodes. The area's character as a desirable north London village with strong owner-occupier demand creates a floor under prices.
N17 presents a mixed picture. The five-year figure of 4.2% is positive, but the three-year reading of -7.1% and one-year reading of -1.0% show prices have been falling from a recent peak. The stadium and High Road West regeneration have not yet translated into sustained price growth.
For yield-focused investors, flat or declining prices combined with strong rents (N17 has the highest yield at 5.7%) mean the entry point may be lower now than it was three years ago. Read this alongside the house price forecast for the wider London context.
N10's -10.4% five-year decline is the sharpest in the set. Muswell Hill is losing value at a rate that no other Tottenham postcode matches. The combination of highest asking price (£703,252), lowest yield (3.5%), and negative growth across all time windows makes N10 an outlier in this dataset.
Monthly Property Sales in Tottenham
Tottenham records 115 property sales per month across five postcodes, ranging from 16 in N22 to 30 in N8. Turnover rates are low across the board, with no postcode exceeding 13%. That pattern is typical of London boroughs where housing stock turns over slowly and long-term holds are the norm.
| Area | Sales Per Month | Turnover | Asking Price |
|---|---|---|---|
| N8 (Crouch End, Hornsey) | 30 | 13% | £573,400 |
| N17 (Tottenham) | 29 | 9% | £437,618 |
| N15 (South Tottenham, Seven Sisters) | 23 | 13% | £481,607 |
| N10 (Muswell Hill) | 17 | 8% | £703,252 |
| N22 (Wood Green) | 16 | 7% | £522,116 |
N8 leads with 30 sales per month and 13% turnover. Crouch End combines the highest transaction count with one of the highest turnover rates, suggesting an active market with willing buyers. For investors planning an exit, N8 and N15 (also 13% turnover) offer the most liquid resale conditions.
N17 records 29 sales per month but just 9% turnover. The lower turnover despite healthy volume indicates a large stock base where most properties stay in the same hands for extended periods. Landlords and owner-occupiers alike tend to hold in this area. That aligns with N17's yield-led profile. Investors buy here for income, not for quick resale.
N22 at 16 sales per month and 7% turnover is the least active postcode. Wood Green's low transaction count sits alongside its 14.4% one-year price growth. Fewer properties change hands but those that do are achieving significantly higher prices than a year ago.
Property Data Sources
Our location guide relies on diverse, authoritative datasets including:
- HM Land Registry UK House Price Index
- Ministry of Housing, Communities and Local Government
- Ordnance Survey Data Hub
- Propertydata.co.uk
We update our property data quarterly to ensure accuracy. Last update: April 2026. All data is presented as provided by our sources without adjustments or amendments.
Tottenham Rental Market Analysis
For investors weighing up whether rental property is a worthwhile investment in Tottenham, the data below breaks down average monthly rents and gross rental yields across the area's postcodes.
Rental data is available for all 5 postcodes. Monthly rents range from £1,820 in N22 to £2,088 in N17, and gross yields range from 3.5% to 5.7%. If you are looking to build a property portfolio in London, Tottenham's combination of Victoria line access and yields above 5% in N17 stands out in a city where many boroughs have compressed below 4%. See our analysis of the highest rental yield areas in London.
Average Rent & Gross Rental Yields in Tottenham
N17 delivers Tottenham's highest gross yield at 5.7%, where monthly rents of £2,088 meet asking prices of £437,618. Gross rental yield is calculated from the average asking price and average monthly rent for each postcode. It does not account for void periods, maintenance, management fees, or mortgage costs. For a full breakdown of running costs, see our buy-to-let costs guide.
At the other end, N10 Muswell Hill at 3.5% reflects the highest asking prices in the set absorbing strong absolute rents of £2,070. The yield spread across Tottenham is 2.2 percentage points. In a London borough, that gap is significant. It separates postcodes that can generate positive cash flow from those that rely entirely on capital growth. Learn how to calculate rental yield for your own analysis.
| Area | Average Monthly Rent | Average Asking Price | Gross Yield |
|---|---|---|---|
| N17 (Tottenham) | £2,088 | £437,618 | 5.7% |
| N15 (South Tottenham, Seven Sisters) | £1,920 | £481,607 | 4.8% |
| N8 (Crouch End, Hornsey) | £2,053 | £573,400 | 4.3% |
| N22 (Wood Green) | £1,820 | £522,116 | 4.2% |
| N10 (Muswell Hill) | £2,070 | £703,252 | 3.5% |
The rent data reveals a compressed range compared to asking prices. Monthly rents span just £268 (from £1,820 in N22 to £2,088 in N17), while asking prices span £265,634. That compression is the yield story in one statistic. Landlords in N17 collect rents within 1% of those in N10, but pay 37.8% less for the property. The rental market treats these postcodes as far more similar than the sales market does.
N17's £2,088 monthly rent is the highest in the set. The stadium, Overground stations, and regeneration activity create rental demand that supports above-average rents from a below-average price base. N10 at £2,070 collects almost the same absolute rent but from a property costing £265,634 more.
Is Tottenham Rent High?
Rents across all five Tottenham postcodes absorb between 49.6% and 57.0% of gross monthly income, based on Haringey's median salary of £43,995 per year (£846.10 per week). That is below the London regional median of £892.60 per week and above the Great Britain median of £752.40 per week. Data from the Nomis Labour Market Profile (ASHE 2025).
Every postcode sits above the widely cited 30% affordability threshold. That is standard for London, where high demand and constrained supply keep rents elevated relative to local earnings. For landlords, the data confirms sustained demand from tenants who have limited alternatives.
| Rank | Area | Rent as % of Income |
|---|---|---|
| 1 | N17 (Tottenham) | 57.0% |
| 2 | N10 (Muswell Hill) | 56.5% |
| 3 | N8 (Crouch End, Hornsey) | 56.0% |
| 4 | N15 (South Tottenham, Seven Sisters) | 52.4% |
| 5 | N22 (Wood Green) | 49.6% |
N17 tops the table at 57.0% of gross income. That is the highest rent-to-income ratio despite N17 having the lowest asking price. The £2,088 monthly rent absorbs a larger share of local earnings than any other postcode because Haringey's median salary is measured borough-wide. Tenants in N17 are often on incomes below the borough median, which pushes the ratio higher.
N22 at 49.6% is the most affordable postcode for tenants. Wood Green's lower rents (£1,820) combined with the borough-wide salary figure produce the narrowest rent-to-income gap. For landlords, that marginally lower pressure on tenants may translate to slightly lower void risk.
Thinking of Buying?
We have off-market investment properties averaging 8%+ annual yield.
View Property DealsBuy-to-Let Considerations
Are House Prices High? Price-to-Earnings Ratios
Purchasing a property in Tottenham requires between 9.9 and 16.0 times the median annual salary. This is based on the Nomis Labour Market Profile for Haringey showing the median gross annual income for Haringey residents is £43,995.
The spread across postcodes reflects the two-tier market. N17 at 9.9x is the only postcode below 10 times annual earnings. N10 at 16.0x sits at a level where mortgage affordability on a single local income would be extremely stretched. For buy-to-let investors, the price-to-earnings ratio matters because it shapes tenant demand. Areas where buying is difficult relative to local incomes tend to have deeper rental pools.
| Rank | Area | Price-to-Earnings Ratio |
|---|---|---|
| 1 | N17 (Tottenham) | 9.9x |
| 2 | N15 (South Tottenham, Seven Sisters) | 10.9x |
| 3 | N22 (Wood Green) | 11.9x |
| 4 | N8 (Crouch End, Hornsey) | 13.0x |
| 5 | N10 (Muswell Hill) | 16.0x |
Every Tottenham postcode sits above the long-run UK average of around 4-5x earnings. That is the London reality. Even N17 at 9.9x requires either a dual income, significant deposit, or investor financing. The ratios underscore why rental demand remains structurally high across the borough. Most local workers cannot afford to buy, particularly in N8, N10, and N22 where ratios exceed 11x.
Deposit Requirements in Tottenham
Buy-to-let mortgages typically require a minimum 25% deposit, though many lenders and products use 30% as the standard for the most competitive rates. The table below uses 30% of the average asking price. Actual deposit requirements will depend on the lender, the borrower's portfolio, and the specific property. Use our stamp duty calculator to estimate total upfront costs including the additional dwelling surcharge.
Deposits in Tottenham range from £131,285 in N17 to £210,976 in N10. The £79,691 gap between cheapest and most expensive deposit buys an entirely different investment profile. N17's lower deposit comes with the highest yield at 5.7%. N10's higher deposit delivers 3.5% yield and negative five-year growth.
| Rank | Area | 30% Deposit Required |
|---|---|---|
| 1 | N17 (Tottenham) | £131,285 |
| 2 | N15 (South Tottenham, Seven Sisters) | £144,482 |
| 3 | N22 (Wood Green) | £156,635 |
| 4 | N8 (Crouch End, Hornsey) | £172,020 |
| 5 | N10 (Muswell Hill) | £210,976 |
N17 at £131,285 is the lowest deposit in the set. Combined with stamp duty land tax at the additional dwelling rate (approximately £31,262 on a £437,618 purchase), the total upfront capital requirement is around £162,547. For investors exploring off-market properties, negotiating below asking price would reduce both figures.
The step from N17 to N15 adds £13,197 to the deposit. For that additional outlay, N15 offers Victoria line access at Seven Sisters and 4.8% yield. The step from N22 to N8 adds a further £15,385 but drops yield from 4.2% to 4.3%, with the premium buying neighbourhood character rather than income. See our guide to no-deposit investment property for alternative entry strategies.
What the Tottenham Data Tells Buy-to-Let Investors
N17 leads on yield at 5.7% from the lowest asking price of £437,618 and the lowest deposit at £131,285. Monthly rents of £2,088 are the highest in the set. The postcode is the direct beneficiary of the Tottenham Hotspur Stadium, High Road West, and Broadwater Farm regeneration programmes. Transaction volumes of 29 per month confirm an active market. For investors focused on rental income, N17 concentrates the data points that matter: highest yield, highest rent, lowest price, lowest deposit.
N8 and N22 present the growth case. Crouch End (N8) has delivered 15.5% five-year growth with consistent appreciation across all time windows. Wood Green (N22) leads one-year growth at 14.4%. Both postcodes have yields above 4%, which means growth has not come at the expense of all rental return. The trade-off is higher entry costs: £573,400 in N8 and £522,116 in N22.
N15 sits between the yield and growth profiles. Seven Sisters at £481,607 offers 4.8% yield, 5.1% one-year growth, and direct Victoria line access. The 0.0% five-year growth figure is flat rather than negative, suggesting a market that has stabilised rather than declined.
N10 records negative growth across all three time windows (-9.0% one-year, -8.5% three-year, -10.4% five-year) alongside the lowest yield at 3.5% and the highest asking price at £703,252. Muswell Hill's premium positioning has not protected it from price declines. The postcode is primarily an owner-occupier market where buy-to-let returns are compressed by high entry costs. Investors considering ways to reduce risk in property investment may find the data on N10 instructive as a contrast to the yield-led N17 profile.
How Tottenham Compares
Tottenham's mean asking price of £543,599 sits between Enfield (£527,549) and Hackney (£660,489) in the north and east London landscape. The comparison below measures Tottenham against four neighbouring boroughs using mean asking price, mean monthly rent, and top gross yield from each location's postcode data.
| Location | Mean Asking Price | Mean Monthly Rent | Top Gross Yield |
|---|---|---|---|
| Enfield | £527,549 | £1,881 | 6.2% |
| Tottenham | £543,599 | £1,990 | 5.7% |
| Hackney | £660,489 | £2,573 | 5.3% |
| Barnet | £691,818 | £2,114 | 5.7% |
| Islington | £693,161 | £2,698 | 5.1% |
Enfield is the closest comparison by price at £527,549 and delivers a higher top yield at 6.2%. The £16,050 saving on mean asking price comes with lower mean rents (£1,881 vs £1,990) and a less connected transport profile. Enfield's yield advantage reflects lower entry prices in its outer London postcodes.
Hackney charges a £116,890 premium over Tottenham's mean asking price. That gap buys higher absolute rents (£2,573 vs £1,990) but compresses yields to 5.3%. Hackney's gentrification trajectory ran a decade ahead of Tottenham's. Investors comparing the two are looking at a more mature market with higher entry costs.
Barnet at £691,818 is 27.3% more expensive than Tottenham and matches Tottenham's top yield at 5.7%. Barnet's higher rents (£2,114) partially offset the higher prices, but the deposit requirement is substantially larger. The borough covers a wider geographic spread with more suburban character.
Islington is the most expensive comparison at £693,161 with the highest rents at £2,698 but the lowest top yield at 5.1%. Islington is the premium inner London benchmark against which Tottenham's pricing becomes clearest: similar tube connectivity at a fraction of the price.
Browse all our best buy-to-let locations to see how Tottenham compares across the full UK market, or explore our London buy-to-let guide for borough-by-borough analysis. Investors considering the broader north London corridor can also view our North London buy-to-let overview. For current buy-to-let properties for sale, check our listings page. To explore available investment property, visit our main sales page.
Frequently Asked Questions
What are the best postcodes for rental yield in Tottenham?
N17 (Tottenham) delivers the highest gross yield at 5.7%, with monthly rents of £2,088 against an average asking price of £437,618. N15 (South Tottenham, Seven Sisters) follows at 4.8% from a £481,607 asking price. The remaining postcodes range from 3.5% in N10 (Muswell Hill) to 4.3% in N8 (Crouch End). All five postcodes have rental data available. The 2.2 percentage point spread between the highest and lowest yield reflects the two-tier nature of this market.
How does the Tottenham Hotspur Stadium affect property investment?
The 62,303-capacity stadium opened in April 2019 as part of a near-£1 billion Northumberland Development Project in N17. The wider scheme includes a hotel, retail, and public realm improvements, with an estimated £293 million annual economic impact and 3,500 projected jobs. The adjacent High Road West scheme adds 2,600+ homes.
N17's asking prices (£437,618) are the lowest in the Tottenham postcode set, and the postcode records 29 sales per month. Five-year price growth in N17 stands at 4.2%, with three-year growth at -7.1%, suggesting the regeneration has not yet driven sustained price appreciation.
How does Tottenham compare to Hackney for buy-to-let?
Tottenham is £116,890 cheaper on mean asking price (£543,599 vs Hackney's £660,489) and delivers a higher top yield of 5.7% against Hackney's 5.3%. Hackney has higher mean monthly rents (£2,573 vs £1,990), reflecting its more established position in the east London market.
The deposit gap is significant: a 30% deposit in N17 Tottenham requires £131,285, while Hackney's equivalent entry points start higher. Both boroughs have strong tube connectivity. The data shows a lower entry cost in Tottenham with a higher top yield, and a higher rental income ceiling in Hackney at a higher price point.
What are the transport links in Tottenham?
Two tube lines and multiple Overground services connect Tottenham to central London. The Victoria line stops at Seven Sisters (N15) and Tottenham Hale (N17). The N22 postcode area has two further tube stations on a separate line: Turnpike Lane and Wood Green. Tottenham Hale is a major interchange with National Rail services, including the Stansted Express. The London Overground's Weaver line runs through stations at White Hart Lane, Bruce Grove, Northumberland Park, and Seven Sisters, connecting to Liverpool Street, Cheshunt, and Enfield Town. South Tottenham station on the Suffragette line adds a further Overground route. King's Cross is within 15 minutes from Tottenham Hale on the Victoria line.
Is Tottenham a good area for capital growth?
Growth varies significantly across postcodes. N8 (Crouch End, Hornsey) leads at 15.5% over five years, with consistent positive growth at 9.0% (one year) and 13.1% (three years). N22 (Wood Green) shows 11.9% five-year growth and 14.4% one-year growth. N17 has 4.2% five-year growth but -7.1% over three years and -1.0% over one year. N15 is flat at 0.0% over five years. N10 (Muswell Hill) has declined -10.4% over five years.
The Haringey-wide Land Registry average of £637,041 in January 2026 represents just 2.3% growth over five years (from £622,431 in January 2021). Capital growth in Tottenham's postcodes is concentrated in N8 and N22 rather than in the regeneration areas of N17.
What deposit do I need to buy a rental property in Tottenham?
From £131,285 in N17 to £210,976 in N10, based on 30% of the average asking price. N15 (South Tottenham) requires £144,482, N22 (Wood Green) requires £156,635, and N8 (Crouch End) requires £172,020.
Additional costs include stamp duty at the additional dwelling rate. On an N17 purchase of £437,618, the investor stamp duty would be approximately £31,262 (5% on the first £250,000 plus 10% on the remainder). Total upfront costs for N17 would be approximately £162,547 before legal and survey fees.
What types of property are available around Tottenham Hale?
Tottenham Hale sits in the N17 postcode, where the average asking price is £437,618 and average monthly rent is £2,088. The area has seen significant new-build development alongside the wider Tottenham regeneration programme, with purpose-built flats forming the bulk of recent stock. Haringey's flat average across the borough is £474,733 (Land Registry, January 2026).
The Tottenham Hale interchange provides Victoria line and National Rail services, including the Stansted Express. The combination of transport connectivity and regeneration-led new-build supply makes this area a focus for investors targeting the flat market in north London.
How do landlords manage rental properties in Tottenham?
Letting agents in Tottenham typically charge 8-12% of monthly rent for full management, covering tenant sourcing, rent collection, and maintenance coordination. On N17's average rent of £2,088, that equates to £167-£251 per month. Tenant-find-only services are cheaper at around one month's rent.
Gross yields in this guide do not deduct management fees. An investor using full management in N17 at 10% would see the effective yield reduce from 5.7% to approximately 5.2%. The five postcodes covered here are all within the London Borough of Haringey, so a single local agent can typically cover the full area.