

The Areas of London with the Highest Rental Yields and Rents
Bow (E3) has the highest gross rental yield in the tables below at 6.9%, and fourteen more districts clear 6% despite London's high asking prices.
The spread between districts is what makes the capital unusual. The same city holds a £309,715 average asking price in Barking and a £2,022,076 average in the West End, and weekly rents do not vary by anywhere near as much. That gap between prices and rents is what produces the yield differences in the tables below.
Article updated: August 2026
Best Rental Yields Across Greater London by Region
The tables group London's postcode districts into compass regions by their postcode area. Only districts that fall within a London borough are counted. The EC and WC codes at the very centre are not tabled here; the FAQ at the end covers why yields in prime central London run lower. Every figure comes from the August 2026 snapshot.
All the yields on this page are gross: they reflect average asking rents set against average asking prices, before any costs. Net returns land lower once running costs, void periods and management fees come out.
North London Highest Rental Yields (%)
| Area | Yield % | Avg. Asking Price £ | Avg. Weekly Rent £ |
|---|---|---|---|
| EN3 (Enfield Lock) | 6.5% | £366,581 | £461 |
| N17 (Tottenham) | 6.4% | £436,807 | £540 |
| N18 (Edmonton) | 5.8% | £431,623 | £481 |
| NW9 (Colindale) | 5.7% | £447,688 | £494 |
| HA9 (Wembley Park) | 5.6% | £467,334 | £501 |
| N7 (Holloway) | 5.5% | £534,940 | £566 |
| N9 (Lower Edmonton) | 5.5% | £382,017 | £408 |
| NW8 (St John's Wood) | 5.2% | £1,140,478 | £1,139 |
| HA0 (Wembley) | 5.1% | £473,592 | £468 |
| N1 (Islington) | 5.1% | £727,722 | £720 |
North London's top ten spans the widest price range of any regional yield table. Enfield Lock (EN3) tops it at 6.5% on a £366,581 average asking price, while St John's Wood (NW8) makes the same list at 5.2% on £1,140,478, alongside the region's highest weekly rent at £1,139. In between, Tottenham (N17) holds 6.4% and the Edmonton districts (N18, N9) run 5.5% to 5.8% with asking prices under £432,000.
East London Highest Rental Yields (%)
| Area | Yield % | Avg. Asking Price £ | Avg. Weekly Rent £ |
|---|---|---|---|
| E3 (Bow) | 6.9% | £422,679 | £562 |
| IG11 (Barking) | 6.8% | £309,715 | £406 |
| E20 (Olympic Park) | 6.6% | £569,544 | £722 |
| E16 (Canning Town) | 6.4% | £431,785 | £530 |
| RM10 (Dagenham East) | 6.3% | £362,554 | £439 |
| E1 (Whitechapel) | 6.2% | £576,733 | £688 |
| E15 (Stratford) | 6.2% | £436,172 | £518 |
| E6 (East Ham) | 6.2% | £419,979 | £503 |
| RM8 (Dagenham Becontree) | 6.2% | £380,500 | £454 |
| RM9 (Dagenham Heathway) | 6.1% | £377,860 | £441 |
East London is the only region where the entire yield top ten clears 6%. Bow (E3) leads at 6.9%, the highest yield in any region, and Barking (IG11) sits just behind at 6.8% on £309,715, the lowest average asking price anywhere in these tables. Olympic Park (E20) pairs a 6.6% yield with £722 weekly rents, and the Dagenham districts (RM8, RM9, RM10) all hold 6.1% to 6.3% with asking prices under £381,000.
South London Highest Rental Yields (%)
| Area | Yield % | Avg. Asking Price £ | Avg. Weekly Rent £ |
|---|---|---|---|
| SE16 (Rotherhithe) | 6.3% | £460,920 | £560 |
| SE28 (Thamesmead) | 6.2% | £347,829 | £413 |
| SE8 (Deptford) | 6.2% | £424,529 | £509 |
| SE25 (South Norwood) | 5.8% | £342,626 | £383 |
| DA8 (Erith) | 5.7% | £343,831 | £378 |
| SE14 (New Cross) | 5.7% | £432,140 | £471 |
| SE18 (Woolwich) | 5.7% | £429,727 | £470 |
| SE2 (Abbey Wood) | 5.7% | £432,687 | £470 |
| SE5 (Camberwell) | 5.7% | £476,443 | £526 |
| SW9 (Stockwell) | 5.7% | £511,434 | £561 |
South London has the tightest spread of yields in any regional table, from 6.3% in Rotherhithe (SE16) at the top to 5.7% at the bottom. Thamesmead (SE28) and Deptford (SE8) sit at 6.2%, and a six-way tie at 5.7% stretches across asking prices from £343,831 in Erith (DA8) to £511,434 in Stockwell (SW9). South Norwood (SE25) carries the lowest average asking price in the table at £342,626.

West London Highest Rental Yields (%)
| Area | Yield % | Avg. Asking Price £ | Avg. Weekly Rent £ |
|---|---|---|---|
| UB2 (Southall) | 5.8% | £425,790 | £475 |
| UB3 (Hayes) | 5.7% | £404,750 | £444 |
| TW13 (Feltham) | 5.6% | £381,832 | £410 |
| TW8 (Brentford) | 5.4% | £481,566 | £500 |
| TW14 (Hatton) | 5.3% | £396,482 | £406 |
| UB7 (West Drayton) | 5.3% | £387,234 | £392 |
| W2 (Paddington) | 5.3% | £981,985 | £1,000 |
| UB1 (Southall) | 5.2% | £466,880 | £469 |
| UB5 (Northolt) | 5.2% | £391,298 | £390 |
| W3 (Acton) | 5.1% | £537,898 | £526 |
Nine of West London's ten districts sit in a narrow asking-price band, between £381,832 and £537,898. Southall (UB2) tops the list at 5.8%, with Hayes (UB3) at 5.7% and Feltham (TW13) at 5.6%. The outlier is Paddington (W2): a 5.3% yield on a £981,985 average asking price, with weekly rents of £1,000.
Highest Weekly Rents (£) Across Greater London by Region
Rental income is the other half of the picture. The tables below rank the highest average weekly rents in each region, alongside the yield and the average asking price each of those rents sits on. To turn a weekly figure into a monthly one, multiply by 52 and divide by 12.
North London Highest Rent Per Week (£)
| Area | Avg. Weekly Rent £ | Yield % | Avg. Asking Price £ |
|---|---|---|---|
| NW8 (St John's Wood) | £1,139 | 5.2% | £1,140,478 |
| NW3 (Hampstead) | £847 | 3.9% | £1,123,888 |
| N1 (Islington) | £720 | 5.1% | £727,722 |
| NW1 (Camden Town) | £720 | 4.5% | £826,239 |
| NW5 (Kentish Town) | £655 | 5.1% | £665,127 |
| N5 (Highbury) | £610 | 4.7% | £681,161 |
| NW6 (Kilburn) | £599 | 4.8% | £653,689 |
| NW11 (Golders Green) | £588 | 3.2% | £953,025 |
| EN4 (Cockfosters) | £578 | 3.5% | £854,100 |
| N4 (Finsbury Park) | £577 | 5.0% | £600,818 |
East London Highest Rent Per Week (£)
| Area | Avg. Weekly Rent £ | Yield % | Avg. Asking Price £ |
|---|---|---|---|
| E20 (Olympic Park) | £722 | 6.6% | £569,544 |
| E1 (Whitechapel) | £688 | 6.2% | £576,733 |
| E9 (Homerton) | £622 | 6.0% | £535,785 |
| E2 (Bethnal Green) | £607 | 5.7% | £551,854 |
| E8 (Hackney Central) | £588 | 5.0% | £614,260 |
| E14 (Canary Wharf) | £584 | 6.0% | £508,668 |
| E3 (Bow) | £562 | 6.9% | £422,679 |
| E5 (Clapton) | £546 | 4.9% | £578,906 |
| E16 (Canning Town) | £530 | 6.4% | £431,785 |
| E15 (Stratford) | £518 | 6.2% | £436,172 |
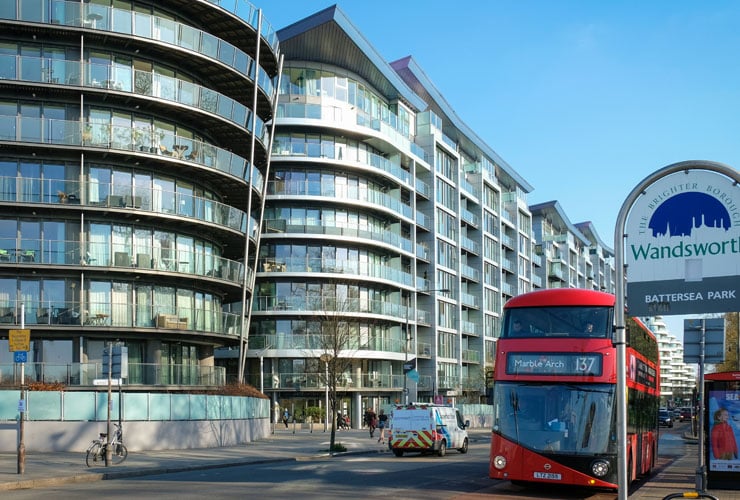
South London Highest Rent Per Week (£)
| Area | Avg. Weekly Rent £ | Yield % | Avg. Asking Price £ |
|---|---|---|---|
| SW7 (South Kensington) | £1,016 | 2.7% | £1,961,641 |
| SW13 (Barnes) | £1,014 | 4.4% | £1,189,833 |
| SW1 (Westminster) | £998 | 3.3% | £1,559,225 |
| SW3 (Chelsea) | £865 | 2.4% | £1,837,252 |
| SW10 (West Brompton) | £851 | 3.9% | £1,142,297 |
| SW11 (Battersea) | £790 | 5.2% | £782,445 |
| SW8 (Battersea Power Station) | £736 | 5.0% | £764,942 |
| SW6 (Fulham) | £731 | 4.0% | £944,634 |
| SE11 (Kennington) | £709 | 5.4% | £676,955 |
| SE1 (South Bank) | £695 | 5.2% | £698,521 |
West London Highest Rent Per Week (£)
| Area | Avg. Weekly Rent £ | Yield % | Avg. Asking Price £ |
|---|---|---|---|
| W8 (Kensington) | £1,155 | 3.2% | £1,854,389 |
| W1 (West End) | £1,002 | 2.6% | £2,022,076 |
| W2 (Paddington) | £1,000 | 5.3% | £981,985 |
| W11 (Notting Hill) | £909 | 3.9% | £1,215,095 |
| TW10 (Richmond Park) | £786 | 4.6% | £882,372 |
| W6 (Hammersmith) | £730 | 4.8% | £784,811 |
| TW9 (Richmond) | £648 | 4.4% | £760,153 |
| W12 (Shepherd's Bush) | £626 | 4.5% | £728,898 |
| W9 (Maida Vale) | £617 | 4.4% | £729,365 |
| W10 (North Kensington) | £610 | 4.5% | £709,902 |
Eight districts appear in both their region's yield top ten and its rent top ten. Five are in East London: Bow (E3), Olympic Park (E20), Canning Town (E16), Whitechapel (E1) and Stratford (E15). St John's Wood (NW8) and Islington (N1) do the same in the North, and Paddington (W2) in the West. South London has no overlap at all: every district in its rent table shows a lower yield than any district in its yield table.
What Drives London's Highest Rental Yields
One pattern runs through every table above, and through the wider London buy-to-let market: yields climb where asking prices fall further than rents do.
Because the yield is a simple calculation of the property price and the rental income, outer London districts dominate the high-yield tables: asking prices in Barking, Dagenham and Thamesmead sit hundreds of thousands of pounds below the central districts, while the weekly rents do not fall by anywhere near the same proportion. London commuter towns have historically pushed the same arithmetic further, with lower house prices again outside the boroughs. To see where the capital sits nationally, our best rental yields UK guide ranks locations across the country.
For stock priced below market value, see our below market value properties, alongside the wider buy to let property for sale listings across the UK.
Not every property in these districts is let or lived in, either. Our data on empty houses in London breaks down the capital's empty stock.
Good transport connections support tenant demand. Abbey Wood (SE2) and Woolwich (SE18) both sit on the Elizabeth line, and both appear in the South London top ten at 5.7% in the August 2026 snapshot. TfL's passenger usage report sets out how the line changed travel patterns across the capital in its first year of operation.
Why Data Can Fluctuate
Rental yield data moves through the year for a few reasons:
- Seasonal variations in the rental market.
- Thin months. If a district has few properties listed to rent or for sale, a handful of listings can swing its averages.
- Newly listed stock coming to market above or below the going rate, shifting a district's asking-price average.
- Changes in local amenities or transport links that shift tenant demand and rents.
Longer-term trends give more context than any single month of yield data on its own.
Frequently Asked Questions
What is a good rental yield in Greater London?
In the August 2026 snapshot, the highest gross yields in the capital are 6.9% in Bow (E3) and 6.8% in Barking (IG11). The four regional top-ten yield tables run from 5.1% at the bottom of the North and West lists to 6.9% at the top of the East list. Prime districts run far lower: Chelsea (SW3, grouped South by its postcode) shows 2.4%. For comparison with other major cities, see our Manchester buy-to-let guide.
Are higher yields always better for buy-to-let investors?
The data shows a trade-off. The highest yields cluster in the cheapest house price regions of the capital, while the highest weekly rents sit in districts where asking prices, most of them seven figures, pull the percentage return down. Yield is one number inside a bigger calculation that takes in the tenant market, running costs and monthly cash flow, and our investment property checklist lists the factors experienced investors weigh up alongside it.
How do I calculate rental yield?
Gross yield is the annual rent divided by the purchase price, expressed as a percentage. We have an article with a rental yield calculator here.
What do properties cost in London's highest-yield districts?
Fifteen of the forty districts in the regional yield tables show a gross yield above 6%, and their average asking prices run from £309,715 in Barking (IG11) to £576,733 in Whitechapel (E1). Ten of the fifteen are in East London, with the rest split between the North (EN3, N17) and the South (SE16, SE28, SE8).
Why are yields in central London often lower?
Central London has an exceptionally high price ceiling. Demand from wealthy international buyers and diplomats means the most expensive streets in London are found here, and when the asking price runs to seven figures, even a four-figure weekly rent produces a small percentage return.
The August 2026 snapshot shows it clearly. The West End (W1), which takes in Mayfair and Fitzrovia, averages £1,002 a week in rent but a 2.6% yield on a £2,022,076 average asking price. Chelsea (SW3) averages £865 a week and a 2.4% yield on £1,837,252. At the other end of the market, Barking (IG11) yields 6.8% on £406 a week and a £309,715 average asking price. That is the maths behind any investment property in central London: high rents, higher prices, lower percentage returns.
This is why central London boroughs like Westminster are often at the top of the lists for the highest property prices in London.
Ready to buy property?
Browse investment properties with prices and gross yields shown for each opportunity.
See the latest deals