Where to Buy Property Investments in Edinburgh: Yields of 6.6%
Edinburgh's gross rental yields range from 4.0% to 6.6% across the 12 postcodes with rental data, with EH6 (Leith) and EH8 (Newington, Southside) delivering the highest returns. Average sold prices sit 0.5% above the England average, and the city's population grew 7.6% to 512,700 between the 2011 and 2022 censuses.
Edinburgh's headline price of £293,243 masks a housing stock dominated by flats and tenement conversions. Compare like-for-like and every property type costs significantly more than the England average. Detached houses at £676,349 are 43.4% above England's £471,667, while Edinburgh flats at £238,397 sit 8.7% higher. The overall figure stays close to England's £291,865 because flats make up a far larger share of Edinburgh sales than in most English cities. Asking prices range from £205,750 in EH11 to £474,923 in EH2, and rental data is available for 12 of the city's 22 postcodes.
This guide covers all 22 Edinburgh postcodes from EH1 to EH30 under the City of Edinburgh council area (ONS code S12000036). Edinburgh is a city in Scotland and the country's capital, a UNESCO World Heritage Site, and home to four universities. Investors comparing options in Scotland may also consider Glasgow, Aberdeen, or Dundee. Browse all our Scotland location guides.
Article updated: April 2026
Edinburgh Buy-to-Let Market Overview 2026
Edinburgh offers capital-city fundamentals with median salaries 8.2% above the Great Britain average, a growing population, and a flat-dominated housing stock that keeps the overall price close to the England average despite premium values at the property-type level.
- Average sold price: £293,243 (0.5% above England's £291,865)
- Asking price range: £205,750 (EH11) to £474,923 (EH2)
- Rental yields: 4.0% (EH9) to 6.6% (EH6, EH8) across postcodes with rental data
- Rental income: Monthly rents from £1,074 (EH11) to £1,731 (EH3)
- Price per sq ft: Sold prices from £269/sq ft (EH28) to £488/sq ft (EH3)
- Market activity: Sales ranging from 4 per month (EH2) to 97 per month (EH12)
- Deposit requirements: 30% deposits range from £61,725 (EH11) to £142,477 (EH2)
- Affordability ratios: Property prices from 4.8 to 11.0 times Edinburgh's median annual salary of £43,169
Contents

-
by Robert Jones, Founder of Property Investments UK
With two decades in UK property, Rob has been investing in buy-to-let since 2005, and uses property data to develop tools for property market analysis.

Property Data Sources
Our location guide relies on diverse, authoritative datasets including:
- UK House Price Index
- Ministry of Housing, Communities and Local Government
- Ordnance Survey Data Hub
- Propertydata.co.uk
We update our property data quarterly to ensure accuracy. Last update: April 2026. All data is presented as provided by our sources without adjustments or amendments.
Why Invest in Edinburgh?
Edinburgh's population reached 512,700 in the 2022 Scotland Census, a 7.6% increase from 476,626 in 2011. That is roughly 36,000 additional residents over 11 years. As Scotland's capital and second-largest city, Edinburgh draws workers across financial services, technology, higher education, and the public sector. The city is home to four universities, including the University of Edinburgh (a Russell Group institution) and Edinburgh Napier University, creating consistent student and graduate demand for rental accommodation.
Edinburgh's median gross annual salary of £43,169 sits 8.2% above the Scotland median (£39,905) and 10.3% above the Great Britain median (£39,125). The employment rate stands at 83.2%. Edinburgh's financial services sector anchors the economy. The city is the UK's second-largest financial centre after London, with Standard Life, Baillie Gifford, and major banking operations headquartered here. Tourism contributes over £2 billion annually, driven by the Edinburgh Festival Fringe (the world's largest arts festival) and the city's UNESCO World Heritage status.
Edinburgh Economic Summary
- Population: 512,700 (2022 Scotland Census). Growth of 7.6% from 2011.
- Median annual salary: £43,169 (local), £39,905 (Scotland), £39,125 (Great Britain)
- Employment rate: 83.2% (local)
- Key employment sectors: Financial services, higher education, tourism, technology, public sector, healthcare
Source: ONS Explore Local Statistics, Nomis Labour Market Profile (ASHE 2025)
Regeneration and Investment in Edinburgh
Edinburgh has over £5 billion in active regeneration and infrastructure programmes. Three projects stand out for scale, confirmed funding, and proximity to residential postcodes.
- Granton Waterfront (Phase 1 construction from early 2026, £1.3 billion total programme): A 134-acre brownfield coastal site three miles north of the city centre, delivering 3,500 homes, a primary school, commercial space, and what is planned to be Europe's largest coastal park. Phase 1 brings 847 homes with at least 45% affordable. Updates at City of Edinburgh Council.
- West Town Edinburgh (Planning approved December 2024, £2 billion): A 205-acre site between Ingliston Park and Ride and the Gogar Roundabout, delivering 7,000 mixed-tenure homes, a primary school, a high school, a hotel, and a new tram stop. Drum Property Group is the developer. Updates at West Town Edinburgh.
- Edinburgh Tram Extension (Consultation complete, business case 2026, £2 billion to £2.9 billion): A proposed north-south tram line connecting Granton to Edinburgh BioQuarter and the Royal Infirmary via Princes Street and North Bridge, projected to carry 13 million passengers per year by 2032. Updates at City of Edinburgh Council.

Edinburgh Property Market Analysis
Edinburgh is tracked as "City of Edinburgh" in the UK House Price Index. Data begins in January 2004, so the full cycle analysis covers 2004 to the present.
When was the last house price crash in Edinburgh?
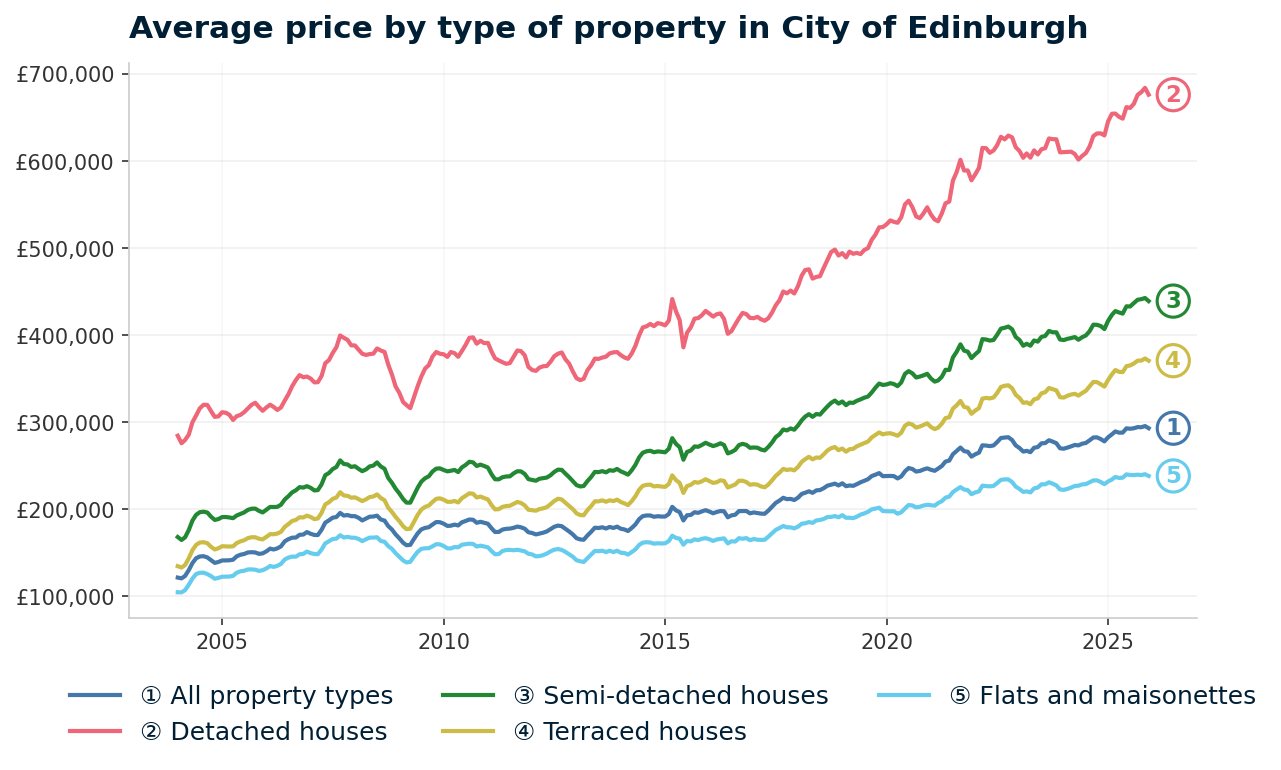
Edinburgh's average property price has risen 141.1% from £121,643 in January 2004 to £293,243 in December 2025.
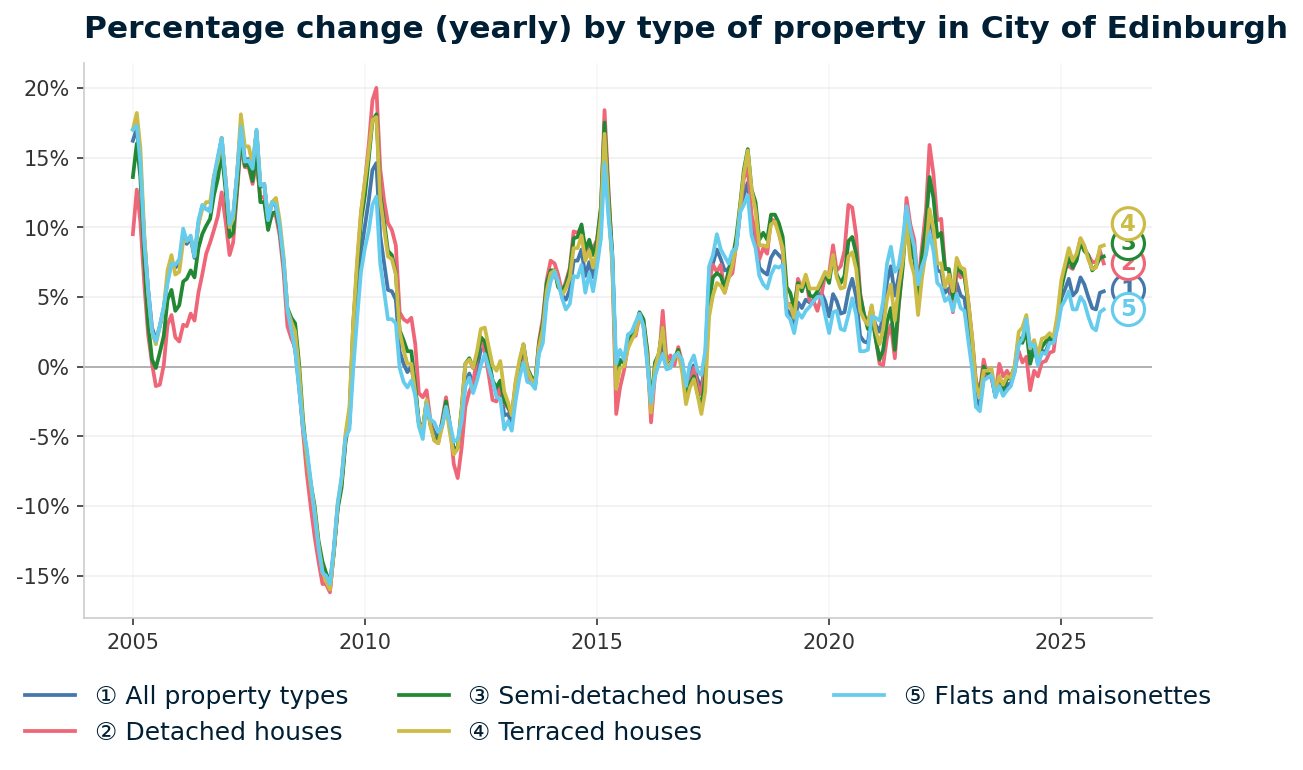
Edinburgh's price peaked at £195,921 in September 2007 before falling 18.9% to £158,844 by March 2009. The worst annual change reading hit -16.0% in April 2009. Here is how Edinburgh's property prices moved through each cycle:
- 2004-2007 (Pre-crash growth): Prices rose from £121,643 in January 2004 to £195,921 in September 2007, an increase of 61.1% in under four years. Annual growth ran above 10% through much of this period, with 13.3% recorded in January 2007.
- 2007-2009 (Financial crisis): From the September 2007 peak of £195,921, prices fell 18.9% to £158,844 by March 2009. Edinburgh's decline of 18.9% was slightly steeper than Scotland's 17.5% drop but closely matched England's 18.2% fall. The worst annual change reading of -16.0% came in April 2009.
- 2009-2012 (False recovery and second dip): Prices recovered quickly to £183,578 by January 2010, a 10.1% annual gain. This recovery stalled, and by January 2013 prices had dipped back to £166,879, still 14.8% below the 2007 peak.
From 2013 onward, Edinburgh entered a sustained recovery that accelerated through the pandemic years:
- 2013-2016 (Recovery): Sustained growth returned from 2014, with 6.5% annual growth in January 2014. Prices passed the pre-crash peak in March 2015 at £202,935, taking seven and a half years to recover. By January 2016, prices reached £197,517.
- 2017-2019 (Steady growth): Growth ran between 2% and 5% through this period. By December 2019, prices reached £238,161, sitting 21.6% above the pre-crash peak.
- 2020-2022 (Pandemic surge): Prices accelerated through the pandemic period, rising from £238,303 in January 2020 to £273,421 by June 2022, a 14.7% increase in two and a half years. The stamp duty holiday (Scotland's LBTT holiday) contributed to increased transaction volumes.
- 2023 (Rate shock): Growth slowed sharply as mortgage rates rose. Annual change turned negative, reaching -0.7% in June 2023 and -0.3% in January 2024.
- 2024-2025 (Current): Prices recovered through 2024 and into 2025. The latest reading of £293,243 in December 2025 represents 5.4% annual growth, the strongest year-on-year figure since mid-2022.
Long-term growth summary:
- 5 years (2020-2025): 18.7% growth (£247,145 to £293,243)
- 10 years (2015-2025): 47.3% growth (£199,069 to £293,243)
- Full data history (2004-2025): 141.1% growth (£121,643 to £293,243)
Edinburgh took seven and a half years to recover from the 2007-2009 correction, with a double dip between 2010 and 2013 extending the flat period. The city has since outpaced both the Scottish and UK averages, with 5.4% annual growth in December 2025.
Source: UK House Price Index for City of Edinburgh, January 2004 to December 2025.
Thinking of Buying?
We have off-market investment properties averaging 8%+ annual yield.
View Property DealsSold House Prices in Edinburgh
Edinburgh's average sold price of £293,243 sits 0.5% above the England average of £291,865. That headline parity is misleading. Edinburgh's housing stock is heavily weighted towards flats and tenement conversions, and when you compare like-for-like, every property type in Edinburgh costs substantially more than the England average.
| Property Type | Edinburgh Average | England Average | Difference |
|---|---|---|---|
| Detached houses | £676,349 | £471,667 | +£204,682 (+43.4%) |
| Semi-detached houses | £439,238 | £289,135 | +£150,103 (+51.9%) |
| Terraced houses | £370,788 | £244,830 | +£125,958 (+51.5%) |
| Flats and maisonettes | £238,397 | £219,340 | +£19,057 (+8.7%) |
| All property types | £293,243 | £291,865 | +£1,378 (+0.5%) |
Detached houses in Edinburgh cost £676,349, a 43.4% premium over England's £471,667. Edinburgh has far fewer detached properties relative to its total stock, and those that exist tend to be in premium suburbs like Cramond (EH4), Corstorphine (EH12), and the Pentland foothills (EH13, EH14). The scarcity pushes prices well above the English equivalent.
Semi-detached and terraced houses show similar premiums of 51.9% and 51.5% respectively. Edinburgh's Victorian and Edwardian family homes are concentrated in established suburbs like Morningside (EH10), Blackhall (EH4), and Portobello (EH15). These postcodes typically price above £280,000.
Flats at £238,397 carry the smallest premium at 8.7% above England's £219,340. Edinburgh's Georgian and Victorian tenement flats make up the bulk of the city's housing stock and account for most buy-to-let purchases. Flats in EH6 (Leith), EH11 (Gorgie), and EH16 (Liberton) start well below £250,000.
The composition effect is the key takeaway. Edinburgh's overall average of £293,243 looks comparable to England's £291,865, but that is because flats dominate Edinburgh's sales mix. Investors buying detached, semi-detached, or terraced properties in Edinburgh are paying 43% to 52% more than the England average for those types.
Property Data Sources
Our location guide relies on diverse, authoritative datasets including:
- UK House Price Index
- Ministry of Housing, Communities and Local Government
- Ordnance Survey Data Hub
- Propertydata.co.uk
We update our property data quarterly to ensure accuracy. Last update: April 2026. All data is presented as provided by our sources without adjustments or amendments.
Price Per Square Foot in Edinburgh
Price per square foot strips out the size variable and shows where built space costs the most. Edinburgh's price per square foot ranges from £269 in EH28 (Ratho) to £488 in EH3 (Stockbridge, Inverleith), a £219 spread across 21 postcodes with data. EH2 (New Town) has insufficient transaction data for a reliable figure.
| Rank | Area | Price Per Sq Ft |
|---|---|---|
| 1 | EH28 (Ratho) | £269 |
| 2 | EH27 (Kirknewton) | £275 |
| 3 | EH21 (Musselburgh) | £277 |
| 4 | EH29 (Kirkliston) | £282 |
| 5 | EH17 (Gilmerton) | £292 |
| 6 | EH30 (South Queensferry) | £300 |
| 7 | EH5 (Granton, Trinity) | £302 |
| 8 | EH16 (Liberton, Cameron Toll) | £307 |
| 9 | EH11 (Gorgie, Dalry) | £322 |
| 10 | EH14 (Currie, Balerno) | £335 |
| 11 | EH13 (Colinton, Oxgangs) | £339 |
| 12 | EH12 (Corstorphine, Murrayfield) | £357 |
| 13 | EH4 (Blackhall, Cramond) | £367 |
| 14 | EH8 (Newington, Southside) | £368 |
| 15 | EH6 (Leith) | £370 |
| 16 | EH15 (Portobello, Duddingston) | £379 |
| 17 | EH7 (Leith Walk, Restalrig) | £390 |
| 18 | EH10 (Morningside, Fairmilehead) | £453 |
| 19 | EH9 (Marchmont, Grange) | £458 |
| 20 | EH1 (Old Town, New Town) | £465 |
| 21 | EH3 (Stockbridge, Inverleith) | £488 |
| - | EH2 (New Town) | Not enough data |
The four most expensive postcodes per square foot (EH3, EH1, EH9, EH10) all price above £450. These are Edinburgh's premium residential areas: the Georgian terraces of Stockbridge, the flats of Old Town and New Town, and the Victorian villas of Marchmont and Morningside. Space costs roughly 75% more per square foot here than in the city's outer postcodes.
EH7 (Leith Walk) at £390 per square foot costs more per square foot than several wealthier postcodes. EH4 (Blackhall, Cramond) at £367 and EH12 (Corstorphine, Murrayfield) at £357 both sit lower in the table, reflecting the smaller average flat sizes in Leith Walk's tenement stock rather than absolute property values.
The four cheapest postcodes (EH28, EH27, EH21, EH29) all price below £285 per square foot. These outer areas offer larger properties at lower per-square-foot costs, though they sit further from the city centre and have lower transaction volumes.
Edinburgh Houses for Sale: Asking Prices by Postcode
Asking prices in Edinburgh range from £205,750 in EH11 (Gorgie, Dalry) to £474,923 in EH2 (New Town), a £269,173 spread. The mean asking price across all 20 postcodes with data is £319,974. Two postcodes (EH27 and EH28) have insufficient listing data.
| Rank | Area | Asking Price |
|---|---|---|
| 1 | EH2 (New Town) | £474,923 |
| 2 | EH9 (Marchmont, Grange) | £442,188 |
| 3 | EH3 (Stockbridge, Inverleith) | £417,854 |
| 4 | EH10 (Morningside, Fairmilehead) | £416,718 |
| 5 | EH4 (Blackhall, Cramond) | £392,551 |
| 6 | EH12 (Corstorphine, Murrayfield) | £363,592 |
| 7 | EH1 (Old Town, New Town) | £361,429 |
| 8 | EH13 (Colinton, Oxgangs) | £324,355 |
| 9 | EH30 (South Queensferry) | £310,801 |
| 10 | EH29 (Kirkliston) | £306,429 |
| 11 | EH17 (Gilmerton) | £292,323 |
| 12 | EH15 (Portobello, Duddingston) | £288,026 |
| 13 | EH21 (Musselburgh) | £281,897 |
| 14 | EH14 (Currie, Balerno) | £278,714 |
| 15 | EH8 (Newington, Southside) | £264,464 |
| 16 | EH7 (Leith Walk, Restalrig) | £252,105 |
| 17 | EH5 (Granton, Trinity) | £249,707 |
| 18 | EH16 (Liberton, Cameron Toll) | £245,531 |
| 19 | EH6 (Leith) | £230,124 |
| 20 | EH11 (Gorgie, Dalry) | £205,750 |
| — | EH27 (Kirknewton) | Not enough data |
| — | EH28 (Ratho) | Not enough data |
Seven postcodes price above £350,000, forming Edinburgh's premium tier. EH2 (New Town) at £474,923 leads, followed by EH9 (Marchmont, Grange) at £442,188 and EH3 (Stockbridge, Inverleith) at £417,854. These are the city's most established residential postcodes, characterised by Georgian townhouses and large Victorian flats.
Six postcodes sit below £265,000, forming the more accessible end of Edinburgh's market. EH11 (Gorgie, Dalry) at £205,750 is the cheapest postcode with data. EH6 (Leith) at £230,124, EH16 (Liberton, Cameron Toll) at £245,531, and EH5 (Granton, Trinity) at £249,707 also sit comfortably below the city average. These are the postcodes where Edinburgh's yield data concentrates, as lower prices combined with rents above £1,000 per month produce the city's highest returns.
For investors looking at below market value properties or renovation properties, Edinburgh's lower-priced postcodes offer entry points starting from £205,750, roughly £114,000 below the city's mean asking price.

House Price Growth in Edinburgh
Growth patterns across Edinburgh's postcodes vary significantly. EH21 (Musselburgh) leads on 3-year growth at 16.9%, followed by EH17 (Gilmerton) at 16.4% and EH16 (Liberton, Cameron Toll) at 14.3%. All three are outer postcodes with asking prices below £300,000. At the other end, EH28 (Ratho) shows -15.4% over three years, though this reflects its very low transaction volume of 5 sales per month.
| Area | 1 Year | 3 Years | 5 Years |
|---|---|---|---|
| EH16 (Liberton, Cameron Toll) | +3.3% | +14.3% | +24.9% |
| EH29 (Kirkliston) | +4.9% | +8.4% | +24.0% |
| EH30 (South Queensferry) | -5.0% | +5.7% | +22.8% |
| EH21 (Musselburgh) | +4.1% | +16.9% | +22.4% |
| EH15 (Portobello, Duddingston) | +10.7% | +6.5% | +18.5% |
| EH7 (Leith Walk, Restalrig) | +1.3% | +8.6% | +18.2% |
| EH13 (Colinton, Oxgangs) | -6.4% | +11.2% | +18.1% |
| EH8 (Newington, Southside) | +7.8% | +2.4% | +17.5% |
| EH11 (Gorgie, Dalry) | +2.6% | +0.6% | +17.1% |
| EH1 (Old Town, New Town) | -8.3% | +7.3% | +16.5% |
| EH6 (Leith) | +1.5% | +5.0% | +15.8% |
| EH12 (Corstorphine, Murrayfield) | +2.2% | -1.5% | +14.2% |
| EH17 (Gilmerton) | +10.9% | +16.4% | +11.0% |
| EH14 (Currie, Balerno) | +0.7% | +10.2% | +10.7% |
| EH10 (Morningside, Fairmilehead) | +2.7% | +3.5% | +10.2% |
| EH4 (Blackhall, Cramond) | -0.5% | -0.5% | +9.5% |
| EH9 (Marchmont, Grange) | +0.7% | -0.2% | +8.0% |
| EH5 (Granton, Trinity) | -0.2% | -7.5% | +5.7% |
| EH3 (Stockbridge, Inverleith) | +4.3% | -8.3% | -0.8% |
| EH2 (New Town) | -5.0% | -5.1% | -6.9% |
| EH28 (Ratho) | -19.7% | -15.4% | -19.8% |
| EH27 (Kirknewton) | Not enough data | Not enough data | Not enough data |
The strongest 5-year growth sits in Edinburgh's outer postcodes. EH16 (Liberton, Cameron Toll) at +24.9%, EH29 (Kirkliston) at +24.0%, and EH30 (South Queensferry) at +22.8% all started from lower price bases. An investor who bought at the average asking price in EH16 five years ago would have seen roughly £49,000 in capital growth on paper.
Edinburgh's premium postcodes show flat or negative 3-year growth. EH3 (Stockbridge, Inverleith) is down 8.3% over three years, EH2 (New Town) is down 5.1%, and EH9 (Marchmont, Grange) is flat at -0.2%. These are high-value, low-volume postcodes where individual sales of premium properties can swing the average. The pattern suggests the premium end of Edinburgh's market corrected after the pandemic surge while the affordable outer postcodes continued rising.
EH28 (Ratho) shows steep negative growth across all three periods. With only 5 sales per month, single transactions have an outsized impact on the figures.
Monthly Property Sales in Edinburgh
Three postcodes dominate Edinburgh's sales volume: EH12 (Corstorphine, Murrayfield) at 97 per month, EH4 (Blackhall, Cramond) at 94, and EH11 (Gorgie, Dalry) at 86. Together they account for nearly a third of the city's total transaction volume. Turnover rates above 100% in EH11, EH7, and EH14 indicate higher proportions of investor-owned stock changing hands.
| Area | Sales Per Month | Turnover | Asking Price |
|---|---|---|---|
| EH12 (Corstorphine, Murrayfield) | 97 | 66% | £363,592 |
| EH4 (Blackhall, Cramond) | 94 | 53% | £392,551 |
| EH11 (Gorgie, Dalry) | 86 | 149% | £205,750 |
| EH6 (Leith) | 83 | 78% | £230,124 |
| EH7 (Leith Walk, Restalrig) | 78 | 135% | £252,105 |
| EH21 (Musselburgh) | 61 | 98% | £281,897 |
| EH10 (Morningside, Fairmilehead) | 60 | 115% | £416,718 |
| EH3 (Stockbridge, Inverleith) | 56 | 79% | £417,854 |
| EH14 (Currie, Balerno) | 55 | 135% | £278,714 |
| EH16 (Liberton, Cameron Toll) | 46 | 112% | £245,531 |
| EH15 (Portobello, Duddingston) | 42 | 208% | £288,026 |
| EH5 (Granton, Trinity) | 38 | 72% | £249,707 |
| EH9 (Marchmont, Grange) | 33 | 50% | £442,188 |
| EH17 (Gilmerton) | 31 | 70% | £292,323 |
| EH8 (Newington, Southside) | 29 | 60% | £264,464 |
| EH13 (Colinton, Oxgangs) | 22 | 63% | £324,355 |
| EH30 (South Queensferry) | 16 | 26% | £310,801 |
| EH1 (Old Town, New Town) | 12 | 73% | £361,429 |
| EH29 (Kirkliston) | 8 | 42% | £306,429 |
| EH28 (Ratho) | 5 | 125% | Not enough data |
| EH2 (New Town) | 4 | 40% | £474,923 |
| EH27 (Kirknewton) | Not enough data | Not enough data | Not enough data |
EH15 (Portobello, Duddingston) has the highest turnover at 208%. This coastal postcode has 42 sales per month relative to a smaller total housing stock, suggesting frequent resale activity. EH11 (Gorgie, Dalry) and EH7 (Leith Walk, Restalrig) also show turnovers above 130%, typical of areas with high proportions of buy-to-let flats.
EH30 (South Queensferry) has the lowest turnover at 26%. Combined with just 16 sales per month and asking prices of £310,801, this postcode has the characteristics of an owner-occupier market with limited investor activity.
The bottom of the table highlights Edinburgh's low-volume postcodes. EH2 (New Town) at 4 sales per month and EH28 (Ratho) at 5 are too thin for reliable growth or yield analysis.
Property Data Sources
Our location guide relies on diverse, authoritative datasets including:
- UK House Price Index
- Ministry of Housing, Communities and Local Government
- Ordnance Survey Data Hub
- Propertydata.co.uk
We update our property data quarterly to ensure accuracy. Last update: April 2026. All data is presented as provided by our sources without adjustments or amendments.

Edinburgh Rental Market Analysis
Edinburgh's monthly rents range from £1,074 in EH11 (Gorgie, Dalry) to £1,731 in EH3 (Stockbridge, Inverleith), and gross yields range from 4.0% to 6.6% across the 12 postcodes with rental data. For investors weighing up whether rental property is a worthwhile investment in Edinburgh, the data below breaks down average monthly rents and gross rental yields across the city's postcodes.
If you are looking to build a property portfolio in Scotland, Edinburgh's combination of capital-city wage levels and a deep tenant pool of students, young professionals, and public sector workers generates consistent rental demand.
Average Rent & Gross Rental Yields in Edinburgh
EH6 (Leith) and EH8 (Newington, Southside) share Edinburgh's top gross yield at 6.6%. Both combine asking prices below £265,000 with monthly rents above £1,270. At the other end, EH9 (Marchmont, Grange) at 4.0% has rents of £1,474 per month but asking prices of £442,188 compress the yield. The table below ranks all 22 postcodes by gross rental yield.
| Area | Average Rent (Monthly) | Asking Price | Gross Yield |
|---|---|---|---|
| EH6 (Leith) | £1,274 | £230,124 | 6.6% |
| EH8 (Newington, Southside) | £1,452 | £264,464 | 6.6% |
| EH16 (Liberton, Cameron Toll) | £1,306 | £245,531 | 6.4% |
| EH11 (Gorgie, Dalry) | £1,074 | £205,750 | 6.3% |
| EH7 (Leith Walk, Restalrig) | £1,298 | £252,105 | 6.2% |
| EH5 (Granton, Trinity) | £1,282 | £249,707 | 6.2% |
| EH1 (Old Town, New Town) | £1,671 | £361,429 | 5.5% |
| EH3 (Stockbridge, Inverleith) | £1,731 | £417,854 | 5.0% |
| EH12 (Corstorphine, Murrayfield) | £1,460 | £363,592 | 4.8% |
| EH4 (Blackhall, Cramond) | £1,525 | £392,551 | 4.7% |
| EH10 (Morningside, Fairmilehead) | £1,603 | £416,718 | 4.6% |
| EH9 (Marchmont, Grange) | £1,474 | £442,188 | 4.0% |
| EH2 (New Town) | Not enough data | £474,923 | Not enough data |
| EH13 (Colinton, Oxgangs) | Not enough data | £324,355 | Not enough data |
| EH14 (Currie, Balerno) | Not enough data | £278,714 | Not enough data |
| EH15 (Portobello, Duddingston) | Not enough data | £288,026 | Not enough data |
| EH17 (Gilmerton) | Not enough data | £292,323 | Not enough data |
| EH21 (Musselburgh) | Not enough data | £281,897 | Not enough data |
| EH27 (Kirknewton) | Not enough data | Not enough data | Not enough data |
| EH28 (Ratho) | Not enough data | Not enough data | Not enough data |
| EH29 (Kirkliston) | Not enough data | £306,429 | Not enough data |
| EH30 (South Queensferry) | Not enough data | £310,801 | Not enough data |
The yield data splits cleanly into two tiers. Six postcodes return 6.0% or above: EH6, EH8, EH16, EH11, EH7, and EH5. All are priced below £265,000 and sit in areas with strong tenant demand from young professionals and students. The remaining six postcodes with yield data return between 4.0% and 5.5%, with asking prices above £360,000.
EH8 (Newington, Southside) at 6.6% offers the highest monthly rent of the top-yield postcodes at £1,452. This postcode sits directly south of the Old Town, between the University of Edinburgh's main campus and the Royal Infirmary. Its tenant pool draws from students, medical professionals, and young professionals working in the city centre.
Ten postcodes have no rental data. These are predominantly outer or suburban postcodes (EH13, EH14, EH15, EH17, EH21, EH27, EH28, EH29, EH30) plus the low-volume EH2 in the city centre. The absence of rental data does not mean these areas lack rental demand. It indicates insufficient data to calculate a reliable average from current listings.
Is Edinburgh Rent High?
Rent affordability is measured as average monthly rent divided by the median gross monthly salary. Edinburgh rents range from 29.8% of median income in EH11 (Gorgie, Dalry) to 48.1% in EH3 (Stockbridge, Inverleith).
The median gross weekly salary in Edinburgh is £830.20, which equates to £3,598 per month or £43,169 per year. This is above the Scotland regional median of £767.40 per week and the Great Britain median of £752.40 per week. Data from the Nomis Labour Market Profile (ASHE 2025).
| Rank | Area | Rent as % of Income |
|---|---|---|
| 1 | EH3 (Stockbridge, Inverleith) | 48.1% |
| 2 | EH1 (Old Town, New Town) | 46.4% |
| 3 | EH10 (Morningside, Fairmilehead) | 44.6% |
| 4 | EH4 (Blackhall, Cramond) | 42.4% |
| 5 | EH9 (Marchmont, Grange) | 41.0% |
| 6 | EH12 (Corstorphine, Murrayfield) | 40.6% |
| 7 | EH8 (Newington, Southside) | 40.4% |
| 8 | EH16 (Liberton, Cameron Toll) | 36.3% |
| 9 | EH7 (Leith Walk, Restalrig) | 36.1% |
| 10 | EH5 (Granton, Trinity) | 35.6% |
| 11 | EH6 (Leith) | 35.4% |
| 12 | EH11 (Gorgie, Dalry) | 29.8% |
All 12 postcodes with rental data sit above 29% of median income, and six exceed 40%. Edinburgh is an expensive rental city relative to earnings. The most affordable renting is in EH11 (Gorgie, Dalry) where £1,074 per month takes 29.8% of median gross income. The premium core (EH3, EH1, EH10) all exceed 44%.
For investors, high rent-to-income ratios signal that tenants in the premium postcodes tend to be higher earners, dual-income households, or professional sharers. The lower-ratio postcodes (EH11, EH6, EH5) draw from a broader tenant pool including students and younger workers, which typically means faster lettings but potentially higher turnover.
Thinking of Buying?
We have off-market investment properties averaging 8%+ annual yield.
View Property DealsBuy-to-Let Considerations
Are House Prices High? Price-to-Earnings Ratios
A property in Edinburgh costs between 4.8 and 11.0 times the median annual salary. This is based on the Nomis Labour Market Profile for Edinburgh showing the median gross annual income for Edinburgh residents is £43,169.
| Rank | Area | Price-to-Earnings Ratio |
|---|---|---|
| 1 | EH11 (Gorgie, Dalry) | 4.8 |
| 2 | EH6 (Leith) | 5.3 |
| 3 | EH16 (Liberton, Cameron Toll) | 5.7 |
| 4 | EH5 (Granton, Trinity) | 5.8 |
| 5 | EH7 (Leith Walk, Restalrig) | 5.8 |
| 6 | EH8 (Newington, Southside) | 6.1 |
| 7 | EH14 (Currie, Balerno) | 6.5 |
| 8 | EH21 (Musselburgh) | 6.5 |
| 9 | EH15 (Portobello, Duddingston) | 6.7 |
| 10 | EH17 (Gilmerton) | 6.8 |
| 11 | EH29 (Kirkliston) | 7.1 |
| 12 | EH30 (South Queensferry) | 7.2 |
| 13 | EH13 (Colinton, Oxgangs) | 7.5 |
| 14 | EH1 (Old Town, New Town) | 8.4 |
| 15 | EH12 (Corstorphine, Murrayfield) | 8.4 |
| 16 | EH4 (Blackhall, Cramond) | 9.1 |
| 17 | EH10 (Morningside, Fairmilehead) | 9.7 |
| 18 | EH3 (Stockbridge, Inverleith) | 9.7 |
| 19 | EH9 (Marchmont, Grange) | 10.2 |
| 20 | EH2 (New Town) | 11.0 |
| - | EH27 (Kirknewton) | Not enough data |
| - | EH28 (Ratho) | Not enough data |
EH11 (Gorgie, Dalry) at 4.8 times median earnings is Edinburgh's most affordable postcode relative to local salaries. EH6 (Leith) at 5.3 and EH16 (Liberton, Cameron Toll) at 5.7 also sit below 6.0 times. These are the same postcodes that deliver the city's highest yields, creating a cluster where affordability and income potential align.
Edinburgh's premium postcodes sit well above the historical UK average of around 7-8 times earnings. EH2 (New Town) at 11.0 times and EH9 (Marchmont, Grange) at 10.2 times are priced at levels that require significantly above-average incomes or substantial deposits. Seven postcodes exceed 7.0 times earnings.
Deposit Requirements in Edinburgh
All deposits below are calculated at 30% of the asking price. Edinburgh's 30% deposits range from £61,725 in EH11 (Gorgie, Dalry) to £142,477 in EH2 (New Town). For detailed information on transaction costs in Scotland, see our guide to stamp duty in Scotland (LBTT). You can also read about buy-to-let costs to understand the full picture.
| Rank | Area | 30% Deposit Required |
|---|---|---|
| 1 | EH11 (Gorgie, Dalry) | £61,725 |
| 2 | EH6 (Leith) | £69,037 |
| 3 | EH16 (Liberton, Cameron Toll) | £73,659 |
| 4 | EH5 (Granton, Trinity) | £74,912 |
| 5 | EH7 (Leith Walk, Restalrig) | £75,632 |
| 6 | EH8 (Newington, Southside) | £79,339 |
| 7 | EH14 (Currie, Balerno) | £83,614 |
| 8 | EH21 (Musselburgh) | £84,569 |
| 9 | EH15 (Portobello, Duddingston) | £86,408 |
| 10 | EH17 (Gilmerton) | £87,697 |
| 11 | EH29 (Kirkliston) | £91,929 |
| 12 | EH30 (South Queensferry) | £93,240 |
| 13 | EH13 (Colinton, Oxgangs) | £97,307 |
| 14 | EH1 (Old Town, New Town) | £108,429 |
| 15 | EH12 (Corstorphine, Murrayfield) | £109,078 |
| 16 | EH4 (Blackhall, Cramond) | £117,765 |
| 17 | EH10 (Morningside, Fairmilehead) | £125,015 |
| 18 | EH3 (Stockbridge, Inverleith) | £125,356 |
| 19 | EH9 (Marchmont, Grange) | £132,656 |
| 20 | EH2 (New Town) | £142,477 |
| — | EH27 (Kirknewton) | Not enough data |
| — | EH28 (Ratho) | Not enough data |
The £80,752 gap between Edinburgh's cheapest and most expensive 30% deposits illustrates the scale of the city's two-tier market. Six postcodes require a 30% deposit below £80,000: EH11, EH6, EH16, EH5, EH7, and EH8. These are the same postcodes that produce the highest yields, creating a straightforward relationship between lower entry cost and stronger income returns.
At the premium end, four postcodes need a 30% deposit above £120,000: EH10, EH3, EH9, and EH2. Investors targeting these areas are typically looking for capital growth and tenant quality over yield, accepting returns of 4.0% to 5.0% in exchange for lower management intensity. For alternative entry routes, see our guides to repossessed houses for sale and investment property with no deposit.

What the Edinburgh Data Tells Buy-to-Let Investors
Six postcodes priced below £265,000 produce Edinburgh's highest yields: EH6 (Leith) at 6.6%, EH8 (Newington) at 6.6%, EH16 (Liberton) at 6.4%, EH11 (Gorgie) at 6.3%, EH7 (Leith Walk) at 6.2%, and EH5 (Granton) at 6.2%. A 30% deposit in these postcodes ranges from £61,725 to £79,339. Tenant demand in these areas draws from students, young professionals, and public sector workers employed across Edinburgh's universities, hospitals, and financial services firms.
The strongest 5-year capital growth sits in Edinburgh's outer postcodes: EH16 at +24.9%, EH29 at +24.0%, EH30 at +22.8%, and EH21 at +22.4%. EH16 stands out as the only postcode that appears in both the top yield tier (6.4%) and the top growth tier (24.9% over five years). The Edinburgh BioQuarter expansion sits within the EH16 catchment, adding a long-term infrastructure dimension to the postcode's data profile.
Edinburgh's premium core (EH2, EH3, EH9, EH10) shows flat or negative 3-year growth and yields between 4.0% and 5.0%. EH3 (Stockbridge) is down 8.3% over three years despite commanding Edinburgh's highest rents at £1,731 per month. EH2 (New Town) at 4 sales per month and EH28 (Ratho) at 5 sales per month produce volatile data that is less reliable for investment analysis.
Scotland operates a different regulatory framework for buy-to-let properties. Private Residential Tenancies replaced the English Assured Shorthold Tenancy model, and Edinburgh uses LBTT (Land and Buildings Transaction Tax) rather than Stamp Duty. The selective licensing schemes page covers the latest landlord registration requirements across the UK. Browse current investment property listings or explore off-market property opportunities.
How Edinburgh Compares
Edinburgh's mean asking price of £319,974 is the highest of the five cities in this comparison. Glasgow at £180,998, Dundee at £201,050, and Aberdeen at £156,439 all offer significantly lower entry points. Newcastle at £253,549 sits between Edinburgh and the other Scottish cities.
| Location | Mean Asking Price | Mean Monthly Rent | Top Gross Yield |
|---|---|---|---|
| Edinburgh | £319,974 | £1,429 | 6.6% |
| Glasgow | £180,998 | £1,046 | 10.3% |
| Aberdeen | £156,439 | £807 | 8.6% |
| Dundee | £201,050 | £799 | 7.0% |
| Newcastle | £253,549 | £1,176 | 9.7% |
Edinburgh has the highest mean rent of the five cities at £1,429 per month, but its top gross yield of 6.6% is the lowest. Glasgow at 10.3% and Newcastle at 9.7% both offer substantially higher headline yields, driven by lower asking prices rather than higher rents. Edinburgh's premium pricing compresses yields even in its most affordable postcodes.
Dundee's top yield of 7.0% sits closest to Edinburgh's 6.6%, but the cities operate in different price brackets. Dundee's mean asking price of £201,050 is 37% lower than Edinburgh's £319,974. Aberdeen at £156,439 is the cheapest of the five, though its market remains influenced by North Sea oil and gas sector cycles.
For investors comparing Scottish cities, Glasgow offers the highest yields at significantly lower prices. Aberdeen provides the lowest entry point. Dundee sits between the two on price. Newcastle crosses the border into England with the second-highest yields at 9.7%.
Edinburgh's data profile combines higher rents and stronger wage fundamentals with lower headline yields. See our full guide to the best buy-to-let locations across the UK.
Frequently Asked Questions
What are the best buy-to-let areas in Edinburgh?
Six Edinburgh postcodes produce gross rental yields above 6.0%: EH6 (Leith) at 6.6%, EH8 (Newington, Southside) at 6.6%, EH16 (Liberton, Cameron Toll) at 6.4%, EH11 (Gorgie, Dalry) at 6.3%, EH7 (Leith Walk, Restalrig) at 6.2%, and EH5 (Granton, Trinity) at 6.2%. These postcodes are all priced below £265,000 with 30% deposits ranging from £61,725 to £79,339. EH16 also leads on 5-year capital growth at 24.9%. The premium postcodes (EH2, EH3, EH9, EH10) have higher rents but yields between 4.0% and 5.0% due to asking prices above £400,000.
How does Edinburgh compare to Glasgow for property investment?
Glasgow's mean asking price of £180,998 is 43% lower than Edinburgh's £319,974, and Glasgow's top gross yield of 10.3% is significantly higher than Edinburgh's 6.6%. Edinburgh's mean monthly rent of £1,429 exceeds Glasgow's £1,046, but the lower purchase prices in Glasgow produce stronger yield figures. Edinburgh's median annual salary of £43,169 is higher than Glasgow's, and Edinburgh's UK House Price Index data shows 5.4% annual price growth compared to the Scottish average of 4.9%. Each city has a different data profile: Glasgow for yield, Edinburgh for rent levels and wage fundamentals.
Is Edinburgh affected by Scottish landlord regulations?
Scotland operates a different tenancy framework from England and Wales. Private Residential Tenancies (PRTs) replaced the Short Assured Tenancy in December 2017, giving tenants open-ended contracts with no fixed end date. Landlords must register with the local authority and meet the Repairing Standard for property condition. Edinburgh also uses LBTT (Land and Buildings Transaction Tax) instead of Stamp Duty, with different rate bands and an Additional Dwelling Supplement for second properties. Edinburgh's rental market remains active despite these requirements, with 12 of 22 postcodes reporting rental data and monthly rents ranging from £1,074 to £1,731.
What is the student rental market like in Edinburgh?
Edinburgh has four universities with a combined student population that creates consistent demand for rental accommodation across multiple postcodes. The University of Edinburgh has approximately 45,000 students, with Edinburgh Napier University, Heriot-Watt University, and Queen Margaret University adding further numbers. The combined student population creates consistent demand for rental accommodation, particularly in EH8 (Newington, next to the University of Edinburgh's main campus), EH3 (Stockbridge), and EH1 (Old Town). EH8 delivers a 6.6% gross yield with an average rent of £1,452 per month. Student lets in Edinburgh typically carry seasonal void periods during summer months. For more on this sector, see our guide to purpose-built student accommodation.
How has Edinburgh recovered from past house price crashes?
Edinburgh's most recent crash ran from September 2007 to March 2009, with prices falling 18.9% from £195,921 to £158,844. The recovery took seven and a half years, with prices passing the pre-crash peak in March 2015. Edinburgh's decline of 18.9% was slightly steeper than the Scottish average of 17.5%. A secondary dip between 2010 and 2013 extended the flat period. Since the recovery, Edinburgh has delivered consistent growth: 47.3% over the past 10 years and 18.7% over the past 5 years. The latest December 2025 reading of £293,243 represents 5.4% annual growth.
What impact will Edinburgh's regeneration projects have on property prices?
Edinburgh has over £5 billion in active regeneration programmes across three major projects. Granton Waterfront (£1.3 billion, 3,500 homes) sits in the EH5 catchment where current asking prices are £249,707. West Town Edinburgh (£2 billion, 7,000 homes) is in west Edinburgh near the Gogar Roundabout. The proposed tram extension from Granton to BioQuarter (£2 to £2.9 billion) would connect the regeneration zones with Edinburgh's southern postcodes including EH16 (Liberton), which already leads on both yield (6.4%) and 5-year growth (24.9%). New housing supply could moderate price growth in affected postcodes, while improved transport links and amenities tend to support rental demand. The timeline for these projects spans 2026 to 2033 and beyond.
What is it like buying a flat in Edinburgh?
Flats and tenement conversions make up the majority of Edinburgh's housing stock and account for most buy-to-let purchases. Edinburgh flats average £238,397, which is 8.7% above the England average of £219,340. Asking prices for flats range from £205,750 in EH11 (Gorgie, Dalry) to above £400,000 in premium postcodes like EH3 and EH9. The highest-yielding postcodes (EH6 at 6.6%, EH8 at 6.6%, EH16 at 6.4%) are dominated by flat stock.
Edinburgh uses a sealed-bid system rather than the English offer process, and buyers typically need a Home Report before marketing. Scotland's Private Residential Tenancy framework applies to all rental properties.
What are the best areas to stay in Edinburgh?
Edinburgh's 22 postcodes split into distinct profiles depending on whether the priority is rental yield, capital growth, or rent affordability. For gross rental yield, EH6 (Leith) and EH8 (Newington, Southside) lead at 6.6% each, with monthly rents of £1,274 and £1,452 respectively. For 5-year capital growth, EH16 (Liberton, Cameron Toll) leads at +24.9%, followed by EH29 (Kirkliston) at +24.0%.
For the highest monthly rents, EH3 (Stockbridge, Inverleith) at £1,731 and EH1 (Old Town) at £1,671 top the list, though yields here sit between 5.0% and 5.5%. EH11 (Gorgie, Dalry) has the lowest price-to-earnings ratio at 4.8 times median salary.