Where to Buy Property Investments in Milton Keynes: Yields of 6.7%
Milton Keynes gross rental yields range from 3.4% to 6.7% across postcodes with rental data, with MK9 delivering the highest returns. Average sold prices sit 12.6% above the England average but 13.2% below the South East regional average, and the city's population grew 15.37% to 287,060 between the 2011 and 2021 censuses.
Milton Keynes average sold price of £328,697 positions it as one of the most affordable unitary authorities in the South East for buy-to-let investors. That is 13.2% below the South East regional average of £378,800, creating entry points that most South East locations cannot match. Asking prices start from £228,292 in MK9, and rental data is available for 17 of the city's 20 postcodes with PropertyData coverage.
This guide covers all 22 Milton Keynes postcodes from MK1 to MK46. Milton Keynes is a unitary authority in Buckinghamshire, South East England (ONS code E06000042), roughly equidistant between London, Birmingham, Oxford, and Cambridge. Investors comparing options in the region may also consider Luton, Northampton, Oxford, or Reading. Browse all our South East location guides.
Article updated: March 2026
Milton Keynes Buy-to-Let Market Overview 2026
Milton Keynes offers South East affordability backed by a diversified economy, strong population growth, and new transport connections via East West Rail.
- Average sold price: £328,697 (12.6% above England's £291,865, 13.2% below South East's £378,800)
- Asking price range: £228,292 (MK9) to £551,752 (MK17)
- Rental yields: 3.4% (MK46) to 6.7% (MK9) across postcodes with rental data
- Rental income: Monthly rents from £1,215 (MK6) to £1,690 (MK8)
- Price per sq ft: Sold prices from £296/sq ft (MK6) to £424/sq ft (MK9)
- Market activity: Sales ranging from 5 per month (MK15) to 38 per month (MK43)
- Deposit requirements: 30% deposits range from £68,488 (MK9) to £165,526 (MK17)
- Affordability ratios: Property prices from 5.5 to 13.3 times Milton Keynes median annual salary of £41,389
Contents

-
by Robert Jones, Founder of Property Investments UK
With two decades in UK property, Rob has been investing in buy-to-let since 2005, and uses property data to develop tools for property market analysis.

Property Data Sources
Our location guide relies on diverse, authoritative datasets including:
- HM Land Registry UK House Price Index
- Ministry of Housing, Communities and Local Government
- Ordnance Survey Data Hub
- Propertydata.co.uk
We update our property data quarterly to ensure accuracy. Last update: March 2026. All data is presented as provided by our sources without adjustments or amendments.
Why Invest in Milton Keynes?
Milton Keynes was designated as a new town in 1967 and has since grown to a population of 287,060 (up 15.37% from 2011), making it one of the fastest-growing unitary authorities in England. The grid road system, purpose-built estates, and mix of employment zones created a city that attracts corporate headquarters, technology firms, and logistics operators. Santander UK runs its national operations from MK9. Network Rail moved its national centre here. Red Bull Racing is based in MK7. That concentration of white-collar and technical employment underpins rental demand across the city.
The Open University has been headquartered in Milton Keynes since 1969 and is one of the largest employers in the borough. Cranfield University, a postgraduate-only institution specialising in aerospace and management, sits in the MK43 postcode. Neither generates the concentrated student rental demand of a traditional university city, but both contribute to a skilled local workforce.
Between the 2011 and 2021 censuses, Milton Keynes population grew from 248,821 to 287,060, a rise of 15.37%. That is one of the fastest growth rates among English unitary authorities. The city has been absorbing population from London and the wider South East for decades, and the arrival of East West Rail services connecting Milton Keynes to Oxford (and eventually Cambridge) is expected to accelerate that pattern.
Earnings in Milton Keynes sit slightly below the South East regional median but above the national figure. The median annual salary is £41,389, compared to £41,616 across the South East and £39,125 for Great Britain. Higher local wages support higher rents, which is one reason Milton Keynes yields hold up despite asking prices sitting above the England average.
Milton Keynes University Hospital is the city's major acute hospital, serving a growing catchment population. The hospital, logistics parks around junction 13 and 14 of the M1, and the expanding tech sector all provide diverse employment sources that reduce dependence on any single industry.
Milton Keynes Economic Summary
- Population: 287,060 (2021 Census). Growth of 15.37% from 2011.
- Median annual salary: £41,389 (Milton Keynes), £41,616 (South East), £39,125 (Great Britain)
- Employment rate: 79.6% (Milton Keynes), 78.7% (South East), 75.6% (Great Britain)
- Unemployment rate: 5.2% (Milton Keynes), 3.5% (South East), 4.3% (Great Britain)
- Key employment sectors: Financial services, technology, logistics, higher education, healthcare, motorsport engineering
Source: ONS Census 2021, Nomis Labour Market Profile (ASHE 2025, Employment Oct 2024-Sep 2025)
Milton Keynes employment rate of 79.6% sits above both the South East average of 78.7% and the national 75.6%. But the unemployment rate of 5.2% is higher than the South East's 3.5% and the national 4.3%. That combination suggests a city with strong workforce participation alongside a more active labour market, with people moving in and between jobs rather than sitting outside the workforce entirely. For buy-to-let investors, the high employment rate is the figure that matters most.
Source: Office for National Statistics - Population for Milton Keynes
Regeneration and Investment in Milton Keynes
Over £2.5 billion in infrastructure investment is either under construction or committed in Milton Keynes, covering rail connectivity, 40,000 new homes, and estate regeneration. East West Rail, a new town partnership with seven major developers, and council-led housing programmes are all in progress.
- East West Rail (passenger services expected 2026, £2.5bn+ committed for future stages): A new rail line connecting Oxford to Milton Keynes Central via Bletchley, with infrastructure complete and Chiltern Railways named as operator. For investors, direct rail links to Oxford and eventually Cambridge transform Milton Keynes from an M1 corridor town into a multi-city commuter hub. Updates at GOV.UK.
- Milton Keynes New Town Partnership (signed February 2026, 40,000 homes): Milton Keynes City Council signed a partnership with seven major developers including Berkeley, Taylor Wimpey, and Urban&Civic for a multi-decade programme covering three growth areas. The scale signals long-term institutional confidence in the city's growth trajectory. Updates at Milton Keynes City Council.
- Lakes Estate Regeneration, Bletchley (under construction, £85m): A council-led programme replacing ageing housing with nearly 600 new energy-efficient homes across two phases, funded by £70m from Milton Keynes City Council and £15m from Homes England. Phase A (183 homes) is due for completion by summer 2026. Updates at Milton Keynes City Council.

Milton Keynes Property Market Analysis
When Was the Last House Price Crash in Milton Keynes?
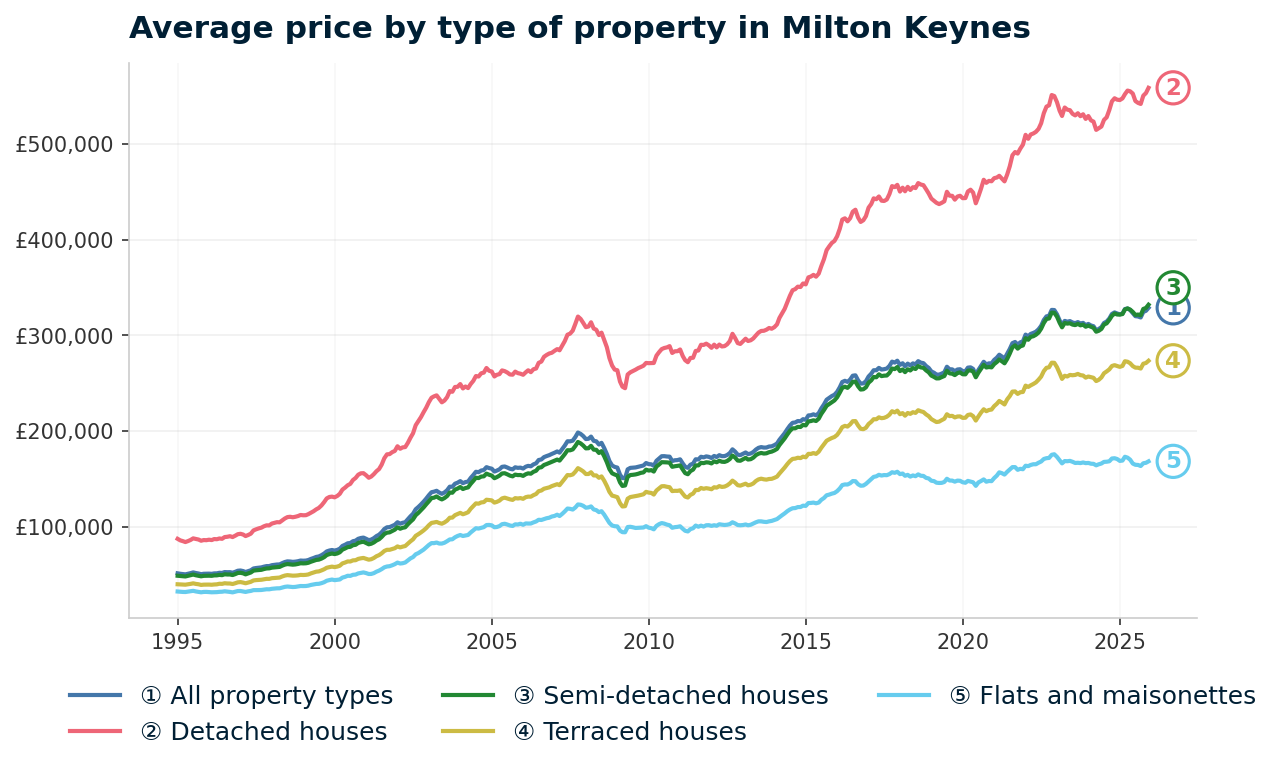
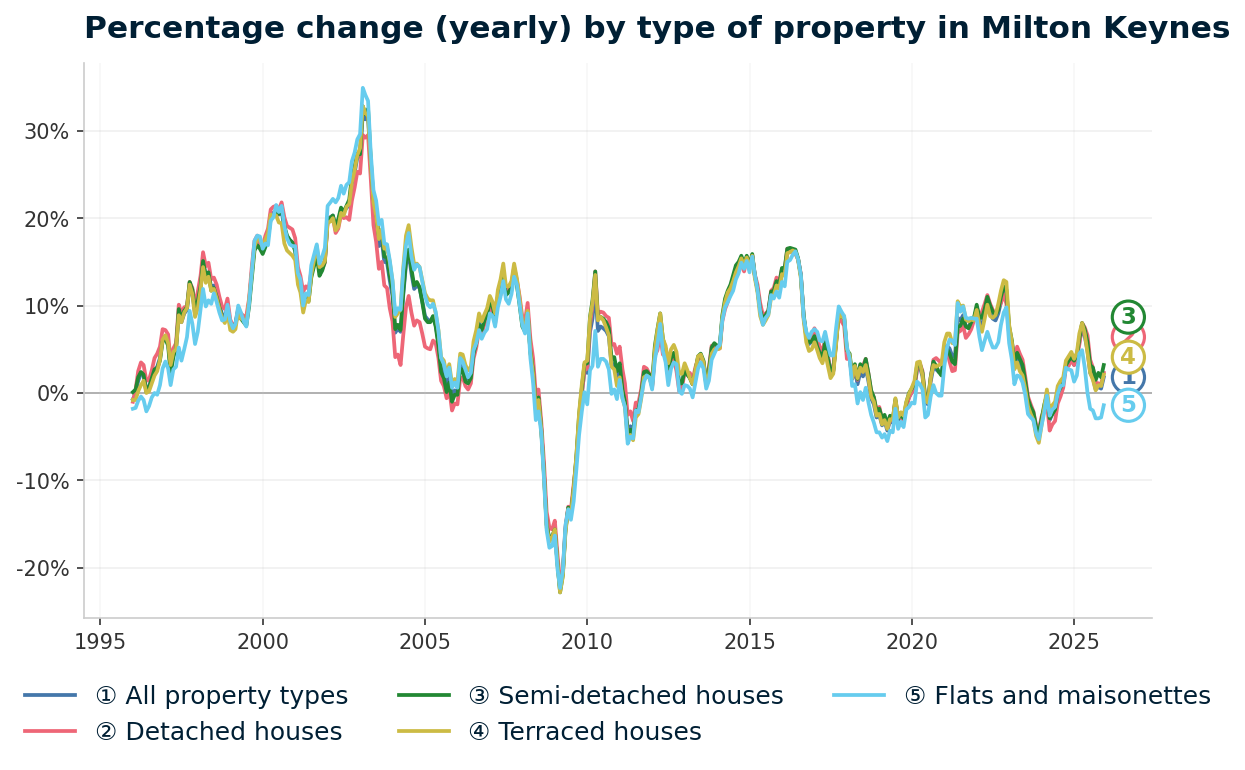
From £51,039 in January 1995 to £328,697 in December 2025, Milton Keynes property prices have risen 544% with one major crash of 24.1% between October 2007 and April 2009. The full HM Land Registry House Price Index history shows a boom driven by London overspill, a crash that hit harder than the national average, and a pandemic-era surge.
- 1995-2000 (Early growth): Milton Keynes began 1995 at £51,039. New town development was still filling out estates and attracting first-time buyers from London. By January 2000, prices had reached £74,827. That is 46.6% growth in five years, outpacing much of the South East as the new town's infrastructure matured and the M1 corridor became a genuine commuter belt.
- 2000-2007 (The boom): Prices nearly tripled from £74,827 in January 2000 to a peak of £198,275 in October 2007. The sharpest growth came in 2002-2003, when annual change exceeded 27%. Cheap credit, London overspill demand, and expanding corporate employment in the city centre combined to push prices well beyond what local wages could support.
- 2007-2009 (The financial crisis): From the peak of £198,275 in October 2007 to the trough of £150,567 in April 2009, Milton Keynes lost 24.1% of its value in 18 months. The worst annual change reading was -22.4% in March 2009. All property types fell almost equally: detached -23.5%, semi-detached -24.2%, terraced -24.7%, flats -23.6%. Milton Keynes decline of 24.1% was worse than England overall (-18.2%) and worse than the South East region (-20.0%). The new town's dependence on new-build stock and stretched affordability ratios made it more vulnerable than established cities.
- 2009-2013 (Recovery begins): Prices bounced from the April 2009 trough but took years to recover fully. By December 2013, the average sat at £183,855. That was still 7.3% below the pre-crash peak. Growth was steady but unremarkable, driven by returning London commuter demand as the capital's own prices pulled further out of reach.
Recovery, Pandemic Surge, and Rate Shock: 2014-2025
- 2014-2016 (Full recovery): Growth accelerated sharply. Annual changes of 10-14% between 2014 and 2016 reflected the London affordability crisis pushing buyers and renters northward along the M1. Prices finally passed the pre-crash peak in June 2014 at £201,825. That recovery took 6 years and 8 months from the October 2007 peak. Faster than Plymouth (8 years) but slightly slower than London and the inner South East.
- 2017-2019 (Plateau): Growth slowed after the rapid catch-up. Prices rose from £256,890 in January 2017 to £264,485 by December 2019. Annual change turned briefly negative in late 2019 (-0.5%). The stamp duty surcharge introduced in 2016 cooled investor demand, and Milton Keynes new-build supply was absorbing some of the excess.
- 2020-2022 (Pandemic surge): The stamp duty holiday and the remote working shift drove rapid appreciation. Prices jumped from £266,146 in March 2020 to £326,376 by December 2022. That is 22.6% growth in under three years. Milton Keynes benefited from the same lifestyle relocation trend as other M1 corridor towns, with buyers seeking more space and lower costs than London.
- 2023 (Rate shock): Interest rate rises cooled the market. Prices dipped from £326,376 in December 2022 to £310,590 by December 2023. A decline of 4.8%. Sharper than the national average but brief.
- 2024-2025 (Recovery): Prices stabilised and rose again. By December 2025, the average reached £328,697 with annual growth of 1.8%. Milton Keynes now sits 65.8% above its pre-crash peak.
Long-Term Property Value Growth in Milton Keynes
- 5 years (2020-2025): +21.5% (£270,540 to £328,697)
- 10 years (2015-2025): +38.2% (£237,811 to £328,697)
- 15 years (2010-2025): +94.0% (£169,449 to £328,697)
- 20 years (2005-2025): +103.4% (£161,584 to £328,697)
- 30 years (1995-2025): +549.8% (£50,588 to £328,697)
Source: HM Land Registry House Price Index for Milton Keynes, January 1995 to December 2025.
The 2008 crash is the reference point for Milton Keynes investors assessing downside risk. A 24.1% decline took nearly 7 years to recover. That is a steeper fall and longer recovery than the national average.
But Milton Keynes in 2026 is a different proposition. East West Rail did not exist in 2007. The New Town Partnership was not signed. Population growth of 15.37% over the past decade has deepened the buyer and tenant pool. The risk profile has shifted, even if property prices are never guaranteed.
Source: HM Land Registry House Price Index for Milton Keynes
Thinking of Buying?
We have off-market investment properties averaging 8%+ annual yield.
View Property DealsSold House Prices in Milton Keynes
Milton Keynes sits in unusual territory for a PIUK location guide. The headline figure of £328,697 is 12.6% above England's £291,865. Most cities featured on this site sit below the national average. Milton Keynes does not. But it sits 13.2% below the South East's £378,800, and that regional discount is where the investor angle lies. The only property type trading below the England average is flats.
Flats in Milton Keynes average £168,128. That is 23.3% below the England average of £219,340. It is the only property type where Milton Keynes undercuts the national market. The gap reflects a mix of purpose-built new town apartment stock, ex-local authority flats in central estates, and limited premium development compared to cities like Reading or Oxford.
| Property Type | Milton Keynes Average | England Average | Difference |
|---|---|---|---|
| Detached houses | £558,795 | £471,667 | +18.5% |
| Semi-detached houses | £331,961 | £289,135 | +14.8% |
| Terraced houses | £273,333 | £244,830 | +11.6% |
| Flats and maisonettes | £168,128 | £219,340 | -23.3% |
| All property types | £328,697 | £291,865 | +12.6% |
Detached houses show the widest premium at +18.5% above England. Milton Keynes has extensive detached stock across its outer postcodes (MK17 Woburn Sands, MK46 Olney, MK16 Newport Pagnell). These are sought-after villages and small towns within the Milton Keynes boundary where detached prices reflect lifestyle demand from London commuters. The premium is driven by catchment quality and green space, not by urban land scarcity.
Semi-detached houses sit 14.8% above England at £331,961. Semis are the core family stock in Milton Keynes grid-square estates. MK3, MK4, and MK10 contain large volumes of semi-detached housing built since the 1970s. Owner-occupier demand from families moving out of London keeps semi prices above the national average, particularly in the better-connected estates near the M1.
Terraced houses average £273,333, an 11.6% premium. The narrowest above-England gap of the three house types. Terraced stock in Milton Keynes tends to be newer than in established cities, concentrated in planned estates rather than Victorian or Edwardian terraces. For investors, the terrace premium is the smallest, which means the yield compression from above-average prices is less pronounced.
Flats at -23.3% are the outlier and the most relevant property type for yield-focused investors. A Milton Keynes flat at £168,128 is £51,212 cheaper than the England average. Central MK flats in MK9 form the core of the rental market, and the postcode data in the sections below shows MK9 delivering the highest yield at 6.7%. The flat discount is where the numbers start to work for buy-to-let.
Property Data Sources
Our location guide relies on diverse, authoritative datasets including:
- HM Land Registry UK House Price Index
- Ministry of Housing, Communities and Local Government
- Ordnance Survey Data Hub
- Propertydata.co.uk
We update our property data quarterly to ensure accuracy. Last update: March 2026. All data is presented as provided by our sources without adjustments or amendments.
Price Per Square Foot in Milton Keynes
Milton Keynes price per square foot ranges from £296 in MK6 to £424 in MK9, a spread of £128 across 20 postcodes with data. What does space actually cost across the city? Price per square foot strips out the size bias in average asking prices and shows what you are paying for each unit of floor area.
That MK9 tops the table is counterintuitive. It has the lowest asking price in Milton Keynes (£228,292) but the highest price per square foot. The explanation is property type: MK9 Central Milton Keynes is predominantly flats and smaller units. You pay more per square foot but less in total because the properties are smaller.
| Rank | Area | Price Per Sq Ft |
|---|---|---|
| 1 | MK6 (Fishermead, Oldbrook) | £296 |
| 2 | MK12 (Wolverton) | £305 |
| 3 | MK2 (Bletchley) | £307 |
| 4 | MK14 (Great Linford, Conniburrow) | £342 |
| 5 | MK3 (Bletchley West) | £344 |
| 6 | MK13 (Bradwell, New Bradwell) | £349 |
| 7 | MK10 (Monkston, Middleton) | £359 |
| 8 | MK19 (Hanslope, Deanshanger) | £366 |
| 8 | MK43 (Cranfield) | £366 |
| 10 | MK11 (Stony Stratford) | £371 |
| 11 | MK16 (Newport Pagnell) | £380 |
| 12 | MK18 (Buckingham) | £384 |
| 13 | MK46 (Olney) | £391 |
| 14 | MK4 (Westcroft, Emerson Valley) | £392 |
| 15 | MK8 (Grange Farm, Crownhill) | £394 |
| 16 | MK5 (Shenley Brook End) | £398 |
| 17 | MK15 (Willen, Woolstone) | £399 |
| 18 | MK17 (Woburn Sands) | £403 |
| 19 | MK7 (Kents Hill, Walnut Tree) | £409 |
| 20 | MK9 (Central Milton Keynes) | £424 |
| — | MK1 (Bletchley, Denbigh) | Not enough data |
| — | MK77 (Milton Keynes Large User) | Not enough data |
The three cheapest postcodes by space cost are MK6, MK12, and MK2, all under £310 per square foot. These are the older parts of Milton Keynes. MK6 (Fishermead, Oldbrook) sits in the original new town grid close to the city centre. MK12 (Wolverton) is the pre-new-town railway settlement. MK2 (Bletchley) is the southern gateway that will benefit most directly from East West Rail.
All three also rank among the highest-yielding postcodes. Cheap space and strong yields in the same postcodes is a pattern that typically signals undervaluation relative to the wider market.
The premium tier starts at MK7 (£409) and peaks at MK9 (£424). MK7 Kents Hill and Walnut Tree contains newer, larger family homes on the eastern expansion. MK9 Central Milton Keynes is flat-dominated, which inflates the per-foot figure. Between them sits a broad mid-range cluster from MK19 (£366) to MK5 (£398) where most of Milton Keynes residential stock sits.
Figures reflect averages across all property types and ages. Individual values depend on condition, location within the postcode, and building age.
For Sale Asking Prices in Milton Keynes
MK9 Central Milton Keynes has the lowest asking price in the borough at £228,292, more than £54,000 below the next cheapest postcode. MK17 Woburn Sands sits at the top at £551,752. That is a 2.4x spread from cheapest to most expensive, reflecting the enormous geographic and housing diversity within Milton Keynes boundary.
| Rank | Area | Average Asking Price |
|---|---|---|
| 1 | MK9 (Central Milton Keynes) | £228,292 |
| 2 | MK2 (Bletchley) | £282,411 |
| 3 | MK6 (Fishermead, Oldbrook) | £286,796 |
| 4 | MK12 (Wolverton) | £310,625 |
| 5 | MK13 (Bradwell, New Bradwell) | £316,591 |
| 6 | MK11 (Stony Stratford) | £320,833 |
| 7 | MK14 (Great Linford, Conniburrow) | £342,071 |
| 8 | MK3 (Bletchley West) | £352,649 |
| 9 | MK10 (Monkston, Middleton) | £371,637 |
| 10 | MK16 (Newport Pagnell) | £399,665 |
| 11 | MK7 (Kents Hill, Walnut Tree) | £409,414 |
| 12 | MK4 (Westcroft, Emerson Valley) | £414,677 |
| 13 | MK15 (Willen, Woolstone) | £417,000 |
| 14 | MK18 (Buckingham) | £423,596 |
| 15 | MK19 (Hanslope, Deanshanger) | £446,736 |
| 16 | MK8 (Grange Farm, Crownhill) | £464,340 |
| 17 | MK43 (Cranfield) | £464,773 |
| 18 | MK46 (Olney) | £471,555 |
| 19 | MK5 (Shenley Brook End) | £494,786 |
| 20 | MK17 (Woburn Sands) | £551,752 |
| — | MK1 (Bletchley, Denbigh) | Not enough data |
| — | MK77 (Milton Keynes Large User) | Not enough data |
Three postcodes cluster below £290,000: MK9, MK2, and MK6. These are the most affordable entry points in Milton Keynes. MK9 at £228,292 is predominantly city centre flats. MK2 Bletchley is the gateway to East West Rail. MK6 Fishermead sits in the original new town grid close to the central shopping area.
For investors searching for a house to buy in Milton Keynes at or below the England average, these three postcodes offer entry despite the borough sitting above it overall. Listings for repossessed houses for sale may also appear below these averages.
The outer postcodes tell a different story. MK17 Woburn Sands (£551,752), MK5 Shenley Brook End (£494,786), and MK46 Olney (£471,555) all sit well above £450,000. These are village and small-town postcodes at the edges of the Milton Keynes boundary where lifestyle demand from commuters pushes prices into territory that compresses rental yields significantly.
The mean asking price across all 20 postcodes with data is £388,510. That figure appears in the comparison section later, where Milton Keynes is measured against Northampton, Luton, Reading, and Oxford.

House Price Growth in Milton Keynes
Five-year growth ranges from -6.7% in MK8 to +25.6% in MK7, with 16 of 22 postcodes delivering positive five-year returns (20 have growth data, 2 have no data). Four postcodes are in negative territory over five years. That divergence is wider than most locations on this site and reflects the different micro-markets within Milton Keynes boundary. An investor who bought in MK7 five years ago is sitting on 25.6% appreciation. An investor in MK8 has lost 6.7%.
| Area | 1 Year | 3 Years | 5 Years |
|---|---|---|---|
| MK7 (Kents Hill, Walnut Tree) | 3.7% | 5.5% | 25.6% |
| MK2 (Bletchley) | 20.5% | 2.8% | 21.9% |
| MK12 (Wolverton) | 0.4% | 4.5% | 21.0% |
| MK14 (Great Linford, Conniburrow) | 7.8% | 6.8% | 20.9% |
| MK10 (Monkston, Middleton) | 14.7% | 18.4% | 20.7% |
| MK6 (Fishermead, Oldbrook) | 6.1% | 10.8% | 19.4% |
| MK16 (Newport Pagnell) | 5.9% | 5.2% | 12.1% |
| MK3 (Bletchley West) | 1.3% | 1.7% | 11.4% |
| MK43 (Cranfield) | 3.4% | -2.9% | 10.4% |
| MK13 (Bradwell, New Bradwell) | 0.4% | -1.5% | 10.2% |
| MK18 (Buckingham) | -2.1% | -3.8% | 9.7% |
| MK9 (Central Milton Keynes) | -9.9% | 9.6% | 9.3% |
| MK15 (Willen, Woolstone) | -6.9% | -0.6% | 7.7% |
| MK17 (Woburn Sands) | -2.4% | 0.7% | 7.1% |
| MK4 (Westcroft, Emerson Valley) | -4.5% | -9.5% | 4.7% |
| MK46 (Olney) | -3.2% | -14.4% | 1.9% |
| MK5 (Shenley Brook End) | -16.3% | -11.0% | -1.1% |
| MK19 (Hanslope, Deanshanger) | -0.1% | -9.9% | -3.8% |
| MK11 (Stony Stratford) | 4.6% | 0.9% | -4.2% |
| MK8 (Grange Farm, Crownhill) | -15.2% | -13.9% | -6.7% |
| MK1 (Bletchley, Denbigh) | Not enough data | Not enough data | Not enough data |
| MK77 (Milton Keynes Large User) | Not enough data | Not enough data | Not enough data |
MK2 Bletchley stands out with 20.5% one-year growth. That is the highest single-year figure in the table by a significant margin. The most likely driver is East West Rail: Bletchley station is the key junction where the new Oxford line meets the existing West Coast Main Line. Markets price in infrastructure improvements before services begin, and MK2 appears to be doing exactly that.
The top six postcodes for five-year growth (MK7, MK2, MK12, MK14, MK10, MK6) are all within the core new town grid or its eastern expansion. These are the postcodes closest to employment centres, the city centre, and the M1. The outer postcodes (MK46, MK5, MK19, MK11, MK8) show weaker or negative five-year growth. The data suggests a two-speed market: the urban core appreciating, the rural and peripheral postcodes either stagnating or declining.
MK5 (-16.3% one-year) and MK8 (-15.2% one-year) show the sharpest recent declines. Both are higher-priced postcodes where the 2023 rate shock hit hardest. Properties in the £450,000-£500,000 range are more sensitive to mortgage rate changes than those in the £250,000-£300,000 bracket. The correction may represent a return to fair value rather than a structural decline.
Monthly Property Sales in Milton Keynes
Milton Keynes monthly sales range from 5 in MK15 to 38 in MK43, with a combined total of 319 transactions per month across all 20 postcodes with data. MK15 shows turnover of 167% and MK11 sits at 74%. High turnover with low volume (MK15 has just 5 sales per month) can indicate a thin market where individual transactions have outsized impact on statistics.
| Area | Sales Per Month | Turnover | Asking Price |
|---|---|---|---|
| MK43 (Cranfield) | 38 | 17% | £464,773 |
| MK18 (Buckingham) | 30 | 8% | £423,596 |
| MK3 (Bletchley West) | 27 | 22% | £352,649 |
| MK17 (Woburn Sands) | 23 | 8% | £551,752 |
| MK4 (Westcroft, Emerson Valley) | 22 | 13% | £414,677 |
| MK10 (Monkston, Middleton) | 21 | 11% | £371,637 |
| MK2 (Bletchley) | 14 | 17% | £282,411 |
| MK6 (Fishermead, Oldbrook) | 14 | 23% | £286,796 |
| MK16 (Newport Pagnell) | 14 | 7% | £399,665 |
| MK11 (Stony Stratford) | 13 | 74% | £320,833 |
| MK13 (Bradwell, New Bradwell) | 13 | 13% | £316,591 |
| MK14 (Great Linford, Conniburrow) | 13 | 15% | £342,071 |
| MK8 (Grange Farm, Crownhill) | 13 | 10% | £464,340 |
| MK7 (Kents Hill, Walnut Tree) | 12 | 22% | £409,414 |
| MK19 (Hanslope, Deanshanger) | 11 | 14% | £446,736 |
| MK5 (Shenley Brook End) | 10 | 30% | £494,786 |
| MK46 (Olney) | 10 | 18% | £471,555 |
| MK12 (Wolverton) | 9 | 14% | £310,625 |
| MK9 (Central Milton Keynes) | 7 | 5% | £228,292 |
| MK15 (Willen, Woolstone) | 5 | 167% | £417,000 |
| MK1 (Bletchley, Denbigh) | Not enough data | Not enough data | Not enough data |
| MK77 (Milton Keynes Large User) | Not enough data | Not enough data | Not enough data |
MK9 Central Milton Keynes has just 7 sales per month with 5% turnover. That is the thinnest market in the table. City centre flats in Milton Keynes are held by investors long-term or occupied by leaseholders with limited incentive to sell. If you are buying in MK9, plan for a longer hold period. Selling quickly may require accepting a discount to attract the limited pool of active buyers.
MK43 Cranfield leads on volume with 38 sales per month. It is a large postcode covering Cranfield and surrounding villages, which explains the higher absolute numbers. For exit planning, MK3 Bletchley West (27 sales, 22% turnover) and MK10 Monkston (21 sales, 11% turnover) offer the strongest combination of volume and steady market activity within the urban core.
Property Data Sources
Our location guide relies on diverse, authoritative datasets including:
- HM Land Registry UK House Price Index
- Ministry of Housing, Communities and Local Government
- Ordnance Survey Data Hub
- Propertydata.co.uk
We update our property data quarterly to ensure accuracy. Last update: March 2026. All data is presented as provided by our sources without adjustments or amendments.

Milton Keynes Rental Market Analysis
For investors weighing up whether rental property is a worthwhile investment in Milton Keynes, the data below breaks down average monthly rents and gross rental yields across the city's postcodes.
Rental data is available for 17 of 20 postcodes with PropertyData coverage. MK11 (Stony Stratford), MK15 (Willen, Woolstone), and MK19 (Hanslope, Deanshanger) have insufficient current listings for reliable figures. For the 17 with data, monthly rents range from £1,215 in MK6 to £1,690 in MK8 and gross yields range from 3.4% to 6.7%. Investors looking at flats to rent in Milton Keynes will find the city centre postcode MK9 offers the strongest yield at 6.7% from predominantly apartment stock. If you are looking to build a property portfolio in the South East, Milton Keynes combination of South East accessibility and above-national-average yields makes it worth examining closely. Browse buy-to-let properties currently available.
Average Rent & Gross Rental Yields in Milton Keynes
The postcode with the lowest asking price in Milton Keynes also delivers the highest yield. MK9 Central Milton Keynes returns 6.7% gross where monthly rents of £1,283 meet asking prices of just £228,292. At the other end, MK46 Olney at 3.4% reflects high asking prices absorbing strong absolute rents. The yield spread of 3.3 percentage points is wider than most cities on this site, reflecting the price variation between city centre flats and rural village houses within the same local authority.
| Area | Average Monthly Rent | Average Asking Price | Gross Yield |
|---|---|---|---|
| MK9 (Central Milton Keynes) | £1,283 | £228,292 | 6.7% |
| MK2 (Bletchley) | £1,289 | £282,411 | 5.5% |
| MK6 (Fishermead, Oldbrook) | £1,215 | £286,796 | 5.1% |
| MK13 (Bradwell, New Bradwell) | £1,278 | £316,591 | 4.8% |
| MK10 (Monkston, Middleton) | £1,453 | £371,637 | 4.7% |
| MK12 (Wolverton) | £1,227 | £310,625 | 4.7% |
| MK3 (Bletchley West) | £1,356 | £352,649 | 4.6% |
| MK4 (Westcroft, Emerson Valley) | £1,540 | £414,677 | 4.5% |
| MK8 (Grange Farm, Crownhill) | £1,690 | £464,340 | 4.4% |
| MK14 (Great Linford, Conniburrow) | £1,250 | £342,071 | 4.4% |
| MK16 (Newport Pagnell) | £1,353 | £399,665 | 4.1% |
| MK5 (Shenley Brook End) | £1,665 | £494,786 | 4.0% |
| MK7 (Kents Hill, Walnut Tree) | £1,318 | £409,414 | 3.9% |
| MK18 (Buckingham) | £1,285 | £423,596 | 3.6% |
| MK17 (Woburn Sands) | £1,632 | £551,752 | 3.5% |
| MK43 (Cranfield) | £1,360 | £464,773 | 3.5% |
| MK46 (Olney) | £1,332 | £471,555 | 3.4% |
| MK11 (Stony Stratford) | Not enough data | £320,833 | Not enough data |
| MK15 (Willen, Woolstone) | Not enough data | £417,000 | Not enough data |
| MK19 (Hanslope, Deanshanger) | Not enough data | £446,736 | Not enough data |
| MK1 (Bletchley, Denbigh) | Not enough data | Not enough data | Not enough data |
| MK77 (Milton Keynes Large User) | Not enough data | Not enough data | Not enough data |
Three postcodes sit above 5% gross yield: MK9, MK2, and MK6. Each draws from a different tenant pool. MK9 Central Milton Keynes attracts young professionals and corporate relocations. MK2 Bletchley serves the southern transport corridor. MK6 Fishermead taps into the original new town residential demand near the city centre. That diversity of demand means the yield is not dependent on a single tenant type.
MK8 commands Milton Keynes highest absolute rent at £1,690 per month but delivers just 4.4% yield. Grange Farm and Crownhill attract family tenants willing to pay for the western estates. The yield is compressed by asking prices of £464,340. MK5 Shenley Brook End shows a similar pattern: £1,665 rent but only 4.0% yield against a £494,786 asking price. In both postcodes, higher rents do not translate into higher yields because the entry prices absorb them.
Is Milton Keynes Rent High?
How much of a tenant's salary goes to rent in Milton Keynes? Between 35.2% and 49.0% of the local median gross monthly salary, with all 17 postcodes sitting above the 30% affordability benchmark. That reflects the South East cost base rather than unusually high rents for the region.
The median gross weekly salary in Milton Keynes is £795.90, which equates to £3,449 per month or £41,389 per year. This is slightly below the South East regional median of £800.30 per week and above the Great Britain median of £752.40 per week. Data from the Nomis Labour Market Profile (ASHE 2025).
| Rank | Area | Rent as % of Income |
|---|---|---|
| 1 | MK8 (Grange Farm, Crownhill) | 49.0% |
| 2 | MK5 (Shenley Brook End) | 48.3% |
| 3 | MK17 (Woburn Sands) | 47.3% |
| 4 | MK4 (Westcroft, Emerson Valley) | 44.7% |
| 5 | MK10 (Monkston, Middleton) | 42.1% |
| 6 | MK43 (Cranfield) | 39.4% |
| 7 | MK3 (Bletchley West) | 39.3% |
| 8 | MK16 (Newport Pagnell) | 39.2% |
| 9 | MK46 (Olney) | 38.6% |
| 10 | MK7 (Kents Hill, Walnut Tree) | 38.2% |
| 11 | MK2 (Bletchley) | 37.4% |
| 12 | MK18 (Buckingham) | 37.3% |
| 13 | MK9 (Central Milton Keynes) | 37.2% |
| 14 | MK13 (Bradwell, New Bradwell) | 37.1% |
| 15 | MK14 (Great Linford, Conniburrow) | 36.2% |
| 16 | MK12 (Wolverton) | 35.6% |
| 17 | MK6 (Fishermead, Oldbrook) | 35.2% |
| — | MK11 (Stony Stratford) | Not enough data |
| — | MK15 (Willen, Woolstone) | Not enough data |
| — | MK19 (Hanslope, Deanshanger) | Not enough data |
| — | MK1 (Bletchley, Denbigh) | Not enough data |
| — | MK77 (Milton Keynes Large User) | Not enough data |
MK6 at 35.2% is the most affordable postcode in the table relative to local earnings. It also delivers the third-highest yield at 5.1%. Rents of £1,215 are the lowest in Milton Keynes, which keeps the affordability ratio down. For investors, lower affordability pressure typically means more consistent tenant retention and fewer rent arrears.
MK8 and MK5 at 49.0% and 48.3% show the most stretched affordability. But these are higher-rent postcodes attracting tenants who likely earn above the Milton Keynes median. Professional families in Grange Farm or Shenley Brook End are not on £41,389. The median salary is a borough-wide figure that understates what tenants in these postcodes actually earn.
Thinking of Buying?
We have off-market investment properties averaging 8%+ annual yield.
View Property DealsAre Milton Keynes House Prices High? Price-to-Earnings Ratios
England's national price-to-earnings benchmark sits at 7.5x, calculated from the average sold price of £291,865 against Great Britain's median annual salary of £39,125. Milton Keynes ranges from 5.5x in MK9 to 13.3x in MK17 against a local median salary of £41,389. Three postcodes sit below the national benchmark, and they are the same three that deliver the strongest rental yields. Data from the Nomis Labour Market Profile for Milton Keynes.
MK9 (5.5x), MK2 (6.8x), and MK6 (6.9x) all sit below 7.5x, while MK12 lands exactly on the benchmark. These four postcodes are also where the strongest yields sit. The rest of Milton Keynes trades above the national benchmark, which is typical for the South East but means higher capital commitment per pound of rental income.
| Rank | Area | Price-to-Earnings Ratio |
|---|---|---|
| 1 | MK9 (Central Milton Keynes) | 5.5x |
| 2 | MK2 (Bletchley) | 6.8x |
| 3 | MK6 (Fishermead, Oldbrook) | 6.9x |
| 4 | MK12 (Wolverton) | 7.5x |
| 5 | MK13 (Bradwell, New Bradwell) | 7.6x |
| 6 | MK11 (Stony Stratford) | 7.8x |
| 7 | MK14 (Great Linford, Conniburrow) | 8.3x |
| 8 | MK3 (Bletchley West) | 8.5x |
| 9 | MK10 (Monkston, Middleton) | 9.0x |
| 10 | MK16 (Newport Pagnell) | 9.7x |
| 11 | MK7 (Kents Hill, Walnut Tree) | 9.9x |
| 12 | MK4 (Westcroft, Emerson Valley) | 10.0x |
| 13 | MK15 (Willen, Woolstone) | 10.1x |
| 14 | MK18 (Buckingham) | 10.2x |
| 15 | MK19 (Hanslope, Deanshanger) | 10.8x |
| 16 | MK8 (Grange Farm, Crownhill) | 11.2x |
| 16 | MK43 (Cranfield) | 11.2x |
| 18 | MK46 (Olney) | 11.4x |
| 19 | MK5 (Shenley Brook End) | 12.0x |
| 20 | MK17 (Woburn Sands) | 13.3x |
| — | MK1 (Bletchley, Denbigh) | Not enough data |
| — | MK77 (Milton Keynes Large User) | Not enough data |
The three sub-7.5x postcodes are the same three that deliver the highest yields. MK9 at 5.5x delivers 6.7% yield. MK2 at 6.8x delivers 5.5%. MK6 at 6.9x delivers 5.1%. Affordable entry relative to local wages and strong rental returns in the same postcodes is a data profile that tends to support sustainable buy-to-let income.
MK17 at 13.3x is the most stretched postcode relative to local incomes. Woburn Sands prices are driven by commuter demand from buyers earning London salaries, not by what Milton Keynes workers earn. MK5 at 12.0x and MK46 at 11.4x sit in similar territory. These outer postcodes are priced for owner-occupiers, not for rental yield.
Deposit Requirements in Milton Keynes
South East buy-to-let typically demands six-figure deposits. Three Milton Keynes postcodes break that pattern, requiring less than £87,000 at 30%, with MK9 at just £68,488 and MK17 at the top at £165,526. The table uses 30% rather than the minimum 25% most lenders require, as a larger deposit typically unlocks better interest rates in a yield-driven market.
That puts buy-to-let in the South East within reach for investors who might be priced out of Reading, Oxford, or outer London boroughs. Investors looking for below market value properties may find opportunities at the lower end of this range.
| Rank | Area | 30% Deposit Required |
|---|---|---|
| 1 | MK9 (Central Milton Keynes) | £68,488 |
| 2 | MK2 (Bletchley) | £84,723 |
| 3 | MK6 (Fishermead, Oldbrook) | £86,039 |
| 4 | MK12 (Wolverton) | £93,187 |
| 5 | MK13 (Bradwell, New Bradwell) | £94,977 |
| 6 | MK11 (Stony Stratford) | £96,250 |
| 7 | MK14 (Great Linford, Conniburrow) | £102,621 |
| 8 | MK3 (Bletchley West) | £105,795 |
| 9 | MK10 (Monkston, Middleton) | £111,491 |
| 10 | MK16 (Newport Pagnell) | £119,899 |
| 11 | MK7 (Kents Hill, Walnut Tree) | £122,824 |
| 12 | MK4 (Westcroft, Emerson Valley) | £124,403 |
| 13 | MK15 (Willen, Woolstone) | £125,100 |
| 14 | MK18 (Buckingham) | £127,079 |
| 15 | MK19 (Hanslope, Deanshanger) | £134,021 |
| 16 | MK8 (Grange Farm, Crownhill) | £139,302 |
| 17 | MK43 (Cranfield) | £139,432 |
| 18 | MK46 (Olney) | £141,467 |
| 19 | MK5 (Shenley Brook End) | £148,436 |
| 20 | MK17 (Woburn Sands) | £165,526 |
| — | MK1 (Bletchley, Denbigh) | Not enough data |
| — | MK77 (Milton Keynes Large User) | Not enough data |
MK9 at £68,488 is the lowest deposit in Milton Keynes and delivers the highest yield at 6.7%. That combination is unusual. In most locations, the cheapest entry point does not also offer the strongest returns. MK9 is predominantly city centre flats where low total prices and steady corporate rental demand create the conditions for outsized yields. The trade-off is low transaction volume (7 sales per month) and 5% turnover.
A clear gap separates the sub-£95,000 tier from the rest. MK9, MK2, and MK6 all require deposits under £87,000 and deliver yields of 5.1% or above. MK12 and MK13 sit just below £95,000 with yields of 4.7% and 4.8%. Beyond that, deposits climb above £100,000 and yields generally fall below 4.5%. For investors with limited capital, the three cheapest postcodes all deliver the strongest rental returns.
Deposit is only part of the upfront cost. Budget for stamp duty (use our stamp duty calculator for an accurate figure), legal fees, and survey costs. For a full breakdown, see our guide to buy-to-let costs. For alternative strategies, see our guide to buying investment property with no deposit.

What the Milton Keynes Data Tells Buy-to-Let Investors
For yield, the numbers favour MK9 (6.7%), MK2 (5.5%), and MK6 (5.1%). All three sit below 7.0x price-to-earnings with 30% deposits between £68,488 and £86,039. MK9 leads on yield but has the thinnest market (7 sales per month, 5% turnover). MK2 Bletchley combines 5.5% yield with 20.5% one-year growth and sits at the junction of East West Rail. MK6 offers the lowest rent-to-income ratio (35.2%) alongside steady yields. Investors looking for investment properties in the South East will find these three postcodes data sits below most regional entry points.
For growth, MK7 (25.6%), MK2 (21.9%), and MK12 (21.0%) delivered the strongest five-year appreciation. MK2 appears in both the yield and growth rankings. That convergence is uncommon. MK7 leads on growth but its yield of 3.9% and asking price of £409,414 position it more as a capital growth hold than an income play. MK10 also delivered 20.7% five-year growth alongside 4.7% yield and strong transaction volumes (21 sales per month).
Four postcodes show negative five-year growth: MK5 (-1.1%), MK19 (-3.8%), MK11 (-4.2%), and MK8 (-6.7%). These are predominantly higher-priced outer postcodes where the 2023 rate shock hit hardest. MK5 and MK8 both show double-digit negative one-year growth (-16.3% and -15.2%). The data does not yet indicate whether these declines represent a correction to fair value or a longer-term trend. Investors exploring off-market properties or renovation properties for sale may find opportunities in areas where asking prices are adjusting.
Milton Keynes operates a selective licensing scheme in parts of the borough. Landlords should check whether their target postcode falls within a designated area, as licensing fees and property standards apply.
How Milton Keynes Buy-to-Let Compares to Nearby Areas
Milton Keynes has the highest top yield in this five-location comparison at 6.7%, with a mean asking price of £388,510 that sits below Reading (£415,265) and Oxford (£518,350) but above Northampton (£340,422). The table compares Milton Keynes against four locations along the M1 corridor and within commuting distance of London, using the same methodology.
| Location | Mean Asking Price | Mean Monthly Rent | Top Gross Yield |
|---|---|---|---|
| Northampton | £340,422 | £1,177 | 5.5% |
| Milton Keynes | £388,510 | £1,384 | 6.7% |
| Luton | £408,606 | £1,401 | 4.8% |
| Reading | £415,265 | £1,603 | 6.1% |
| Oxford | £518,350 | £1,776 | 5.4% |
Milton Keynes has the highest top yield in this group at 6.7%, driven by MK9 Central Milton Keynes. Reading is the closest on yield at 6.1% but costs £27,000 more on mean asking price. Northampton offers the cheapest entry at £340,422 but its top yield of 5.5% is 1.2 percentage points below Milton Keynes. That means an investor in MK9 would need to generate £6,146 less in annual rent than a Northampton investor to achieve the same yield, because the entry price is lower.
Luton is the most direct competitor: similar commuter appeal, similar rent levels, higher mean asking price but a significantly lower top yield at 4.8%. Luton's Thameslink connection to London is faster than Milton Keynes current rail options, which may explain the price premium. East West Rail could narrow that gap. Oxford at £518,350 mean asking price requires substantially more capital for a lower top yield (5.4%). Oxford is a different investor profile entirely.
For investors comparing across the South East and M1 corridor, Milton Keynes data shows the highest top yield in this group, the second-lowest mean asking price, and a rent level comparable to Luton. Those looking at best buy to let areas across the UK will find Milton Keynes figures competitive with many northern cities, at South East location premiums.
Frequently Asked Questions
What are the best areas to live in Milton Keynes for buy-to-let?
MK9 Central Milton Keynes, MK2 Bletchley, and MK6 Fishermead deliver the strongest buy-to-let data across Milton Keynes 22 postcodes. MK9 has the highest gross yield at 6.7% with the lowest asking price (£228,292) and a 30% deposit of £68,488. MK2 delivers 5.5% yield alongside 21.9% five-year growth and 20.5% one-year growth, potentially driven by East West Rail. MK6 offers 5.1% yield with the lowest price per square foot (£296) and the most affordable rent-to-income ratio (35.2%). The outer postcodes (MK17, MK46, MK43) have higher asking prices and yields below 3.6%.
How does Milton Keynes compare to Northampton for property investment?
Northampton has a lower mean asking price (£340,422 vs Milton Keynes £388,510) but a lower top yield (5.5% vs 6.7%). Milton Keynes mean monthly rent of £1,384 is £207 higher than Northampton's £1,177, and that rent premium more than compensates for the higher asking prices at the yield-leading postcodes. Northampton sits on the M1 roughly 20 miles north and also has good rail links. Milton Keynes has stronger population growth (15.37% vs Northampton's growth over the same period) and the East West Rail connection that Northampton does not have. Both serve the M1 corridor commuter market, but Milton Keynes larger corporate employer base creates deeper tenant demand at the professional end of the rental market.
Are there property investment companies operating in Milton Keynes?
Several firms market buy-to-let properties in Milton Keynes, particularly new-build developments in the eastern expansion areas and city centre apartment blocks. The data in this guide covers the open market. Any property sold through an investment company can be benchmarked against these figures, but it does not guarantee a market value as these are average values across each postcode. Sourcing fees above 2-3% of purchase price and guaranteed rental yields are common marketing approaches that may not reflect actual market conditions.
What is the average rent in Milton Keynes?
The mean monthly rent across Milton Keynes 17 postcodes with rental data is £1,384. Individual postcodes range from £1,215 in MK6 (Fishermead, Oldbrook) to £1,690 in MK8 (Grange Farm, Crownhill). Three postcodes (MK11, MK15, MK19) have insufficient current listings for reliable rent figures. Rent as a percentage of the local median gross monthly salary ranges from 35.2% in MK6 to 49.0% in MK8. All 17 postcodes with rent data sit above the 30% affordability benchmark, which reflects the South East cost base rather than unusually high rents for the region.
Will East West Rail affect Milton Keynes property prices?
MK2 Bletchley, where the new line meets the West Coast Main Line, has already shown 20.5% one-year growth, the highest of any Milton Keynes postcode. East West Rail infrastructure connecting Oxford to Milton Keynes via Bletchley is complete, with Chiltern Railways named as operator and passenger services expected in 2026. The government has committed £2.5 billion to extend the route to Bedford and Cambridge in later phases. That suggests the market is already pricing in the rail connection before services begin.
The longer-term impact depends on whether the Oxford-Cambridge corridor develops as planned. The New Town Partnership signed in February 2026 for 40,000 homes is a signal that institutional players are positioning for that growth. Rail connectivity changes take years to fully reflect in property data.
How do Milton Keynes flats compare for buy-to-let?
Flats are the only property type in Milton Keynes trading below the England average, at £168,128 versus £219,340 nationally. MK9 Central Milton Keynes is predominantly flats, with the lowest asking price (£228,292), the highest gross yield (6.7%), and the highest price per square foot (£424). The high PSF reflects smaller unit sizes. MK2 Bletchley and MK6 Fishermead also have significant flat stock, with yields of 5.5% and 5.1% respectively. The trade-off with flats is service charges, leasehold structures, and in some cases lower capital growth rates compared to houses.