
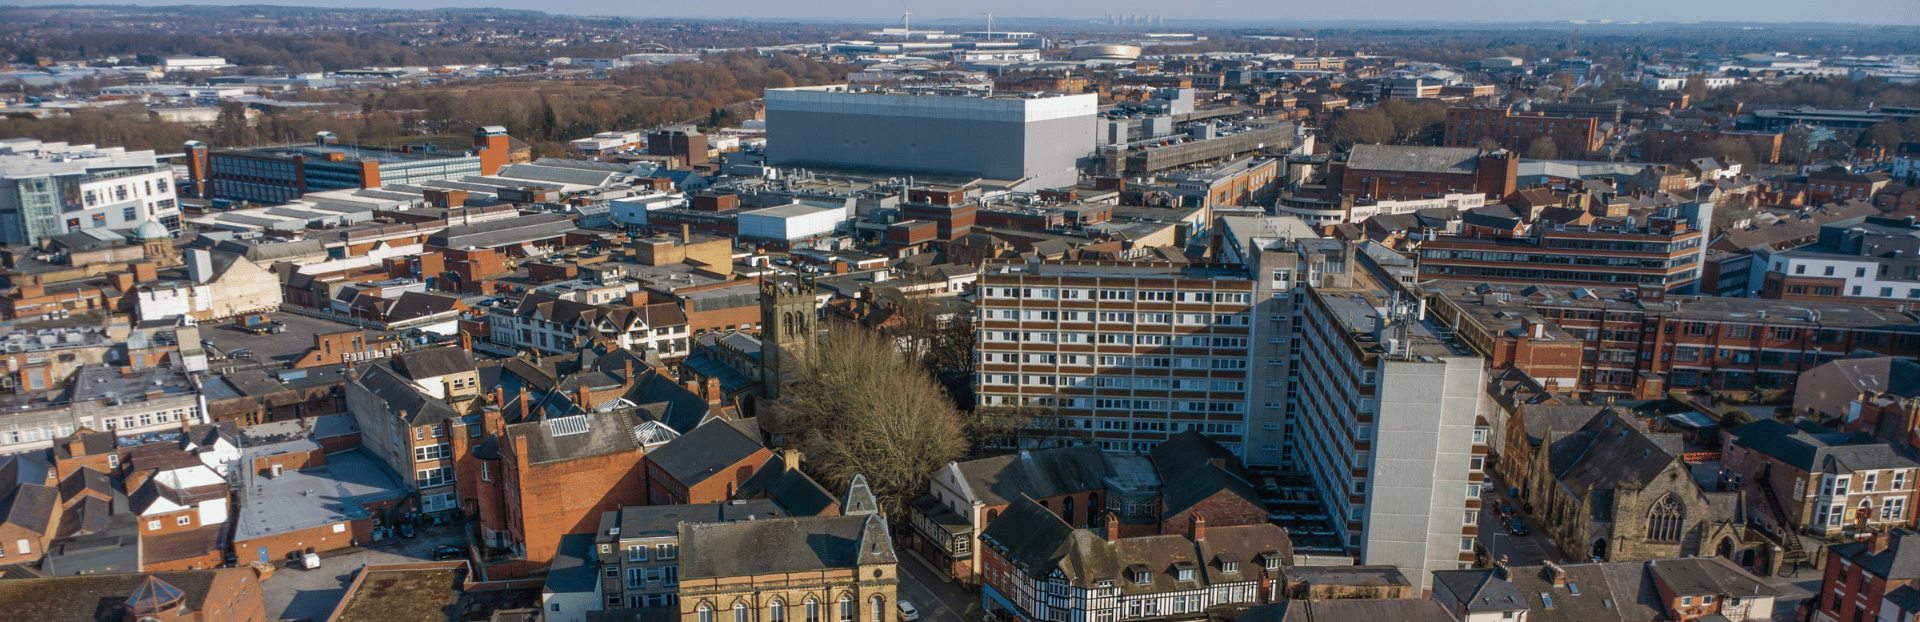
Derby is a city in the East Midlands. Derby's average sold price is £204,149, which is 29.6% below the England average of £289,946. That gap, not the yield, is the headline. A city built on Rolls-Royce, Toyota and Alstom rail engineering offers asking prices well under the national figure, with the cheapest postcode (DE1) listing from £177,372 and gross yields reaching 5.8%. Every one of Derby's 9 postcodes returns price, rent and yield data, so the whole city can be modelled from the same dataset.
This guide covers all 9 districts from DE1 in the city centre out to DE74 at Castle Donington, all within the City of Derby unitary authority (ONS code E06000015). Where DE72, DE73 and DE74 reach past the city boundary into surrounding Derbyshire and Leicestershire villages, the postcode tables stay specific to those districts. Investors weighing the East Midlands also look at nearby Nottingham and Leicester, or browse the wider best buy-to-let areas guide.
Article updated: July 2026
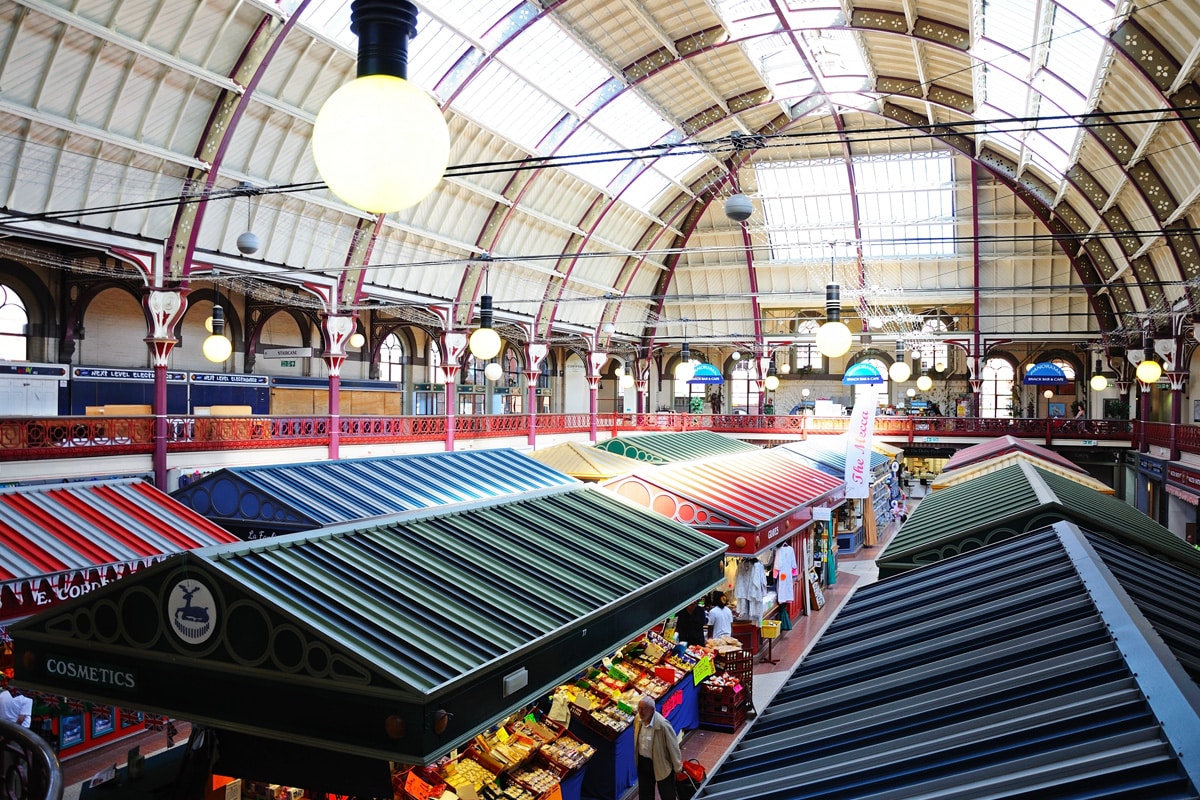
Why Invest in Derby?
Derby's economy runs on advanced manufacturing, and the employers are names that anchor a tenant base. Rolls-Royce builds and tests civil aerospace engines at Sinfin on the southern edge of the city, employing several thousand engineers and support staff. Toyota's vehicle plant at Burnaston, just over the boundary, runs full production lines, and Alstom's Litchurch Lane works is the UK's largest train manufacturing site. These are not seasonal jobs. Aerospace engine programmes are funded over decades and rail orders run for years, which is the kind of payroll that keeps rent flowing.
The University of Derby adds a second layer of demand. Its main campus sits at Kedleston Road in DE22, with a city-centre presence in DE1, and student housing concentrates around those two areas plus the Normanton edge of DE23. Healthcare is the third pillar, through Royal Derby Hospital towards Mickleover, one of the larger acute hospitals in the East Midlands. Between them, engineering, education and healthcare give Derby a spread of tenant types rather than a single dependency.
The population grew from 248,752 in 2011 to 261,364 in 2021, a rise of 5.1%, driven by both natural growth and inward migration tied to the manufacturing and logistics corridor along the A50. That road also links the city to East Midlands Airport and the distribution hubs around Castle Donington in DE74. A growing population on the back of long-term employment is the demand side a landlord wants underneath a market this affordable.
Derby Economic Summary
- Population: 261,364 (2021 Census). Growth of 5.1% from 248,752 in 2011.
- Median annual salary: £36,428 (Derby), £36,192 (East Midlands), £39,125 (Great Britain)
- Employment rate: 72.7% (Derby), 76.2% (East Midlands), 75.6% (Great Britain)
- Unemployment rate: 6.1% (Derby), 3.8% (East Midlands), 4.3% (Great Britain)
- Key employment sectors: Advanced manufacturing (Rolls-Royce, Toyota), rail engineering (Alstom), healthcare, higher education, logistics
Source: ONS Census 2021, Nomis Labour Market Profile (ASHE 2025).
Median earnings of £36,428 a year put Derby just above the East Midlands figure of £36,192 and below the Great Britain median of £39,125. Paired with sold prices nearly a third under the England average, that produces price-to-earnings ratios starting at 4.9 times income in DE1. The employment rate of 72.7% sits a little below the regional 76.2%. Rolls-Royce, Toyota and Alstom illustrate the city's advanced-manufacturing and rail-engineering sector mix; the employer names alone do not measure rental demand or job security. Explore our wider property investment resources for UK market context.
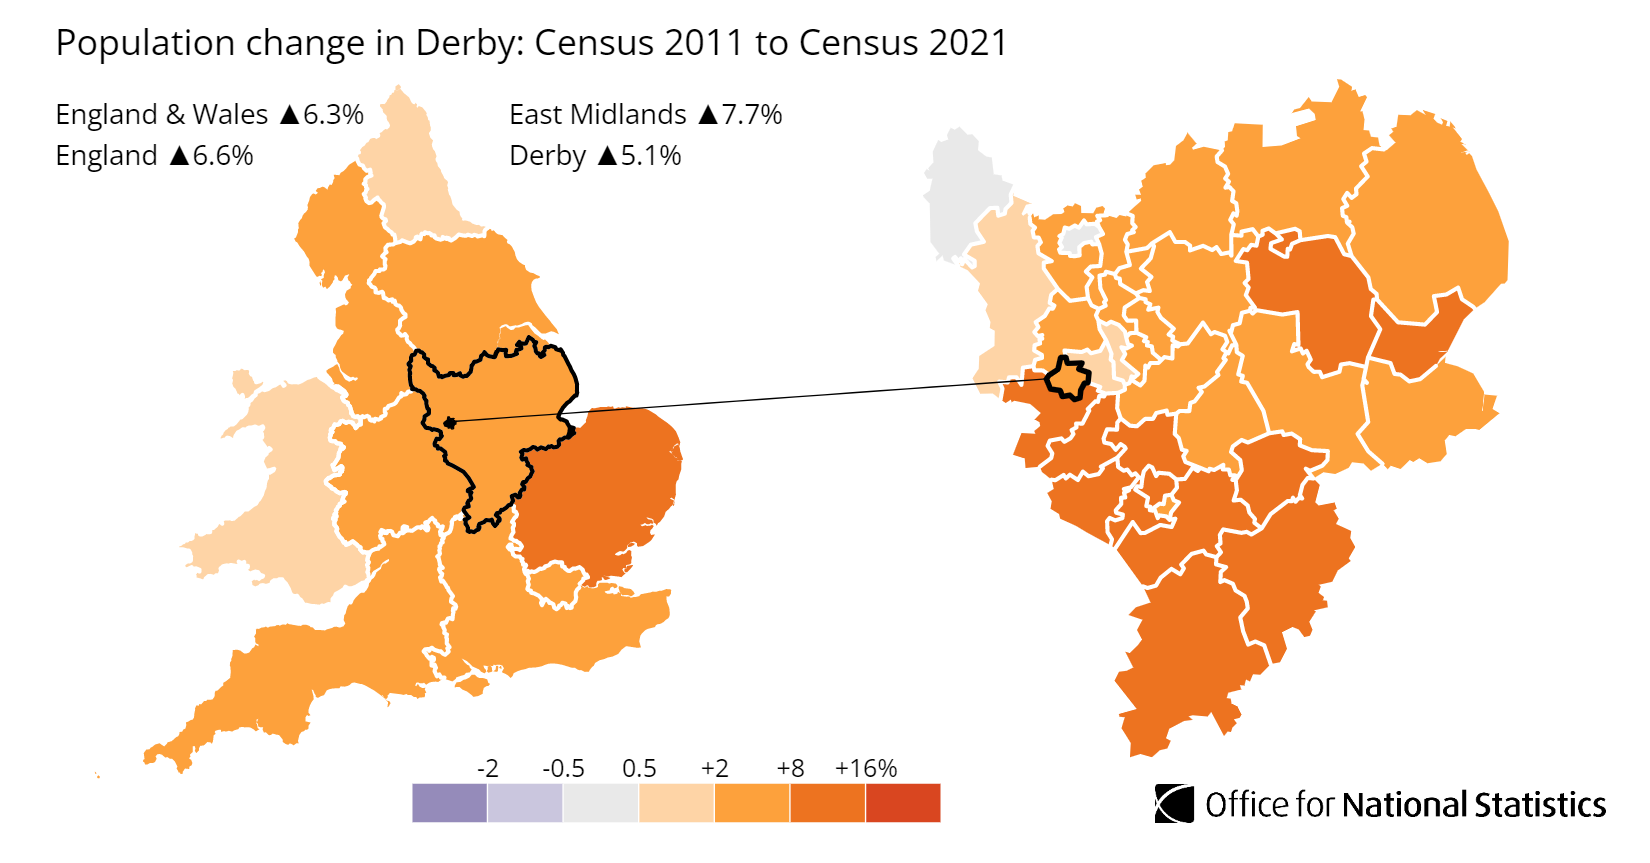
Source: Office for National Statistics - Population for Derby
Regeneration and Investment in Derby
Derby's city centre is in the middle of its biggest transformation in decades. Three schemes are delivering new homes, commercial space and cultural infrastructure inside the DE1 postcode, which is the same district that carries the lowest asking price and the highest yield in the city.
- Becketwell (Phase 1 under construction, £200 million): St James Securities and Derby City Council are delivering 259 build-to-rent apartments funded by Grainger plc, alongside a 3,500-capacity performance venue that opened as Vaillant Live in 2025 and a new public square. Phase 3 enabling works are funded. Updates at Derby City Council.
- Castleward Urban Village (Phase 4 handovers from Q1 2026, £100 million overall): A long-run placemaking scheme between the Derbion shopping centre and Derby Midland station, delivering more than 700 homes with a tree-lined boulevard and a primary school already in place. Phase 5, adding 167 homes, was submitted for planning in October 2025. Updates at Derby City Council.
- Friar Gate Goods Yard (under construction, £80 million): Wavensmere Homes is converting an 11.5-acre brownfield site, derelict since 1967, into 276 new homes and commercial space within two Grade II listed Victorian buildings. The first houses began reaching occupation in 2026, with full completion targeted by 2028. Updates at Wavensmere Homes.
Derby Property Market Analysis
Average prices in the City of Derby have risen 424.8% since January 1995, from £38,898 to £204,149. The sections below trace that climb cycle by cycle, then drill into current postcode data for sold prices, price per square foot, asking prices, growth, transaction volumes, selling speed and stock mix.
When was the last house price crash in Derby?
Derby is its own unitary authority, so the HM Land Registry House Price Index records every sold price at city level. The series runs from January 1995 to March 2026, covering 31 years and several full market cycles.
The 1995 to 2007 boom: Derby opened at £38,898 in January 1995 and climbed steadily as cheap credit and the spread of buy-to-let mortgages widened the buyer pool. Annual growth ran as hot as 37.4% in early 2003. Prices peaked at £139,094 in September 2007, more than three and a half times the 1995 starting point.
2008 to 2009, the financial crisis: The average fell from the September 2007 peak of £139,094 to a trough of £108,810 in April 2009, a drop of 21.8% over 19 months. The worst year-on-year reading was -18.1%, also in April 2009. Derby's fall was steeper than England's 18.2% decline over the same crisis, reflecting a lower-priced market with less of a cushion when credit tightened.
The 2010 to 2012 stagnation: Prices bounced off the 2009 trough but could not hold momentum. Annual change slipped back into negative territory from late 2010 through 2012, and by December 2012 the average sat around £118,000, still well short of the pre-crash peak.
Recovery, 2013 to 2016: Positive annual growth returned in 2013 and held, but prices stayed under the old high for years. The average finally cleared the September 2007 peak in May 2016 at £139,985. Peak to peak, the recovery took eight years and eight months, during which Derby spent almost every month below its 2007 level.
2017 to 2019, steady growth: Prices climbed without drama, typically 2% to 5% a year, reaching the low £160,000s by the end of 2019.
2020 to 2022, the pandemic surge: The stamp duty holiday and the shift to hybrid working pushed the market sharply higher. From the £170,000s in early 2021, prices ran on through 2022 and into 2024.
2023 to 2024, the rate shock: Higher mortgage rates cooled demand, and annual growth flattened, with a few months dipping just below zero before steadying.
2024 to present: Derby reached an all-time high of £207,355 in December 2024, then eased gently through 2025 to the latest reading of £204,149 in March 2026, 1.5% below that peak. The market is broadly flat at the top of its range rather than falling away.
Long-term growth summary:
- 5 years (March 2021 to March 2026): 18.3% growth (£172,594 to £204,149)
- 10 years (March 2016 to March 2026): 47.8% growth (£138,165 to £204,149)
- 15 years (March 2011 to March 2026): 76.0% growth (£116,010 to £204,149)
- 20 years (March 2006 to March 2026): 63.5% growth (£124,842 to £204,149)
- 30 years (January 1995 to March 2026): 424.8% growth (£38,898 to £204,149)
The 20-year figure coming in below the 15-year one is purely a question of the start date. March 2006 prices of £124,842 were already inflated by the late boom, while March 2011 prices of £116,010 sat in the post-crash dip, so measuring from the lower base produces the higher return. The lesson is in the timing: a buyer at the September 2007 peak waited until May 2016 just to break even, whereas a buyer at the April 2009 trough has seen the average rise 87.6% since. The 21.8% crash is the reference point for downside, and the recovery took most of a decade.
- All property types
- Detached
- Semi-detached
- Terraced
- Flats
Source: HM Land Registry House Price Index
| Year | All property types | Detached | Semi-detached | Terraced | Flats |
|---|---|---|---|---|---|
| 1995-01 | £38,898 | £63,777 | £37,984 | £29,506 | £26,020 |
| 1995-02 | £39,126 | £63,740 | £38,397 | £29,633 | £26,194 |
| 1995-03 | £39,483 | £64,159 | £38,754 | £29,956 | £26,396 |
| 1995-04 | £39,616 | £64,157 | £38,933 | £30,080 | £26,552 |
| 1995-05 | £39,111 | £63,194 | £38,418 | £29,765 | £26,265 |
| 1995-06 | £38,781 | £62,685 | £38,133 | £29,459 | £26,153 |
| 1995-07 | £38,715 | £62,745 | £38,050 | £29,379 | £25,935 |
| 1995-08 | £38,827 | £63,308 | £38,104 | £29,398 | £25,791 |
| 1995-09 | £37,860 | £61,799 | £37,105 | £28,704 | £24,963 |
| 1995-10 | £37,410 | £61,099 | £36,747 | £28,263 | £24,755 |
| 1995-11 | £37,452 | £61,180 | £36,843 | £28,230 | £24,868 |
| 1995-12 | £38,420 | £62,741 | £37,864 | £28,895 | £25,533 |
| 1996-01 | £38,726 | £63,459 | £38,135 | £29,096 | £25,499 |
| 1996-02 | £38,852 | £63,564 | £38,295 | £29,192 | £25,491 |
| 1996-03 | £38,732 | £63,471 | £38,235 | £29,027 | £25,153 |
| 1996-04 | £38,915 | £63,553 | £38,389 | £29,264 | £25,282 |
| 1996-05 | £38,611 | £62,954 | £38,022 | £29,145 | £25,032 |
| 1996-06 | £38,600 | £62,852 | £37,921 | £29,229 | £25,282 |
| 1996-07 | £38,546 | £62,884 | £37,864 | £29,161 | £25,160 |
| 1996-08 | £38,792 | £63,645 | £38,068 | £29,276 | £25,146 |
| 1996-09 | £39,000 | £64,388 | £38,204 | £29,388 | £25,005 |
| 1996-10 | £38,451 | £63,613 | £37,690 | £28,915 | £24,565 |
| 1996-11 | £38,919 | £64,224 | £38,182 | £29,278 | £24,970 |
| 1996-12 | £38,663 | £63,567 | £38,005 | £29,099 | £24,731 |
| 1997-01 | £38,904 | £63,997 | £38,203 | £29,317 | £24,810 |
| 1997-02 | £38,739 | £63,950 | £38,053 | £29,126 | £24,507 |
| 1997-03 | £39,192 | £64,771 | £38,450 | £29,492 | £24,815 |
| 1997-04 | £39,359 | £64,778 | £38,666 | £29,658 | £24,995 |
| 1997-05 | £39,493 | £64,774 | £38,821 | £29,821 | £25,033 |
| 1997-06 | £39,275 | £64,517 | £38,609 | £29,637 | £24,685 |
| 1997-07 | £40,380 | £66,520 | £39,630 | £30,487 | £25,125 |
| 1997-08 | £40,872 | £67,588 | £40,061 | £30,823 | £25,334 |
| 1997-09 | £41,499 | £68,655 | £40,660 | £31,304 | £25,687 |
| 1997-10 | £41,328 | £68,535 | £40,535 | £31,082 | £25,562 |
| 1997-11 | £41,278 | £68,514 | £40,520 | £30,998 | £25,472 |
| 1997-12 | £40,955 | £68,012 | £40,291 | £30,672 | £25,193 |
| 1998-01 | £40,538 | £67,441 | £39,817 | £30,378 | £24,910 |
| 1998-02 | £40,183 | £66,741 | £39,482 | £30,118 | £24,813 |
| 1998-03 | £40,265 | £66,824 | £39,536 | £30,211 | £24,892 |
| 1998-04 | £40,866 | £67,532 | £40,225 | £30,663 | £25,254 |
| 1998-05 | £41,322 | £68,141 | £40,637 | £31,098 | £25,423 |
| 1998-06 | £41,253 | £68,065 | £40,532 | £31,064 | £25,432 |
| 1998-07 | £41,687 | £68,947 | £40,898 | £31,399 | £25,641 |
| 1998-08 | £42,489 | £70,605 | £41,637 | £31,942 | £26,076 |
| 1998-09 | £43,389 | £72,238 | £42,498 | £32,600 | £26,552 |
| 1998-10 | £42,892 | £71,593 | £42,008 | £32,165 | £26,293 |
| 1998-11 | £42,336 | £70,811 | £41,559 | £31,605 | £26,009 |
| 1998-12 | £42,315 | £70,592 | £41,625 | £31,556 | £26,117 |
| 1999-01 | £42,089 | £70,118 | £41,456 | £31,369 | £25,990 |
| 1999-02 | £41,275 | £68,609 | £40,649 | £30,810 | £25,593 |
| 1999-03 | £41,310 | £68,782 | £40,679 | £30,804 | £25,670 |
| 1999-04 | £42,049 | £69,733 | £41,406 | £31,462 | £26,124 |
| 1999-05 | £43,009 | £71,185 | £42,343 | £32,253 | £26,582 |
| 1999-06 | £43,273 | £71,590 | £42,549 | £32,529 | £26,621 |
| 1999-07 | £43,743 | £72,636 | £42,920 | £32,879 | £26,828 |
| 1999-08 | £44,152 | £73,476 | £43,227 | £33,223 | £27,041 |
| 1999-09 | £45,490 | £75,966 | £44,442 | £34,220 | £27,943 |
| 1999-10 | £45,521 | £76,147 | £44,548 | £34,106 | £28,094 |
| 1999-11 | £46,072 | £77,029 | £45,147 | £34,461 | £28,586 |
| 1999-12 | £45,535 | £75,926 | £44,682 | £34,068 | £28,328 |
| 2000-01 | £45,905 | £76,686 | £45,031 | £34,318 | £28,408 |
| 2000-02 | £46,734 | £78,251 | £45,829 | £34,878 | £28,768 |
| 2000-03 | £47,603 | £79,750 | £46,742 | £35,441 | £29,018 |
| 2000-04 | £48,723 | £81,268 | £47,820 | £36,382 | £29,808 |
| 2000-05 | £47,775 | £79,532 | £46,929 | £35,680 | £29,257 |
| 2000-06 | £47,207 | £78,535 | £46,378 | £35,252 | £29,060 |
| 2000-07 | £47,724 | £79,893 | £46,904 | £35,503 | £29,221 |
| 2000-08 | £49,329 | £82,972 | £48,509 | £36,563 | £30,278 |
| 2000-09 | £50,844 | £86,125 | £49,930 | £37,582 | £31,195 |
| 2000-10 | £50,613 | £85,853 | £49,809 | £37,288 | £31,122 |
| 2000-11 | £50,193 | £85,316 | £49,388 | £36,939 | £30,858 |
| 2000-12 | £50,639 | £85,807 | £49,936 | £37,236 | £31,281 |
| 2001-01 | £51,158 | £86,667 | £50,361 | £37,688 | £31,694 |
| 2001-02 | £52,556 | £88,787 | £51,726 | £38,800 | £32,507 |
| 2001-03 | £51,166 | £86,457 | £50,337 | £37,801 | £31,496 |
| 2001-04 | £51,513 | £86,935 | £50,620 | £38,139 | £31,665 |
| 2001-05 | £51,950 | £87,368 | £51,063 | £38,527 | £32,068 |
| 2001-06 | £53,159 | £89,204 | £52,213 | £39,489 | £33,042 |
| 2001-07 | £54,817 | £92,087 | £53,875 | £40,660 | £34,122 |
| 2001-08 | £55,799 | £94,235 | £54,735 | £41,332 | £34,734 |
| 2001-09 | £57,324 | £97,295 | £56,102 | £42,435 | £35,629 |
| 2001-10 | £57,647 | £97,772 | £56,455 | £42,653 | £35,930 |
| 2001-11 | £58,349 | £98,911 | £57,262 | £43,082 | £36,472 |
| 2001-12 | £59,038 | £99,760 | £58,103 | £43,514 | £37,256 |
| 2002-01 | £58,798 | £99,549 | £57,860 | £43,277 | £37,218 |
| 2002-02 | £59,330 | £100,471 | £58,285 | £43,735 | £37,623 |
| 2002-03 | £59,926 | £101,378 | £58,875 | £44,224 | £37,752 |
| 2002-04 | £61,543 | £103,726 | £60,429 | £45,530 | £39,013 |
| 2002-05 | £62,634 | £105,051 | £61,631 | £46,369 | £39,793 |
| 2002-06 | £64,671 | £108,412 | £63,535 | £47,952 | £41,310 |
| 2002-07 | £67,164 | £112,689 | £65,955 | £49,808 | £42,784 |
| 2002-08 | £69,912 | £117,425 | £68,598 | £51,852 | £44,572 |
| 2002-09 | £72,243 | £121,556 | £71,000 | £53,446 | £45,864 |
| 2002-10 | £73,884 | £124,244 | £72,815 | £54,520 | £46,874 |
| 2002-11 | £75,716 | £127,516 | £74,618 | £55,820 | £48,029 |
| 2002-12 | £78,007 | £130,778 | £77,002 | £57,550 | £49,784 |
| 2003-01 | £80,600 | £134,931 | £79,396 | £59,635 | £51,614 |
| 2003-02 | £81,537 | £135,973 | £80,420 | £60,394 | £52,225 |
| 2003-03 | £82,054 | £137,104 | £80,810 | £60,819 | £52,307 |
| 2003-04 | £81,870 | £136,413 | £80,833 | £60,619 | £52,284 |
| 2003-05 | £83,851 | £139,509 | £82,871 | £62,075 | £53,590 |
| 2003-06 | £85,608 | £141,667 | £84,675 | £63,488 | £55,293 |
| 2003-07 | £88,019 | £144,989 | £87,080 | £65,455 | £56,833 |
| 2003-08 | £90,588 | £148,531 | £89,602 | £67,571 | £58,597 |
| 2003-09 | £93,395 | £152,825 | £92,399 | £69,780 | £59,955 |
| 2003-10 | £96,593 | £157,795 | £95,526 | £72,278 | £62,013 |
| 2003-11 | £98,933 | £161,369 | £97,869 | £74,081 | £63,479 |
| 2003-12 | £101,171 | £163,764 | £100,080 | £76,087 | £65,427 |
| 2004-01 | £102,118 | £165,116 | £100,925 | £76,923 | £66,101 |
| 2004-02 | £102,549 | £165,098 | £101,249 | £77,507 | £66,599 |
| 2004-03 | £101,852 | £164,156 | £100,355 | £77,072 | £66,014 |
| 2004-04 | £104,056 | £165,845 | £102,621 | £79,210 | £67,509 |
| 2004-05 | £107,823 | £170,291 | £106,239 | £82,593 | £70,137 |
| 2004-06 | £112,626 | £176,517 | £111,085 | £86,531 | £73,605 |
| 2004-07 | £114,621 | £179,191 | £113,108 | £88,189 | £74,757 |
| 2004-08 | £115,192 | £180,148 | £113,703 | £88,606 | £75,006 |
| 2004-09 | £118,106 | £185,025 | £116,495 | £90,898 | £76,453 |
| 2004-10 | £120,228 | £188,528 | £118,422 | £92,536 | £78,206 |
| 2004-11 | £121,606 | £190,623 | £119,719 | £93,620 | £79,340 |
| 2004-12 | £118,442 | £184,824 | £116,512 | £91,414 | £77,834 |
| 2005-01 | £118,146 | £184,316 | £115,961 | £91,346 | £77,962 |
| 2005-02 | £118,168 | £183,917 | £115,989 | £91,438 | £78,148 |
| 2005-03 | £120,732 | £187,960 | £118,568 | £93,356 | £79,736 |
| 2005-04 | £121,276 | £187,645 | £119,256 | £93,981 | £80,038 |
| 2005-05 | £120,755 | £186,638 | £118,548 | £93,763 | £79,807 |
| 2005-06 | £121,566 | £186,491 | £119,196 | £94,872 | £80,457 |
| 2005-07 | £121,168 | £185,954 | £118,794 | £94,578 | £80,081 |
| 2005-08 | £124,158 | £190,392 | £121,626 | £97,074 | £81,882 |
| 2005-09 | £122,676 | £188,796 | £120,066 | £95,859 | £80,714 |
| 2005-10 | £125,444 | £193,001 | £122,528 | £98,180 | £82,781 |
| 2005-11 | £122,678 | £188,476 | £119,832 | £96,071 | £81,021 |
| 2005-12 | £123,392 | £188,681 | £120,392 | £96,844 | £82,131 |
| 2006-01 | £120,720 | £184,502 | £117,672 | £94,906 | £80,185 |
| 2006-02 | £122,935 | £187,337 | £119,683 | £96,798 | £82,080 |
| 2006-03 | £124,842 | £190,871 | £121,647 | £98,146 | £82,851 |
| 2006-04 | £126,835 | £193,153 | £123,701 | £99,836 | £84,281 |
| 2006-05 | £128,536 | £195,580 | £125,527 | £101,190 | £85,089 |
| 2006-06 | £128,879 | £195,067 | £125,926 | £101,758 | £85,306 |
| 2006-07 | £129,463 | £195,929 | £126,409 | £102,438 | £85,285 |
| 2006-08 | £129,027 | £195,362 | £125,905 | £102,344 | £84,352 |
| 2006-09 | £129,232 | £196,368 | £126,072 | £102,432 | £84,084 |
| 2006-10 | £130,261 | £198,147 | £127,087 | £103,162 | £84,761 |
| 2006-11 | £131,602 | £200,172 | £128,500 | £104,177 | £85,516 |
| 2006-12 | £133,769 | £202,453 | £130,587 | £106,195 | £87,140 |
| 2007-01 | £136,130 | £205,992 | £132,872 | £108,131 | £88,580 |
| 2007-02 | £135,438 | £204,782 | £132,083 | £107,513 | £88,649 |
| 2007-03 | £134,995 | £204,644 | £131,609 | £107,160 | £87,935 |
| 2007-04 | £133,450 | £201,592 | £130,071 | £106,237 | £86,849 |
| 2007-05 | £136,500 | £205,435 | £132,970 | £109,015 | £88,783 |
| 2007-06 | £136,998 | £205,810 | £133,365 | £109,562 | £89,242 |
| 2007-07 | £139,048 | £209,404 | £135,249 | £111,145 | £90,560 |
| 2007-08 | £138,348 | £209,261 | £134,576 | £110,673 | £89,234 |
| 2007-09 | £139,094 | £210,975 | £135,305 | £111,206 | £89,421 |
| 2007-10 | £138,376 | £210,440 | £134,509 | £110,534 | £88,972 |
| 2007-11 | £136,946 | £208,492 | £133,162 | £109,163 | £88,291 |
| 2007-12 | £136,824 | £208,193 | £132,996 | £109,030 | £88,468 |
| 2008-01 | £135,221 | £205,955 | £131,416 | £107,659 | £87,533 |
| 2008-02 | £136,384 | £207,723 | £132,457 | £108,561 | £88,508 |
| 2008-03 | £132,738 | £202,673 | £129,081 | £105,533 | £85,705 |
| 2008-04 | £132,880 | £203,067 | £129,278 | £105,776 | £85,313 |
| 2008-05 | £131,531 | £200,617 | £128,076 | £104,780 | £84,316 |
| 2008-06 | £133,887 | £203,736 | £130,286 | £106,818 | £85,969 |
| 2008-07 | £132,742 | £201,846 | £129,404 | £105,724 | £85,224 |
| 2008-08 | £131,516 | £200,431 | £128,128 | £104,830 | £84,157 |
| 2008-09 | £126,734 | £194,807 | £123,324 | £100,733 | £80,920 |
| 2008-10 | £121,192 | £186,622 | £117,850 | £96,280 | £77,430 |
| 2008-11 | £117,023 | £180,423 | £113,934 | £92,770 | £74,752 |
| 2008-12 | £117,348 | £179,892 | £114,412 | £93,307 | £74,724 |
| 2009-01 | £118,252 | £181,814 | £115,149 | £93,963 | £75,384 |
| 2009-02 | £115,498 | £177,826 | £112,445 | £91,670 | £73,909 |
| 2009-03 | £111,084 | £171,454 | £108,109 | £87,890 | £71,690 |
| 2009-04 | £108,810 | £167,131 | £106,159 | £86,130 | £70,339 |
| 2009-05 | £109,939 | £168,328 | £107,340 | £87,207 | £70,940 |
| 2009-06 | £114,294 | £174,772 | £111,669 | £90,802 | £73,313 |
| 2009-07 | £117,677 | £180,058 | £114,938 | £93,651 | £74,881 |
| 2009-08 | £121,820 | £186,894 | £118,902 | £96,987 | £76,948 |
| 2009-09 | £121,512 | £186,667 | £118,622 | £96,739 | £76,339 |
| 2009-10 | £122,228 | £187,971 | £119,468 | £97,183 | £76,420 |
| 2009-11 | £121,219 | £186,614 | £118,400 | £96,487 | £75,429 |
| 2009-12 | £122,412 | £187,481 | £119,704 | £97,780 | £75,928 |
| 2010-01 | £121,595 | £187,094 | £118,773 | £97,117 | £74,703 |
| 2010-02 | £119,927 | £184,637 | £117,372 | £95,630 | £73,257 |
| 2010-03 | £117,333 | £182,051 | £114,760 | £93,075 | £71,526 |
| 2010-04 | £118,612 | £183,226 | £116,195 | £94,122 | £72,655 |
| 2010-05 | £119,089 | £184,071 | £116,606 | £94,445 | £73,162 |
| 2010-06 | £121,712 | £187,648 | £119,210 | £96,792 | £74,468 |
| 2010-07 | £122,193 | £188,924 | £119,591 | £97,198 | £74,286 |
| 2010-08 | £123,619 | £191,450 | £121,122 | £98,203 | £74,681 |
| 2010-09 | £122,835 | £191,207 | £120,285 | £97,330 | £73,924 |
| 2010-10 | £120,334 | £187,591 | £117,868 | £95,171 | £72,506 |
| 2010-11 | £119,391 | £186,588 | £116,861 | £94,257 | £72,110 |
| 2010-12 | £116,919 | £182,317 | £114,609 | £92,250 | £70,776 |
| 2011-01 | £117,119 | £182,953 | £114,728 | £92,311 | £71,030 |
| 2011-02 | £115,314 | £180,148 | £112,829 | £91,013 | £69,954 |
| 2011-03 | £116,010 | £182,224 | £113,346 | £91,345 | £70,315 |
| 2011-04 | £115,676 | £181,532 | £112,990 | £91,188 | £70,079 |
| 2011-05 | £116,381 | £182,178 | £113,809 | £91,722 | £70,793 |
| 2011-06 | £116,761 | £181,580 | £114,396 | £92,273 | £71,085 |
| 2011-07 | £118,897 | £184,523 | £116,552 | £93,990 | £72,607 |
| 2011-08 | £120,908 | £187,946 | £118,622 | £95,569 | £73,053 |
| 2011-09 | £121,786 | £189,940 | £119,317 | £96,276 | £73,202 |
| 2011-10 | £120,811 | £189,002 | £118,487 | £95,270 | £72,149 |
| 2011-11 | £117,977 | £184,523 | £115,742 | £92,884 | £70,953 |
| 2011-12 | £117,822 | £183,858 | £115,817 | £92,639 | £71,103 |
| 2012-01 | £115,950 | £180,379 | £114,099 | £91,269 | £69,971 |
| 2012-02 | £116,560 | £180,958 | £114,710 | £92,037 | £69,877 |
| 2012-03 | £116,539 | £180,257 | £114,762 | £92,276 | £69,917 |
| 2012-04 | £116,891 | £180,882 | £115,014 | £92,567 | £70,281 |
| 2012-05 | £117,087 | £181,294 | £115,161 | £92,662 | £70,579 |
| 2012-06 | £118,761 | £183,892 | £116,638 | £94,220 | £71,385 |
| 2012-07 | £119,859 | £185,270 | £117,682 | £95,326 | £71,906 |
| 2012-08 | £120,812 | £186,407 | £118,653 | £96,331 | £72,085 |
| 2012-09 | £118,481 | £183,438 | £116,303 | £94,259 | £70,569 |
| 2012-10 | £118,099 | £182,826 | £116,031 | £93,860 | £70,339 |
| 2012-11 | £118,072 | £183,020 | £115,989 | £93,699 | £70,455 |
| 2012-12 | £118,242 | £183,239 | £116,299 | £93,757 | £70,384 |
| 2013-01 | £118,912 | £184,479 | £117,112 | £94,112 | £70,519 |
| 2013-02 | £121,520 | £188,649 | £119,688 | £96,130 | £72,011 |
| 2013-03 | £121,690 | £189,368 | £119,823 | £96,079 | £72,176 |
| 2013-04 | £122,653 | £190,763 | £120,654 | £96,989 | £72,853 |
| 2013-05 | £120,816 | £187,538 | £118,935 | £95,577 | £71,927 |
| 2013-06 | £124,332 | £192,033 | £122,491 | £98,708 | £73,986 |
| 2013-07 | £126,031 | £194,500 | £124,045 | £100,251 | £75,019 |
| 2013-08 | £126,428 | £195,106 | £124,407 | £100,636 | £75,092 |
| 2013-09 | £124,233 | £192,677 | £122,132 | £98,604 | £73,624 |
| 2013-10 | £123,059 | £191,622 | £121,103 | £97,254 | £72,635 |
| 2013-11 | £121,569 | £189,756 | £119,700 | £95,834 | £71,595 |
| 2013-12 | £124,176 | £192,942 | £122,536 | £97,954 | £73,398 |
| 2014-01 | £124,208 | £192,641 | £122,547 | £98,114 | £73,631 |
| 2014-02 | £127,320 | £197,442 | £125,629 | £100,571 | £75,517 |
| 2014-03 | £125,265 | £194,483 | £123,643 | £98,841 | £74,117 |
| 2014-04 | £126,970 | £196,584 | £125,405 | £100,356 | £75,080 |
| 2014-05 | £126,979 | £196,031 | £125,466 | £100,552 | £75,116 |
| 2014-06 | £129,705 | £200,106 | £128,126 | £102,841 | £76,586 |
| 2014-07 | £130,252 | £201,087 | £128,619 | £103,314 | £76,711 |
| 2014-08 | £133,595 | £206,600 | £131,873 | £105,920 | £78,445 |
| 2014-09 | £134,314 | £207,962 | £132,447 | £106,489 | £78,967 |
| 2014-10 | £134,153 | £207,908 | £132,375 | £106,168 | £78,950 |
| 2014-11 | £133,062 | £206,521 | £131,377 | £105,077 | £78,382 |
| 2014-12 | £132,316 | £205,586 | £130,721 | £104,303 | £77,978 |
| 2015-01 | £132,047 | £205,134 | £130,491 | £104,055 | £77,878 |
| 2015-02 | £131,131 | £203,350 | £129,497 | £103,454 | £77,806 |
| 2015-03 | £130,469 | £202,531 | £128,937 | £102,736 | £77,490 |
| 2015-04 | £133,861 | £208,016 | £132,226 | £105,412 | £79,351 |
| 2015-05 | £134,154 | £208,519 | £132,681 | £105,525 | £79,267 |
| 2015-06 | £136,179 | £211,304 | £134,698 | £107,399 | £79,903 |
| 2015-07 | £135,921 | £210,563 | £134,600 | £107,184 | £79,767 |
| 2015-08 | £137,857 | £213,769 | £136,419 | £108,798 | £80,578 |
| 2015-09 | £138,202 | £215,168 | £136,582 | £108,857 | £80,877 |
| 2015-10 | £138,117 | £215,769 | £136,440 | £108,625 | £80,471 |
| 2015-11 | £137,235 | £214,727 | £135,642 | £107,743 | £79,860 |
| 2015-12 | £138,148 | £215,941 | £136,720 | £108,415 | £80,256 |
| 2016-01 | £137,490 | £214,398 | £136,254 | £107,897 | £80,025 |
| 2016-02 | £138,939 | £216,484 | £137,755 | £109,039 | £80,895 |
| 2016-03 | £138,165 | £215,463 | £136,871 | £108,376 | £80,807 |
| 2016-04 | £139,043 | £216,815 | £137,721 | £109,155 | £81,064 |
| 2016-05 | £139,985 | £217,615 | £138,596 | £110,137 | £81,999 |
| 2016-06 | £142,688 | £221,464 | £141,364 | £112,371 | £83,393 |
| 2016-07 | £145,147 | £225,197 | £143,615 | £114,456 | £85,088 |
| 2016-08 | £145,017 | £225,719 | £143,426 | £114,159 | £84,797 |
| 2016-09 | £145,227 | £226,211 | £143,680 | £114,229 | £84,840 |
| 2016-10 | £143,742 | £224,795 | £142,301 | £112,566 | £84,107 |
| 2016-11 | £143,975 | £226,019 | £142,583 | £112,345 | £84,222 |
| 2016-12 | £144,044 | £226,488 | £142,580 | £112,242 | £84,565 |
| 2017-01 | £144,041 | £226,619 | £142,495 | £112,253 | £84,607 |
| 2017-02 | £146,530 | £230,095 | £144,757 | £114,429 | £86,514 |
| 2017-03 | £145,611 | £228,710 | £143,888 | £113,593 | £86,119 |
| 2017-04 | £146,997 | £230,490 | £145,228 | £114,782 | £87,181 |
| 2017-05 | £146,738 | £229,426 | £145,302 | £114,500 | £87,044 |
| 2017-06 | £147,952 | £230,505 | £146,521 | £115,702 | £87,953 |
| 2017-07 | £148,903 | £231,577 | £147,518 | £116,549 | £88,539 |
| 2017-08 | £147,465 | £229,291 | £145,943 | £115,675 | £87,461 |
| 2017-09 | £147,697 | £230,198 | £146,107 | £115,795 | £87,312 |
| 2017-10 | £146,259 | £228,349 | £144,833 | £114,428 | £86,256 |
| 2017-11 | £147,649 | £231,024 | £146,394 | £115,211 | £86,824 |
| 2017-12 | £148,147 | £231,390 | £147,126 | £115,566 | £86,983 |
| 2018-01 | £150,153 | £234,443 | £149,152 | £117,064 | £88,349 |
| 2018-02 | £150,449 | £234,933 | £149,300 | £117,302 | £88,913 |
| 2018-03 | £149,488 | £233,782 | £148,289 | £116,588 | £88,194 |
| 2018-04 | £149,317 | £233,495 | £148,171 | £116,745 | £87,403 |
| 2018-05 | £149,798 | £234,109 | £148,882 | £117,342 | £86,825 |
| 2018-06 | £152,403 | £238,022 | £151,672 | £119,313 | £88,162 |
| 2018-07 | £154,226 | £241,050 | £153,450 | £120,679 | £89,248 |
| 2018-08 | £155,539 | £243,112 | £154,682 | £121,660 | £90,265 |
| 2018-09 | £156,324 | £244,603 | £155,360 | £122,363 | £90,524 |
| 2018-10 | £154,853 | £242,453 | £153,947 | £121,078 | £89,683 |
| 2018-11 | £155,954 | £244,730 | £155,196 | £121,828 | £89,653 |
| 2018-12 | £155,128 | £243,268 | £154,510 | £121,043 | £89,303 |
| 2019-01 | £155,075 | £243,658 | £154,545 | £120,778 | £89,072 |
| 2019-02 | £154,609 | £242,945 | £153,937 | £120,263 | £89,476 |
| 2019-03 | £154,894 | £243,616 | £154,317 | £120,404 | £89,349 |
| 2019-04 | £156,732 | £245,862 | £156,166 | £122,154 | £90,317 |
| 2019-05 | £155,577 | £243,529 | £155,212 | £121,525 | £89,044 |
| 2019-06 | £156,207 | £244,207 | £155,837 | £122,143 | £89,468 |
| 2019-07 | £156,285 | £244,140 | £155,811 | £122,332 | £89,713 |
| 2019-08 | £158,172 | £246,983 | £157,594 | £123,996 | £90,733 |
| 2019-09 | £157,271 | £245,509 | £156,426 | £123,561 | £90,377 |
| 2019-10 | £157,123 | £245,118 | £156,619 | £123,247 | £90,024 |
| 2019-11 | £156,306 | £244,125 | £156,096 | £122,241 | £89,312 |
| 2019-12 | £159,008 | £248,537 | £159,095 | £124,214 | £90,130 |
| 2020-01 | £158,287 | £247,738 | £158,318 | £123,632 | £89,534 |
| 2020-02 | £157,656 | £246,563 | £157,569 | £123,289 | £89,381 |
| 2020-03 | £155,518 | £243,172 | £155,412 | £121,533 | £88,569 |
| 2020-04 | £155,113 | £242,978 | £154,904 | £121,318 | £87,596 |
| 2020-05 | £155,646 | £244,206 | £155,529 | £121,451 | £87,762 |
| 2020-06 | £157,535 | £246,833 | £157,530 | £123,035 | £88,586 |
| 2020-07 | £160,547 | £250,706 | £160,631 | £125,515 | £91,048 |
| 2020-08 | £163,057 | £254,317 | £163,204 | £127,671 | £92,094 |
| 2020-09 | £163,989 | £256,272 | £163,990 | £128,397 | £92,323 |
| 2020-10 | £164,761 | £258,219 | £164,623 | £128,936 | £92,184 |
| 2020-11 | £165,630 | £259,822 | £165,204 | £129,802 | £92,784 |
| 2020-12 | £167,877 | £263,203 | £167,323 | £131,803 | £93,990 |
| 2021-01 | £169,904 | £264,683 | £169,547 | £133,758 | £96,201 |
| 2021-02 | £172,689 | £267,201 | £172,393 | £136,543 | £98,916 |
| 2021-03 | £172,594 | £265,329 | £172,370 | £136,964 | £100,163 |
| 2021-04 | £173,222 | £266,351 | £172,741 | £137,715 | £100,652 |
| 2021-05 | £172,643 | £265,906 | £172,114 | £137,145 | £100,058 |
| 2021-06 | £176,005 | £270,339 | £175,264 | £140,440 | £102,222 |
| 2021-07 | £177,912 | £273,591 | £177,375 | £141,652 | £102,873 |
| 2021-08 | £179,031 | £275,456 | £178,709 | £142,385 | £102,881 |
| 2021-09 | £179,494 | £276,576 | £179,405 | £142,375 | £102,619 |
| 2021-10 | £180,221 | £279,237 | £179,945 | £142,520 | £102,420 |
| 2021-11 | £181,990 | £282,698 | £181,652 | £143,666 | £103,178 |
| 2021-12 | £181,117 | £282,722 | £180,682 | £142,545 | £101,944 |
| 2022-01 | £180,703 | £280,684 | £180,557 | £142,679 | £101,555 |
| 2022-02 | £181,935 | £282,005 | £181,812 | £143,848 | £102,550 |
| 2022-03 | £184,606 | £286,209 | £184,785 | £145,637 | £103,738 |
| 2022-04 | £187,003 | £289,835 | £187,012 | £147,742 | £105,194 |
| 2022-05 | £189,084 | £292,683 | £189,245 | £149,553 | £105,980 |
| 2022-06 | £191,136 | £295,160 | £191,239 | £151,630 | £107,194 |
| 2022-07 | £195,093 | £300,492 | £195,498 | £155,040 | £108,912 |
| 2022-08 | £195,254 | £300,463 | £195,610 | £155,555 | £108,480 |
| 2022-09 | £196,966 | £303,023 | £197,387 | £157,069 | £108,889 |
| 2022-10 | £196,476 | £302,938 | £196,753 | £156,475 | £108,538 |
| 2022-11 | £199,004 | £307,283 | £199,268 | £158,275 | £109,846 |
| 2022-12 | £200,455 | £309,410 | £200,760 | £159,380 | £110,873 |
| 2023-01 | £200,020 | £309,031 | £200,460 | £158,792 | £110,379 |
| 2023-02 | £197,840 | £306,448 | £198,180 | £156,684 | £109,322 |
| 2023-03 | £196,857 | £306,495 | £197,295 | £155,045 | £108,451 |
| 2023-04 | £197,568 | £308,190 | £198,022 | £155,310 | £108,869 |
| 2023-05 | £198,908 | £310,006 | £199,464 | £156,344 | £109,689 |
| 2023-06 | £196,051 | £304,655 | £196,463 | £154,682 | £108,076 |
| 2023-07 | £198,391 | £307,104 | £199,005 | £156,915 | £109,224 |
| 2023-08 | £199,680 | £308,499 | £200,350 | £158,396 | £109,349 |
| 2023-09 | £201,502 | £311,259 | £202,171 | £159,999 | £110,037 |
| 2023-10 | £198,491 | £306,363 | £198,978 | £157,802 | £108,670 |
| 2023-11 | £199,240 | £308,287 | £199,848 | £157,867 | £109,181 |
| 2023-12 | £201,473 | £311,495 | £202,229 | £159,458 | £110,739 |
| 2024-01 | £201,320 | £311,764 | £202,014 | £159,278 | £110,383 |
| 2024-02 | £200,665 | £309,391 | £201,457 | £159,245 | £110,109 |
| 2024-03 | £200,238 | £308,367 | £201,001 | £158,928 | £110,183 |
| 2024-04 | £200,424 | £307,583 | £201,301 | £159,310 | £110,578 |
| 2024-05 | £197,372 | £302,538 | £198,174 | £156,937 | £109,279 |
| 2024-06 | £195,988 | £299,989 | £196,777 | £156,332 | £107,983 |
| 2024-07 | £198,852 | £304,094 | £199,670 | £159,021 | £109,013 |
| 2024-08 | £203,332 | £311,049 | £204,111 | £162,998 | £110,749 |
| 2024-09 | £204,604 | £313,700 | £205,516 | £163,804 | £110,901 |
| 2024-10 | £204,635 | £314,769 | £205,277 | £163,518 | £111,163 |
| 2024-11 | £204,470 | £314,892 | £205,423 | £163,003 | £110,745 |
| 2024-12 | £207,355 | £319,873 | £208,258 | £165,203 | £112,139 |
| 2025-01 | £205,774 | £317,595 | £206,956 | £163,829 | £110,711 |
| 2025-02 | £203,529 | £314,204 | £204,440 | £162,229 | £109,697 |
| 2025-03 | £203,198 | £310,989 | £204,019 | £162,852 | £110,789 |
| 2025-04 | £201,767 | £309,690 | £202,710 | £161,154 | £109,836 |
| 2025-05 | £201,706 | £310,135 | £202,824 | £160,854 | £109,353 |
| 2025-06 | £199,948 | £309,317 | £201,437 | £158,833 | £106,821 |
| 2025-07 | £202,081 | £311,224 | £203,677 | £161,436 | £107,558 |
| 2025-08 | £205,300 | £315,273 | £207,136 | £164,364 | £109,092 |
| 2025-09 | £203,895 | £313,296 | £205,750 | £163,328 | £107,964 |
| 2025-10 | £203,856 | £313,008 | £205,849 | £163,112 | £108,178 |
| 2025-11 | £203,859 | £312,983 | £205,795 | £163,117 | £108,321 |
| 2025-12 | £204,265 | £312,782 | £206,357 | £163,691 | £108,591 |
| 2026-01 | £204,903 | £313,382 | £207,221 | £164,647 | £108,112 |
| 2026-02 | £202,910 | £310,485 | £205,413 | £162,975 | £106,646 |
| 2026-03 | £204,149 | £312,633 | £206,861 | £163,851 | £106,850 |
- All property types
- Detached
- Semi-detached
- Terraced
- Flats
Source: HM Land Registry House Price Index
| Year | All property types | Detached | Semi-detached | Terraced | Flats |
|---|---|---|---|---|---|
| 1996-01 | -0.4% | -0.5% | +0.4% | -1.4% | -2.0% |
| 1996-02 | -0.7% | -0.3% | -0.3% | -1.5% | -2.7% |
| 1996-03 | -1.9% | -1.1% | -1.3% | -3.1% | -4.7% |
| 1996-04 | -1.8% | -0.9% | -1.4% | -2.7% | -4.8% |
| 1996-05 | -1.3% | -0.4% | -1.0% | -2.1% | -4.7% |
| 1996-06 | -0.5% | +0.3% | -0.6% | -0.8% | -3.3% |
| 1996-07 | -0.4% | +0.2% | -0.5% | -0.7% | -3.0% |
| 1996-08 | -0.1% | +0.5% | -0.1% | -0.4% | -2.5% |
| 1996-09 | +3.0% | +4.2% | +3.0% | +2.4% | +0.2% |
| 1996-10 | +2.8% | +4.1% | +2.6% | +2.3% | -0.8% |
| 1996-11 | +3.9% | +5.0% | +3.6% | +3.7% | +0.4% |
| 1996-12 | +0.6% | +1.3% | +0.4% | +0.7% | -3.1% |
| 1997-01 | +0.5% | +0.8% | +0.2% | +0.8% | -2.7% |
| 1997-02 | -0.3% | +0.6% | -0.6% | -0.2% | -3.9% |
| 1997-03 | +1.2% | +2.0% | +0.6% | +1.6% | -1.3% |
| 1997-04 | +1.1% | +1.9% | +0.7% | +1.3% | -1.1% |
| 1997-05 | +2.3% | +2.9% | +2.1% | +2.3% | 0.0% |
| 1997-06 | +1.7% | +2.6% | +1.8% | +1.4% | -2.4% |
| 1997-07 | +4.8% | +5.8% | +4.7% | +4.5% | -0.1% |
| 1997-08 | +5.4% | +6.2% | +5.2% | +5.3% | +0.7% |
| 1997-09 | +6.4% | +6.6% | +6.4% | +6.5% | +2.7% |
| 1997-10 | +7.5% | +7.7% | +7.5% | +7.5% | +4.1% |
| 1997-11 | +6.1% | +6.7% | +6.1% | +5.9% | +2.0% |
| 1997-12 | +5.9% | +7.0% | +6.0% | +5.4% | +1.9% |
| 1998-01 | +4.2% | +5.4% | +4.2% | +3.6% | +0.4% |
| 1998-02 | +3.7% | +4.4% | +3.8% | +3.4% | +1.2% |
| 1998-03 | +2.7% | +3.2% | +2.8% | +2.4% | +0.3% |
| 1998-04 | +3.8% | +4.3% | +4.0% | +3.4% | +1.0% |
| 1998-05 | +4.6% | +5.2% | +4.7% | +4.3% | +1.6% |
| 1998-06 | +5.0% | +5.5% | +5.0% | +4.8% | +3.0% |
| 1998-07 | +3.2% | +3.6% | +3.2% | +3.0% | +2.1% |
| 1998-08 | +4.0% | +4.5% | +3.9% | +3.6% | +2.9% |
| 1998-09 | +4.6% | +5.2% | +4.5% | +4.1% | +3.4% |
| 1998-10 | +3.8% | +4.5% | +3.6% | +3.5% | +2.9% |
| 1998-11 | +2.6% | +3.4% | +2.6% | +2.0% | +2.1% |
| 1998-12 | +3.3% | +3.8% | +3.3% | +2.9% | +3.7% |
| 1999-01 | +3.8% | +4.0% | +4.1% | +3.3% | +4.3% |
| 1999-02 | +2.7% | +2.8% | +3.0% | +2.3% | +3.1% |
| 1999-03 | +2.6% | +2.9% | +2.9% | +2.0% | +3.1% |
| 1999-04 | +2.9% | +3.3% | +2.9% | +2.6% | +3.4% |
| 1999-05 | +4.1% | +4.5% | +4.2% | +3.7% | +4.6% |
| 1999-06 | +4.9% | +5.2% | +5.0% | +4.7% | +4.7% |
| 1999-07 | +4.9% | +5.4% | +4.9% | +4.7% | +4.6% |
| 1999-08 | +3.9% | +4.1% | +3.8% | +4.0% | +3.7% |
| 1999-09 | +4.8% | +5.2% | +4.6% | +5.0% | +5.2% |
| 1999-10 | +6.1% | +6.4% | +6.0% | +6.0% | +6.8% |
| 1999-11 | +8.8% | +8.8% | +8.6% | +9.0% | +9.9% |
| 1999-12 | +7.6% | +7.6% | +7.3% | +8.0% | +8.5% |
| 2000-01 | +9.1% | +9.4% | +8.6% | +9.4% | +9.3% |
| 2000-02 | +13.2% | +14.1% | +12.7% | +13.2% | +12.4% |
| 2000-03 | +15.2% | +15.9% | +14.9% | +15.1% | +13.0% |
| 2000-04 | +15.9% | +16.5% | +15.5% | +15.6% | +14.1% |
| 2000-05 | +11.1% | +11.7% | +10.8% | +10.6% | +10.1% |
| 2000-06 | +9.1% | +9.7% | +9.0% | +8.4% | +9.2% |
| 2000-07 | +9.1% | +10.0% | +9.3% | +8.0% | +8.9% |
| 2000-08 | +11.7% | +12.9% | +12.2% | +10.1% | +12.0% |
| 2000-09 | +11.8% | +13.4% | +12.3% | +9.8% | +11.6% |
| 2000-10 | +11.2% | +12.7% | +11.8% | +9.3% | +10.8% |
| 2000-11 | +8.9% | +10.8% | +9.4% | +7.2% | +7.9% |
| 2000-12 | +11.2% | +13.0% | +11.8% | +9.3% | +10.4% |
| 2001-01 | +11.4% | +13.0% | +11.8% | +9.8% | +11.6% |
| 2001-02 | +12.5% | +13.5% | +12.9% | +11.2% | +13.0% |
| 2001-03 | +7.5% | +8.4% | +7.7% | +6.7% | +8.5% |
| 2001-04 | +5.7% | +7.0% | +5.9% | +4.8% | +6.2% |
| 2001-05 | +8.7% | +9.9% | +8.8% | +8.0% | +9.6% |
| 2001-06 | +12.6% | +13.6% | +12.6% | +12.0% | +13.7% |
| 2001-07 | +14.9% | +15.3% | +14.9% | +14.5% | +16.8% |
| 2001-08 | +13.1% | +13.6% | +12.8% | +13.0% | +14.7% |
| 2001-09 | +12.7% | +13.0% | +12.4% | +12.9% | +14.2% |
| 2001-10 | +13.9% | +13.9% | +13.3% | +14.4% | +15.5% |
| 2001-11 | +16.3% | +15.9% | +15.9% | +16.6% | +18.2% |
| 2001-12 | +16.6% | +16.3% | +16.4% | +16.9% | +19.1% |
| 2002-01 | +14.9% | +14.9% | +14.9% | +14.8% | +17.4% |
| 2002-02 | +12.9% | +13.2% | +12.7% | +12.7% | +15.7% |
| 2002-03 | +17.1% | +17.3% | +17.0% | +17.0% | +19.9% |
| 2002-04 | +19.5% | +19.3% | +19.4% | +19.4% | +23.2% |
| 2002-05 | +20.6% | +20.2% | +20.7% | +20.4% | +24.1% |
| 2002-06 | +21.7% | +21.5% | +21.7% | +21.4% | +25.0% |
| 2002-07 | +22.5% | +22.4% | +22.4% | +22.5% | +25.4% |
| 2002-08 | +25.3% | +24.6% | +25.3% | +25.5% | +28.3% |
| 2002-09 | +26.0% | +24.9% | +26.6% | +25.9% | +28.7% |
| 2002-10 | +28.2% | +27.1% | +29.0% | +27.8% | +30.5% |
| 2002-11 | +29.8% | +28.9% | +30.3% | +29.6% | +31.7% |
| 2002-12 | +32.1% | +31.1% | +32.5% | +32.3% | +33.6% |
| 2003-01 | +37.1% | +35.5% | +37.2% | +37.8% | +38.7% |
| 2003-02 | +37.4% | +35.3% | +38.0% | +38.1% | +38.8% |
| 2003-03 | +36.9% | +35.2% | +37.3% | +37.5% | +38.6% |
| 2003-04 | +33.0% | +31.5% | +33.8% | +33.1% | +34.0% |
| 2003-05 | +33.9% | +32.8% | +34.5% | +33.9% | +34.7% |
| 2003-06 | +32.4% | +30.7% | +33.3% | +32.4% | +33.9% |
| 2003-07 | +31.1% | +28.7% | +32.0% | +31.4% | +32.8% |
| 2003-08 | +29.6% | +26.5% | +30.6% | +30.3% | +31.5% |
| 2003-09 | +29.3% | +25.7% | +30.1% | +30.6% | +30.7% |
| 2003-10 | +30.7% | +27.0% | +31.2% | +32.6% | +32.3% |
| 2003-11 | +30.7% | +26.5% | +31.2% | +32.7% | +32.2% |
| 2003-12 | +29.7% | +25.2% | +30.0% | +32.2% | +31.4% |
| 2004-01 | +26.7% | +22.4% | +27.1% | +29.0% | +28.1% |
| 2004-02 | +25.8% | +21.4% | +25.9% | +28.3% | +27.5% |
| 2004-03 | +24.1% | +19.7% | +24.2% | +26.7% | +26.2% |
| 2004-04 | +27.1% | +21.6% | +27.0% | +30.7% | +29.1% |
| 2004-05 | +28.6% | +22.1% | +28.2% | +33.1% | +30.9% |
| 2004-06 | +31.6% | +24.6% | +31.2% | +36.3% | +33.1% |
| 2004-07 | +30.2% | +23.6% | +29.9% | +34.7% | +31.5% |
| 2004-08 | +27.2% | +21.3% | +26.9% | +31.1% | +28.0% |
| 2004-09 | +26.5% | +21.1% | +26.1% | +30.3% | +27.5% |
| 2004-10 | +24.5% | +19.5% | +24.0% | +28.0% | +26.1% |
| 2004-11 | +22.9% | +18.1% | +22.3% | +26.4% | +25.0% |
| 2004-12 | +17.1% | +12.9% | +16.4% | +20.1% | +19.0% |
| 2005-01 | +15.7% | +11.6% | +14.9% | +18.7% | +17.9% |
| 2005-02 | +15.2% | +11.4% | +14.6% | +18.0% | +17.3% |
| 2005-03 | +18.5% | +14.5% | +18.1% | +21.1% | +20.8% |
| 2005-04 | +16.5% | +13.1% | +16.2% | +18.6% | +18.6% |
| 2005-05 | +12.0% | +9.6% | +11.6% | +13.5% | +13.8% |
| 2005-06 | +7.9% | +5.7% | +7.3% | +9.6% | +9.3% |
| 2005-07 | +5.7% | +3.8% | +5.0% | +7.2% | +7.1% |
| 2005-08 | +7.8% | +5.7% | +7.0% | +9.6% | +9.2% |
| 2005-09 | +3.9% | +2.0% | +3.1% | +5.5% | +5.6% |
| 2005-10 | +4.3% | +2.4% | +3.5% | +6.1% | +5.9% |
| 2005-11 | +0.9% | -1.1% | +0.1% | +2.6% | +2.1% |
| 2005-12 | +4.2% | +2.1% | +3.3% | +5.9% | +5.5% |
| 2006-01 | +2.2% | +0.1% | +1.5% | +3.9% | +2.9% |
| 2006-02 | +4.0% | +1.9% | +3.2% | +5.9% | +5.0% |
| 2006-03 | +3.4% | +1.5% | +2.6% | +5.1% | +3.9% |
| 2006-04 | +4.6% | +2.9% | +3.7% | +6.2% | +5.3% |
| 2006-05 | +6.4% | +4.8% | +5.9% | +7.9% | +6.6% |
| 2006-06 | +6.0% | +4.6% | +5.6% | +7.3% | +6.0% |
| 2006-07 | +6.8% | +5.4% | +6.4% | +8.3% | +6.5% |
| 2006-08 | +3.9% | +2.6% | +3.5% | +5.4% | +3.0% |
| 2006-09 | +5.3% | +4.0% | +5.0% | +6.9% | +4.2% |
| 2006-10 | +3.8% | +2.7% | +3.7% | +5.1% | +2.4% |
| 2006-11 | +7.3% | +6.2% | +7.2% | +8.4% | +5.5% |
| 2006-12 | +8.4% | +7.3% | +8.5% | +9.7% | +6.1% |
| 2007-01 | +12.8% | +11.6% | +12.9% | +13.9% | +10.5% |
| 2007-02 | +10.2% | +9.3% | +10.4% | +11.1% | +8.0% |
| 2007-03 | +8.1% | +7.2% | +8.2% | +9.2% | +6.1% |
| 2007-04 | +5.2% | +4.4% | +5.2% | +6.4% | +3.0% |
| 2007-05 | +6.2% | +5.0% | +5.9% | +7.7% | +4.3% |
| 2007-06 | +6.3% | +5.5% | +5.9% | +7.7% | +4.6% |
| 2007-07 | +7.4% | +6.9% | +7.0% | +8.5% | +6.2% |
| 2007-08 | +7.2% | +7.1% | +6.9% | +8.1% | +5.8% |
| 2007-09 | +7.6% | +7.4% | +7.3% | +8.6% | +6.3% |
| 2007-10 | +6.2% | +6.2% | +5.8% | +7.1% | +5.0% |
| 2007-11 | +4.1% | +4.2% | +3.6% | +4.8% | +3.2% |
| 2007-12 | +2.3% | +2.8% | +1.8% | +2.7% | +1.5% |
| 2008-01 | -0.7% | 0.0% | -1.1% | -0.4% | -1.2% |
| 2008-02 | +0.7% | +1.4% | +0.3% | +1.0% | -0.2% |
| 2008-03 | -1.7% | -1.0% | -1.9% | -1.5% | -2.5% |
| 2008-04 | -0.4% | +0.7% | -0.6% | -0.4% | -1.8% |
| 2008-05 | -3.6% | -2.3% | -3.7% | -3.9% | -5.0% |
| 2008-06 | -2.3% | -1.0% | -2.3% | -2.5% | -3.7% |
| 2008-07 | -4.5% | -3.6% | -4.3% | -4.9% | -5.9% |
| 2008-08 | -4.9% | -4.2% | -4.8% | -5.3% | -5.7% |
| 2008-09 | -8.9% | -7.7% | -8.9% | -9.4% | -9.5% |
| 2008-10 | -12.4% | -11.3% | -12.4% | -12.9% | -13.0% |
| 2008-11 | -14.5% | -13.5% | -14.4% | -15.0% | -15.3% |
| 2008-12 | -14.2% | -13.6% | -14.0% | -14.4% | -15.5% |
| 2009-01 | -12.5% | -11.7% | -12.4% | -12.7% | -13.9% |
| 2009-02 | -15.3% | -14.4% | -15.1% | -15.6% | -16.5% |
| 2009-03 | -16.3% | -15.4% | -16.2% | -16.7% | -16.4% |
| 2009-04 | -18.1% | -17.7% | -17.9% | -18.6% | -17.6% |
| 2009-05 | -16.4% | -16.1% | -16.2% | -16.8% | -15.9% |
| 2009-06 | -14.6% | -14.2% | -14.3% | -15.0% | -14.7% |
| 2009-07 | -11.3% | -10.8% | -11.2% | -11.4% | -12.1% |
| 2009-08 | -7.4% | -6.8% | -7.2% | -7.5% | -8.6% |
| 2009-09 | -4.1% | -4.2% | -3.8% | -4.0% | -5.7% |
| 2009-10 | +0.9% | +0.7% | +1.4% | +0.9% | -1.3% |
| 2009-11 | +3.6% | +3.4% | +3.9% | +4.0% | +0.9% |
| 2009-12 | +4.3% | +4.2% | +4.6% | +4.8% | +1.6% |
| 2010-01 | +2.8% | +2.9% | +3.1% | +3.4% | -0.9% |
| 2010-02 | +3.8% | +3.8% | +4.4% | +4.3% | -0.9% |
| 2010-03 | +5.6% | +6.2% | +6.2% | +5.9% | -0.2% |
| 2010-04 | +9.0% | +9.6% | +9.5% | +9.3% | +3.3% |
| 2010-05 | +8.3% | +9.4% | +8.6% | +8.3% | +3.1% |
| 2010-06 | +6.5% | +7.4% | +6.8% | +6.6% | +1.6% |
| 2010-07 | +3.8% | +4.9% | +4.0% | +3.8% | -0.8% |
| 2010-08 | +1.5% | +2.4% | +1.9% | +1.3% | -2.9% |
| 2010-09 | +1.1% | +2.4% | +1.4% | +0.6% | -3.2% |
| 2010-10 | -1.5% | -0.2% | -1.3% | -2.1% | -5.1% |
| 2010-11 | -1.5% | 0.0% | -1.3% | -2.3% | -4.4% |
| 2010-12 | -4.5% | -2.8% | -4.3% | -5.7% | -6.8% |
| 2011-01 | -3.7% | -2.2% | -3.4% | -4.9% | -4.9% |
| 2011-02 | -3.8% | -2.4% | -3.9% | -4.8% | -4.5% |
| 2011-03 | -1.1% | +0.1% | -1.2% | -1.9% | -1.7% |
| 2011-04 | -2.5% | -0.9% | -2.8% | -3.1% | -3.5% |
| 2011-05 | -2.3% | -1.0% | -2.4% | -2.9% | -3.2% |
| 2011-06 | -4.1% | -3.2% | -4.0% | -4.7% | -4.5% |
| 2011-07 | -2.7% | -2.3% | -2.5% | -3.3% | -2.3% |
| 2011-08 | -2.2% | -1.8% | -2.1% | -2.7% | -2.2% |
| 2011-09 | -0.9% | -0.7% | -0.8% | -1.1% | -1.0% |
| 2011-10 | +0.4% | +0.8% | +0.5% | +0.1% | -0.5% |
| 2011-11 | -1.2% | -1.1% | -1.0% | -1.5% | -1.6% |
| 2011-12 | +0.8% | +0.8% | +1.1% | +0.4% | +0.5% |
| 2012-01 | -1.0% | -1.4% | -0.5% | -1.1% | -1.5% |
| 2012-02 | +1.1% | +0.4% | +1.7% | +1.1% | -0.1% |
| 2012-03 | +0.5% | -1.1% | +1.2% | +1.0% | -0.6% |
| 2012-04 | +1.1% | -0.4% | +1.8% | +1.5% | +0.3% |
| 2012-05 | +0.6% | -0.5% | +1.2% | +1.0% | -0.3% |
| 2012-06 | +1.7% | +1.3% | +2.0% | +2.1% | +0.4% |
| 2012-07 | +0.8% | +0.4% | +1.0% | +1.4% | -1.0% |
| 2012-08 | -0.1% | -0.8% | 0.0% | +0.8% | -1.3% |
| 2012-09 | -2.7% | -3.4% | -2.5% | -2.1% | -3.6% |
| 2012-10 | -2.2% | -3.3% | -2.1% | -1.5% | -2.5% |
| 2012-11 | +0.1% | -0.8% | +0.2% | +0.9% | -0.7% |
| 2012-12 | +0.4% | -0.3% | +0.4% | +1.2% | -1.0% |
| 2013-01 | +2.6% | +2.3% | +2.6% | +3.1% | +0.8% |
| 2013-02 | +4.3% | +4.3% | +4.3% | +4.4% | +3.1% |
| 2013-03 | +4.4% | +5.1% | +4.4% | +4.1% | +3.2% |
| 2013-04 | +4.9% | +5.5% | +4.9% | +4.8% | +3.7% |
| 2013-05 | +3.2% | +3.4% | +3.3% | +3.1% | +1.9% |
| 2013-06 | +4.7% | +4.4% | +5.0% | +4.8% | +3.6% |
| 2013-07 | +5.1% | +5.0% | +5.4% | +5.2% | +4.3% |
| 2013-08 | +4.6% | +4.7% | +4.8% | +4.5% | +4.2% |
| 2013-09 | +4.9% | +5.0% | +5.0% | +4.6% | +4.3% |
| 2013-10 | +4.2% | +4.8% | +4.4% | +3.6% | +3.3% |
| 2013-11 | +3.0% | +3.7% | +3.2% | +2.3% | +1.6% |
| 2013-12 | +5.0% | +5.3% | +5.4% | +4.5% | +4.3% |
| 2014-01 | +4.5% | +4.4% | +4.6% | +4.3% | +4.4% |
| 2014-02 | +4.8% | +4.7% | +5.0% | +4.6% | +4.9% |
| 2014-03 | +2.9% | +2.7% | +3.2% | +2.9% | +2.7% |
| 2014-04 | +3.5% | +3.1% | +3.9% | +3.5% | +3.1% |
| 2014-05 | +5.1% | +4.5% | +5.5% | +5.2% | +4.4% |
| 2014-06 | +4.3% | +4.2% | +4.6% | +4.2% | +3.5% |
| 2014-07 | +3.3% | +3.4% | +3.7% | +3.1% | +2.3% |
| 2014-08 | +5.7% | +5.9% | +6.0% | +5.3% | +4.5% |
| 2014-09 | +8.1% | +7.9% | +8.4% | +8.0% | +7.3% |
| 2014-10 | +9.0% | +8.5% | +9.3% | +9.2% | +8.7% |
| 2014-11 | +9.5% | +8.8% | +9.8% | +9.6% | +9.5% |
| 2014-12 | +6.6% | +6.6% | +6.7% | +6.5% | +6.2% |
| 2015-01 | +6.3% | +6.5% | +6.5% | +6.1% | +5.8% |
| 2015-02 | +3.0% | +3.0% | +3.1% | +2.9% | +3.0% |
| 2015-03 | +4.2% | +4.1% | +4.3% | +3.9% | +4.6% |
| 2015-04 | +5.4% | +5.8% | +5.4% | +5.0% | +5.7% |
| 2015-05 | +5.6% | +6.4% | +5.8% | +4.9% | +5.5% |
| 2015-06 | +5.0% | +5.6% | +5.1% | +4.4% | +4.3% |
| 2015-07 | +4.4% | +4.7% | +4.7% | +3.7% | +4.0% |
| 2015-08 | +3.2% | +3.5% | +3.4% | +2.7% | +2.7% |
| 2015-09 | +2.9% | +3.5% | +3.1% | +2.2% | +2.4% |
| 2015-10 | +3.0% | +3.8% | +3.1% | +2.3% | +1.9% |
| 2015-11 | +3.1% | +4.0% | +3.2% | +2.5% | +1.9% |
| 2015-12 | +4.4% | +5.0% | +4.6% | +3.9% | +2.9% |
| 2016-01 | +4.1% | +4.5% | +4.4% | +3.7% | +2.8% |
| 2016-02 | +6.0% | +6.5% | +6.4% | +5.4% | +4.0% |
| 2016-03 | +5.9% | +6.4% | +6.2% | +5.5% | +4.3% |
| 2016-04 | +3.9% | +4.2% | +4.2% | +3.6% | +2.2% |
| 2016-05 | +4.3% | +4.4% | +4.5% | +4.4% | +3.4% |
| 2016-06 | +4.8% | +4.8% | +4.9% | +4.6% | +4.4% |
| 2016-07 | +6.8% | +7.0% | +6.7% | +6.8% | +6.7% |
| 2016-08 | +5.2% | +5.6% | +5.1% | +4.9% | +5.2% |
| 2016-09 | +5.1% | +5.1% | +5.2% | +4.9% | +4.9% |
| 2016-10 | +4.1% | +4.2% | +4.3% | +3.6% | +4.5% |
| 2016-11 | +4.9% | +5.3% | +5.1% | +4.3% | +5.5% |
| 2016-12 | +4.3% | +4.9% | +4.3% | +3.5% | +5.4% |
| 2017-01 | +4.8% | +5.7% | +4.6% | +4.0% | +5.7% |
| 2017-02 | +5.5% | +6.3% | +5.1% | +4.9% | +6.9% |
| 2017-03 | +5.4% | +6.1% | +5.1% | +4.8% | +6.6% |
| 2017-04 | +5.7% | +6.3% | +5.5% | +5.2% | +7.5% |
| 2017-05 | +4.8% | +5.4% | +4.8% | +4.0% | +6.2% |
| 2017-06 | +3.7% | +4.1% | +3.6% | +3.0% | +5.5% |
| 2017-07 | +2.6% | +2.8% | +2.7% | +1.8% | +4.1% |
| 2017-08 | +1.7% | +1.6% | +1.8% | +1.3% | +3.1% |
| 2017-09 | +1.7% | +1.8% | +1.7% | +1.4% | +2.9% |
| 2017-10 | +1.8% | +1.6% | +1.8% | +1.7% | +2.6% |
| 2017-11 | +2.6% | +2.2% | +2.7% | +2.6% | +3.1% |
| 2017-12 | +2.8% | +2.2% | +3.2% | +3.0% | +2.9% |
| 2018-01 | +4.2% | +3.5% | +4.7% | +4.3% | +4.4% |
| 2018-02 | +2.7% | +2.1% | +3.1% | +2.5% | +2.8% |
| 2018-03 | +2.7% | +2.2% | +3.1% | +2.6% | +2.4% |
| 2018-04 | +1.6% | +1.3% | +2.0% | +1.7% | +0.3% |
| 2018-05 | +2.1% | +2.0% | +2.5% | +2.5% | -0.3% |
| 2018-06 | +3.0% | +3.3% | +3.5% | +3.1% | +0.2% |
| 2018-07 | +3.6% | +4.1% | +4.0% | +3.5% | +0.8% |
| 2018-08 | +5.5% | +6.0% | +6.0% | +5.2% | +3.2% |
| 2018-09 | +5.8% | +6.3% | +6.3% | +5.7% | +3.7% |
| 2018-10 | +5.9% | +6.2% | +6.3% | +5.8% | +4.0% |
| 2018-11 | +5.6% | +5.9% | +6.0% | +5.7% | +3.3% |
| 2018-12 | +4.7% | +5.1% | +5.0% | +4.7% | +2.7% |
| 2019-01 | +3.3% | +3.9% | +3.6% | +3.2% | +0.8% |
| 2019-02 | +2.8% | +3.4% | +3.1% | +2.5% | +0.6% |
| 2019-03 | +3.6% | +4.2% | +4.1% | +3.3% | +1.3% |
| 2019-04 | +5.0% | +5.3% | +5.4% | +4.6% | +3.3% |
| 2019-05 | +3.9% | +4.0% | +4.3% | +3.6% | +2.6% |
| 2019-06 | +2.5% | +2.6% | +2.7% | +2.4% | +1.5% |
| 2019-07 | +1.3% | +1.3% | +1.5% | +1.4% | +0.5% |
| 2019-08 | +1.7% | +1.6% | +1.9% | +1.9% | +0.5% |
| 2019-09 | +0.6% | +0.4% | +0.7% | +1.0% | -0.2% |
| 2019-10 | +1.5% | +1.1% | +1.7% | +1.8% | +0.4% |
| 2019-11 | +0.2% | -0.2% | +0.6% | +0.3% | -0.4% |
| 2019-12 | +2.5% | +2.2% | +3.0% | +2.6% | +0.9% |
| 2020-01 | +2.1% | +1.7% | +2.4% | +2.4% | +0.5% |
| 2020-02 | +2.0% | +1.5% | +2.4% | +2.5% | -0.1% |
| 2020-03 | +0.4% | -0.2% | +0.7% | +0.9% | -0.9% |
| 2020-04 | -1.0% | -1.2% | -0.8% | -0.7% | -3.0% |
| 2020-05 | 0.0% | +0.3% | +0.2% | -0.1% | -1.4% |
| 2020-06 | +0.8% | +1.1% | +1.1% | +0.7% | -1.0% |
| 2020-07 | +2.7% | +2.7% | +3.1% | +2.6% | +1.5% |
| 2020-08 | +3.1% | +3.0% | +3.6% | +3.0% | +1.5% |
| 2020-09 | +4.3% | +4.4% | +4.8% | +3.9% | +2.2% |
| 2020-10 | +4.9% | +5.3% | +5.1% | +4.6% | +2.4% |
| 2020-11 | +6.0% | +6.4% | +5.8% | +6.2% | +3.9% |
| 2020-12 | +5.6% | +5.9% | +5.2% | +6.1% | +4.3% |
| 2021-01 | +7.3% | +6.8% | +7.1% | +8.2% | +7.4% |
| 2021-02 | +9.5% | +8.4% | +9.4% | +10.8% | +10.7% |
| 2021-03 | +11.0% | +9.1% | +10.9% | +12.7% | +13.1% |
| 2021-04 | +11.7% | +9.6% | +11.5% | +13.5% | +14.9% |
| 2021-05 | +10.9% | +8.9% | +10.7% | +12.9% | +14.0% |
| 2021-06 | +11.7% | +9.5% | +11.3% | +14.1% | +15.4% |
| 2021-07 | +10.8% | +9.1% | +10.4% | +12.9% | +13.0% |
| 2021-08 | +9.8% | +8.3% | +9.5% | +11.5% | +11.7% |
| 2021-09 | +9.5% | +7.9% | +9.4% | +10.9% | +11.2% |
| 2021-10 | +9.4% | +8.1% | +9.3% | +10.5% | +11.1% |
| 2021-11 | +9.9% | +8.8% | +10.0% | +10.7% | +11.2% |
| 2021-12 | +7.9% | +7.4% | +8.0% | +8.1% | +8.5% |
| 2022-01 | +6.4% | +6.0% | +6.5% | +6.7% | +5.6% |
| 2022-02 | +5.4% | +5.5% | +5.5% | +5.3% | +3.7% |
| 2022-03 | +7.0% | +7.9% | +7.2% | +6.3% | +3.6% |
| 2022-04 | +8.0% | +8.8% | +8.3% | +7.3% | +4.5% |
| 2022-05 | +9.5% | +10.1% | +10.0% | +9.0% | +5.9% |
| 2022-06 | +8.6% | +9.2% | +9.1% | +8.0% | +4.9% |
| 2022-07 | +9.7% | +9.8% | +10.2% | +9.5% | +5.9% |
| 2022-08 | +9.1% | +9.1% | +9.5% | +9.2% | +5.4% |
| 2022-09 | +9.7% | +9.6% | +10.0% | +10.3% | +6.1% |
| 2022-10 | +9.0% | +8.5% | +9.3% | +9.8% | +6.0% |
| 2022-11 | +9.3% | +8.7% | +9.7% | +10.2% | +6.5% |
| 2022-12 | +10.7% | +9.4% | +11.1% | +11.8% | +8.8% |
| 2023-01 | +10.7% | +10.1% | +11.0% | +11.3% | +8.7% |
| 2023-02 | +8.7% | +8.7% | +9.0% | +8.9% | +6.6% |
| 2023-03 | +6.6% | +7.1% | +6.8% | +6.5% | +4.5% |
| 2023-04 | +5.6% | +6.3% | +5.9% | +5.1% | +3.5% |
| 2023-05 | +5.2% | +5.9% | +5.4% | +4.5% | +3.5% |
| 2023-06 | +2.6% | +3.2% | +2.7% | +2.0% | +0.8% |
| 2023-07 | +1.7% | +2.2% | +1.8% | +1.2% | +0.3% |
| 2023-08 | +2.3% | +2.7% | +2.4% | +1.8% | +0.8% |
| 2023-09 | +2.3% | +2.7% | +2.4% | +1.9% | +1.1% |
| 2023-10 | +1.0% | +1.1% | +1.1% | +0.8% | +0.1% |
| 2023-11 | +0.1% | +0.3% | +0.3% | -0.3% | -0.6% |
| 2023-12 | +0.5% | +0.7% | +0.7% | 0.0% | -0.1% |
| 2024-01 | +0.6% | +0.9% | +0.8% | +0.3% | 0.0% |
| 2024-02 | +1.4% | +1.0% | +1.7% | +1.6% | +0.7% |
| 2024-03 | +1.7% | +0.6% | +1.9% | +2.5% | +1.6% |
| 2024-04 | +1.4% | -0.2% | +1.7% | +2.6% | +1.6% |
| 2024-05 | -0.8% | -2.4% | -0.6% | +0.4% | -0.4% |
| 2024-06 | 0.0% | -1.5% | +0.2% | +1.1% | -0.1% |
| 2024-07 | +0.2% | -1.0% | +0.3% | +1.3% | -0.2% |
| 2024-08 | +1.8% | +0.8% | +1.9% | +2.9% | +1.3% |
| 2024-09 | +1.5% | +0.8% | +1.7% | +2.4% | +0.8% |
| 2024-10 | +3.1% | +2.7% | +3.2% | +3.6% | +2.3% |
| 2024-11 | +2.6% | +2.1% | +2.8% | +3.3% | +1.4% |
| 2024-12 | +2.9% | +2.7% | +3.0% | +3.6% | +1.3% |
| 2025-01 | +2.2% | +1.9% | +2.4% | +2.9% | +0.3% |
| 2025-02 | +1.4% | +1.6% | +1.5% | +1.9% | -0.4% |
| 2025-03 | +1.5% | +0.9% | +1.5% | +2.5% | +0.5% |
| 2025-04 | +0.7% | +0.7% | +0.7% | +1.2% | -0.7% |
| 2025-05 | +2.2% | +2.6% | +2.4% | +2.5% | +0.1% |
| 2025-06 | +2.1% | +3.2% | +2.4% | +1.7% | -1.0% |
| 2025-07 | +1.7% | +2.4% | +2.1% | +1.6% | -1.3% |
| 2025-08 | +1.0% | +1.4% | +1.5% | +0.8% | -1.5% |
| 2025-09 | -0.3% | -0.1% | +0.1% | -0.3% | -2.6% |
| 2025-10 | -0.4% | -0.6% | +0.3% | -0.2% | -2.7% |
| 2025-11 | -0.3% | -0.6% | +0.2% | +0.1% | -2.2% |
| 2025-12 | -1.5% | -2.2% | -0.9% | -0.9% | -3.2% |
| 2026-01 | -0.4% | -1.3% | +0.1% | +0.5% | -2.3% |
| 2026-02 | -0.3% | -1.2% | +0.5% | +0.5% | -2.8% |
| 2026-03 | +0.5% | +0.5% | +1.4% | +0.6% | -3.6% |
Source: HM Land Registry House Price Index for Derby
Sold House Prices in Derby
The average sold price in Derby is £204,149, which is 29.6% below the England average of £289,946. That discount runs through every property type, widest on flats and narrowest on semi-detached homes. The figures below come from Land Registry sold-price data for March 2026.
| Property Type | Derby Average | England Average | Difference |
|---|---|---|---|
| Detached houses | £312,633 | £470,492 | -33.6% |
| Semi-detached houses | £206,861 | £288,185 | -28.2% |
| Terraced houses | £163,851 | £243,788 | -32.8% |
| Flats and maisonettes | £106,850 | £214,563 | -50.2% |
| All property types | £204,149 | £289,946 | -29.6% |
Detached houses average £312,633 in Derby, a 33.6% discount to the England figure of £470,492. The detached stock concentrates in the outer postcodes where it makes up more than half of all homes, from DE3 (Mickleover) and DE74 (Castle Donington) to DE73 (Chellaston). Annual growth on detached homes was 0.5% to March 2026, in line with the city as a whole.
Semi-detached houses at £206,861 sit 28.2% below the England average of £288,185, the narrowest gap of any type. Semis are the backbone of Derby's middle market, spread thickly across DE24 (Alvaston), DE21 (Chaddesden) and DE23 (Littleover), and they posted the strongest annual growth of any type at 1.4%.
Terraced houses average £163,851, a 32.8% discount to England's £243,788. Terraced stock runs from the Victorian streets of inner DE1 and DE23 to newer rows further out, and the heaviest concentration sits in DE24 at 26.9% of stock. Terraced prices rose 0.6% over the year, and this is the type that does most of the work for a yield-focused let.
Flats and maisonettes average £106,850, a 50.2% discount, the widest gap in the table. Derby's flat market is small and centres on DE1, where purpose-built and converted flats make up 30.4% of stock, far above any other district. Flats were the only type to fall over the year, down 3.6%, partly because new build coming through the city-centre schemes is reshaping that end of the market. The England flat average is pulled up heavily by London, so a discount of this size is common across Midlands cities.
Price Per Square Foot in Derby
Floor space in Derby costs between £232 per square foot in DE23 and £301 in DE3, a spread of £69 across the 9 postcodes. Measuring by the square foot strips out how big the homes are, so it compares the underlying value of one district against another rather than house against flat. These are sold-price figures, showing what buyers actually paid per square foot.
| Rank | Area | Price Per Sq Ft |
|---|---|---|
| 1 | DE23 (Littleover, Sunny Hill, Normanton) | £232 |
| 2 | DE24 (Alvaston, Sinfin, Shelton Lock) | £239 |
| 3 | DE1 (City Centre) | £243 |
| 4 | DE21 (Chaddesden, Oakwood, Spondon) | £259 |
| 5 | DE22 (Allestree, Mackworth, Darley Abbey) | £259 |
| 6 | DE74 (Castle Donington, Kegworth) | £286 |
| 7 | DE72 (Borrowash, Ockbrook) | £288 |
| 8 | DE73 (Chellaston, Melbourne) | £294 |
| 9 | DE3 (Mickleover) | £301 |
DE23 (Littleover, Sunny Hill, Normanton) is the cheapest space in Derby at £232 per square foot, with DE24 (Alvaston, Sinfin, Shelton Lock) just above at £239. Both lean on dense terraced and semi-detached stock towards the south of the city, the kind of housing where a lower cost per square foot can lift the return on each pound spent. DE1 (City Centre) at £243 sits with them, held down by the city-centre flat stock that trades below suburban houses.
DE3 (Mickleover) commands the dearest space at £301 per square foot. Mickleover is a popular family suburb with good schools and a village feel, which puts a premium on each square foot. DE73 (Chellaston, Melbourne) at £294 and DE72 (Borrowash, Ockbrook) at £288 follow on the same suburban logic.
For Sale Asking Prices in Derby
Sellers in Derby are listing between £177,372 in DE1 and £376,166 in DE73, a spread of £198,794, with a city-wide mean of £282,243. These are current asking prices, what sellers hope to achieve rather than what has completed, so they sit above the Land Registry sold figures.
| Rank | Area | Asking Price |
|---|---|---|
| 1 | DE1 (City Centre) | £177,372 |
| 2 | DE24 (Alvaston, Sinfin, Shelton Lock) | £202,665 |
| 3 | DE21 (Chaddesden, Oakwood, Spondon) | £239,795 |
| 4 | DE23 (Littleover, Sunny Hill, Normanton) | £273,694 |
| 5 | DE22 (Allestree, Mackworth, Darley Abbey) | £281,276 |
| 6 | DE3 (Mickleover) | £304,506 |
| 7 | DE74 (Castle Donington, Kegworth) | £335,804 |
| 8 | DE72 (Borrowash, Ockbrook) | £348,907 |
| 9 | DE73 (Chellaston, Melbourne) | £376,166 |
DE1 (City Centre) at £177,372 is the cheapest way into Derby, 52.8% below DE73 and well under the city mean of £282,243. That low entry is what drives DE1's top yield of 5.8%. The three regeneration schemes at Becketwell, Castleward and Friar Gate Goods Yard all sit inside DE1, so new-build supply is rising and the stock is shifting from dated conversions towards purpose-built apartments. Browse current investment properties listings for available stock.
At the top of the table, DE73 (Chellaston, Melbourne) lists at £376,166, the premium end of Derby: a suburb of larger detached homes with good road links to the A50, where Melbourne adds period village stock that commands more again. Buyers there are taking a lower-yield, capital-weighted position.
House Price Growth in Derby
Five-year asking-price growth across Derby's postcodes runs from 22.2% in DE24 down to -2.2% in DE1, and the one-year column is mixed, with five of the nine districts in negative territory. The table ranks all 9 postcodes by five-year growth.
| Area | 1 Year | 3 Years | 5 Years |
|---|---|---|---|
| DE24 (Alvaston, Sinfin, Shelton Lock) | -4.7% | 3.4% | 22.2% |
| DE22 (Allestree, Mackworth, Darley Abbey) | -4.2% | 7.6% | 18.1% |
| DE3 (Mickleover) | 0.1% | 1.8% | 15.8% |
| DE21 (Chaddesden, Oakwood, Spondon) | 1.1% | 4.7% | 13.9% |
| DE74 (Castle Donington, Kegworth) | 0.9% | -6.2% | 11.7% |
| DE23 (Littleover, Sunny Hill, Normanton) | -1.7% | -0.2% | 8.8% |
| DE72 (Borrowash, Ockbrook) | 1.3% | -7.7% | 6.2% |
| DE73 (Chellaston, Melbourne) | -1.1% | -2.7% | 6.0% |
| DE1 (City Centre) | -1.7% | -1.3% | -2.2% |
DE24 (Alvaston, Sinfin, Shelton Lock) leads on five-year growth at 22.2%, even though its one-year reading has pulled back to -4.7%. The five-year strength came from the affordable south of the city catching the pandemic surge from a low base, and the recent softness is a pause on top of that run rather than a reversal. DE22 (Allestree, Mackworth, Darley Abbey) is close behind at 18.1% over five years and 7.6% over three, the steadiest medium-term record in the table, backed by Allestree's sought-after schools and the new build around Mackworth.
DE1 (City Centre) has the weakest record at -2.2% over five years and -1.7% over one. The wave of regeneration-driven new build coming into DE1 is adding supply faster than the existing flat stock can absorb, which holds resale values flat. For a yield investor that matters less, because DE1's return comes from the 5.8% yield and the low asking price rather than from price growth. For a growth investor, DE24 and DE22 are the different proposition.
Monthly Property Sales in Derby
Derby sees a combined 274 sales a month across the 9 postcodes, with individual volumes from 15 in DE1 to 52 in DE21. Turnover, monthly sales as a share of the homes advertised for sale, runs from 8% in DE1 to 30% in DE24. A higher turnover means monthly sales are a larger share of what is advertised.
| Area | Sales Per Month | Turnover | Asking Price |
|---|---|---|---|
| DE21 (Chaddesden, Oakwood, Spondon) | 52 | 22% | £239,795 |
| DE22 (Allestree, Mackworth, Darley Abbey) | 50 | 18% | £281,276 |
| DE24 (Alvaston, Sinfin, Shelton Lock) | 49 | 30% | £202,665 |
| DE23 (Littleover, Sunny Hill, Normanton) | 35 | 18% | £273,694 |
| DE72 (Borrowash, Ockbrook) | 21 | 13% | £348,907 |
| DE73 (Chellaston, Melbourne) | 20 | 10% | £376,166 |
| DE3 (Mickleover) | 16 | 13% | £304,506 |
| DE74 (Castle Donington, Kegworth) | 16 | 14% | £335,804 |
| DE1 (City Centre) | 15 | 8% | £177,372 |
DE21 (Chaddesden, Oakwood, Spondon) is the busiest market at 52 sales a month, with DE24 (Alvaston, Sinfin, Shelton Lock) close behind on volume and the highest turnover in the city at 30%. These are the affordable eastern and southern suburbs where each month's sales clear a large share of what is advertised, which gives an investor a wide choice on the way in and a ready market on the way out.
DE1 (City Centre) records 15 sales a month and the lowest turnover at 8%. Part of that is the stock: city-centre property is weighted towards flats, and the new build at Becketwell and Castleward has not yet fully fed through into the resale market. A thin resale market is the trade-off that comes with DE1's low asking price and top yield.
How Long Properties Take to Sell in Derby
DE24 (Alvaston, Sinfin, Shelton Lock) clears fastest at around 105 days, while DE1 (City Centre) sits longest at roughly 338 days, more than three times as long. Days on market is the typical time a home is listed before it sells; the months of unsold stock shows how much for-sale supply is queued at the current rate of sales. Together they tell you how quickly your money comes back out when you sell.
| Area | Avg Days to Sell | Months of Unsold Stock | Market |
|---|---|---|---|
| DE24 (Alvaston, Sinfin, Shelton Lock) | 105 | 3.4 | Seller's market |
| DE21 (Chaddesden, Oakwood, Spondon) | 138 | 4.5 | Seller's market |
| DE22 (Allestree, Mackworth, Darley Abbey) | 179 | 5.9 | Seller's market |
| DE23 (Littleover, Sunny Hill, Normanton) | 179 | 5.9 | Seller's market |
| DE3 (Mickleover) | 217 | 7.1 | Balanced market |
| DE74 (Castle Donington, Kegworth) | 217 | 7.1 | Balanced market |
| DE72 (Borrowash, Ockbrook) | 234 | 7.7 | Balanced market |
| DE73 (Chellaston, Melbourne) | 304 | 10.0 | Balanced market |
| DE1 (City Centre) | 338 | 11.1 | Balanced market |
There is a real tension here worth naming. DE1 carries the top yield in Derby but also the slowest exit, at 11.1 months of unsold stock against DE24's 3.4. The affordable southern and eastern suburbs that clear in three to four months give a quicker way out than the city-centre flats, so a buyer chasing the DE1 yield is also accepting the longest wait at the point of sale. The four faster postcodes all sit in the city's mid-priced belt, where ordinary family stock moves at a steady pace.
What Type of Property Can You Buy in Derby?
Detached homes are the largest single category in most of Derby, peaking at 52.5% of stock in DE74, while flats are heavily concentrated in DE1 at 30.4% against single figures almost everywhere else. The mix of housing decides which strategy fits each postcode. The shares quoted here and in the table are the housing-type breakdown a commercial property-data provider reports for each postcode district, which it describes as Census-based. The Census release and the areas behind each figure are not specified in the data we hold, so read the percentages as the provider's reported figures rather than verified proportions of all the homes in the district.
| Area | Detached | Semi-detached | Terraced | Flats |
|---|---|---|---|---|
| DE1 (City Centre) | 26.0% | 24.2% | 19.3% | 30.4% |
| DE21 (Chaddesden, Oakwood, Spondon) | 39.2% | 39.1% | 12.2% | 9.0% |
| DE22 (Allestree, Mackworth, Darley Abbey) | 46.3% | 27.2% | 10.9% | 15.6% |
| DE23 (Littleover, Sunny Hill, Normanton) | 33.9% | 34.4% | 18.3% | 13.3% |
| DE24 (Alvaston, Sinfin, Shelton Lock) | 19.8% | 40.4% | 26.9% | 11.9% |
| DE3 (Mickleover) | 51.2% | 35.6% | 9.2% | 4.0% |
| DE72 (Borrowash, Ockbrook) | 45.1% | 33.8% | 11.8% | 7.4% |
| DE73 (Chellaston, Melbourne) | 51.4% | 28.2% | 13.9% | 5.2% |
| DE74 (Castle Donington, Kegworth) | 52.5% | 28.1% | 12.7% | 4.6% |
DE1 is the outlier and the reason it works for buy-to-let. Flats make up 30.4% of its stock and terraced houses another 19.3%, the smaller-unit market that suits single lets and student sharers, and it lines up with DE1 carrying the lowest asking price and the highest yield in the city. DE24 (Alvaston, Sinfin, Shelton Lock) holds the most terraced stock at 26.9%, the affordable family lets that drive its high turnover.
At the other end, DE74 (Castle Donington), DE3 (Mickleover) and DE73 (Chellaston) are detached-dominated at better than half their stock, with flats down at 4% to 5%. That is owner-occupier territory, family houses bought to live in rather than the smaller units that carry rental income, which matches the premium prices and the lower yields in those districts.
Flats here cover both purpose-built blocks and conversions. A small share of mobile and temporary dwellings is left out, so rows may not add to 100%.
Derby Rental Market Analysis
Monthly rents across Derby run from £856 in DE1 to £1,205 in DE3, with gross yields from 3.3% to 5.8% across all 9 postcodes. For investors asking whether rental property is a worthwhile investment in Derby, the sections below break down rents, yields and tenant affordability district by district. If you are looking at how to start a property business in the East Midlands, Derby's affordable prices and complete data coverage make it easy to model returns across the whole city. Browse current buy-to-let property for sale in the region.
Average Rent & Gross Rental Yields in Derby
Gross yields in Derby split cleanly by price: the affordable city centre and southern suburbs top the table, the premium outer districts sit at the bottom. DE1 leads at 5.8% on the lowest asking price, while DE72 and DE73 trail at 3.3% despite charging strong rents. The table ranks all 9 postcodes by yield.
| Area | Average Monthly Rent | Asking Price | Gross Yield |
|---|---|---|---|
| DE1 (City Centre) | £856 | £177,372 | 5.8% |
| DE24 (Alvaston, Sinfin, Shelton Lock) | £868 | £202,665 | 5.1% |
| DE21 (Chaddesden, Oakwood, Spondon) | £946 | £239,795 | 4.7% |
| DE3 (Mickleover) | £1,205 | £304,506 | 4.7% |
| DE22 (Allestree, Mackworth, Darley Abbey) | £1,018 | £281,276 | 4.3% |
| DE23 (Littleover, Sunny Hill, Normanton) | £895 | £273,694 | 3.9% |
| DE74 (Castle Donington, Kegworth) | £1,068 | £335,804 | 3.8% |
| DE72 (Borrowash, Ockbrook) | £965 | £348,907 | 3.3% |
| DE73 (Chellaston, Melbourne) | £1,038 | £376,166 | 3.3% |
DE1 (City Centre) delivers the top yield at 5.8%, and it gets there on the lowest asking price rather than the highest rent. At £856 a month the rent is the cheapest in Derby, but against a £177,372 asking price it still produces the best return in the city. That is the classic city-centre pattern: affordable flats and student-adjacent stock generating a strong percentage on a smaller outlay. DE24 (Alvaston, Sinfin, Shelton Lock) follows at 5.1% on the same affordable logic, with the bonus of the fastest selling times in the city.
DE3 (Mickleover) charges the highest rent in Derby at £1,205 a month, yet yields 4.7% because its £304,506 asking price absorbs that premium. The pattern holds at the bottom of the table: DE72 and DE73 take strong rents of £965 and £1,038 but sit on the dearest asking prices in the city, which drops both to 3.3%. A £1,038 rent on a £376,166 home and an £856 rent on a £177,372 home are two very different investments wearing the same label.
Is Derby Rent High?
Rent in Derby takes between 28.2% and 39.7% of the local median gross salary, depending on the postcode. The widely used affordability mark is 30% of gross income, and three of the nine districts sit below it. This measures how much of a typical Derby wage a single tenancy would absorb in each area.
The median gross weekly salary in Derby is £733.50, and the median annual salary is £36,428, about £3,036 a month. That is marginally above the East Midlands median of £720.80 a week and below the Great Britain median of £766.60. Data from the Nomis Labour Market Profile (ASHE 2025).
| Rank | Area | Rent as % of Income |
|---|---|---|
| 1 | DE3 (Mickleover) | 39.7% |
| 2 | DE74 (Castle Donington, Kegworth) | 35.2% |
| 3 | DE73 (Chellaston, Melbourne) | 34.2% |
| 4 | DE22 (Allestree, Mackworth, Darley Abbey) | 33.5% |
| 5 | DE72 (Borrowash, Ockbrook) | 31.8% |
| 6 | DE21 (Chaddesden, Oakwood, Spondon) | 31.2% |
| 7 | DE23 (Littleover, Sunny Hill, Normanton) | 29.5% |
| 8 | DE24 (Alvaston, Sinfin, Shelton Lock) | 28.6% |
| 9 | DE1 (City Centre) | 28.2% |
DE3 (Mickleover) tops the affordability-pressure table at 39.7% of income. Its £1,205 rent is the highest in the city, so even against the Derby median wage it absorbs the largest share, and the tenants who take it tend to be dual-income households paying for the schools and suburban setting. DE74 and DE73 follow on the same premium-suburb logic.
DE1 (City Centre), DE24 (Alvaston, Sinfin, Shelton Lock) and DE23 (Littleover, Sunny Hill, Normanton) form an affordable band below 30%. DE1 at 28.2% pairs the cheapest rent in the city with the median wage, which keeps it comfortably under the threshold. These inner and southern districts are where a tenant on a typical Derby salary has the most headroom, which supports steady demand and lower void risk.
How Big Is Derby's Private Rented Sector?
The private rented sector is deepest in DE1 and DE22, where it houses 28.8% and 27.2% of households, and thinnest in DE3 at 9.1%. The share of homes already let privately is a guide to the size of the established tenant pool and how tested the local lettings market is. The table shows household tenure by postcode.
| Area | Owned Outright | Owned with Mortgage | Private Rented | Social Rented |
|---|---|---|---|---|
| DE1 (City Centre) | 26.0% | 24.9% | 28.8% | 18.8% |
| DE22 (Allestree, Mackworth, Darley Abbey) | 35.4% | 27.1% | 27.2% | 9.5% |
| DE24 (Alvaston, Sinfin, Shelton Lock) | 25.4% | 28.5% | 20.4% | 24.9% |
| DE23 (Littleover, Sunny Hill, Normanton) | 33.0% | 30.7% | 20.3% | 14.8% |
| DE73 (Chellaston, Melbourne) | 45.0% | 28.8% | 18.4% | 7.1% |
| DE21 (Chaddesden, Oakwood, Spondon) | 41.5% | 29.3% | 15.8% | 12.5% |
| DE74 (Castle Donington, Kegworth) | 42.1% | 35.0% | 13.4% | 8.4% |
| DE72 (Borrowash, Ockbrook) | 45.9% | 32.3% | 12.9% | 8.2% |
| DE3 (Mickleover) | 39.0% | 45.2% | 9.1% | 5.6% |
DE1 has the largest private rented sector at 28.8% of households, which fits a city-centre district built on flats, students and young professionals; close to three in ten homes already let privately points to a deep, proven market rather than an untested one. DE22 (Allestree) is the surprise at 27.2%, a sought-after suburb that nonetheless carries a sizeable rented pool around the university corridor.
At the bottom, DE3 (Mickleover) at 9.1% and DE72 (Borrowash) at 12.9% are owner-occupier strongholds where the rented market is shallow. DE24 (Alvaston, Sinfin, Shelton Lock) is worth a note: a 20.4% rented share sits alongside the highest social-rented figure in the city at 24.9%, so the private market there shares the ground with a large social sector. On the rental-listing data, DE23 currently reads as a landlord's market with homes letting in around 59 days, while DE1, DE22 and DE24 sit more balanced; the other districts carry too few live listings to read with confidence.
Local Housing Allowance Rates in Derby
Most of Derby falls within the Derby Broad Rental Market Area, where Local Housing Allowance runs from £82.81 a week for a shared room to £215.18 a week for a four-bedroom home; only DE74 (Castle Donington, Kegworth) sits in the higher Leicester area. Local Housing Allowance is the most a tenant on housing support can claim towards rent, so any rent above that level is met from the tenant's own income. The rates below cover the eight Derby-area postcodes. To check the current rate for a specific address, use the government's official Local Housing Allowance calculator.
| Property Size | Weekly LHA Rate | Monthly Equivalent |
|---|---|---|
| Shared accommodation | £82.81 | £359 |
| 1 bedroom | £103.56 | £449 |
| 2 bedrooms | £136.93 | £593 |
| 3 bedrooms | £161.10 | £698 |
| 4 bedrooms | £215.18 | £932 |
The two-bedroom Derby rate of £136.93 a week works out at about £593 a month, comfortably below the £856 to £1,205 open-market rents recorded across the city's postcodes. A benefit-backed tenancy at the LHA rate therefore sits under Derby's market rents, and the stock that fits within those rates concentrates in the affordable inner districts, DE1, DE24 and DE23, where asking prices and rents are lowest. DE74 is the exception: Castle Donington and Kegworth fall inside the Leicester market area, where the rates run higher, from £91.00 a week for a shared room to £241.64 for four bedrooms, so an investor pricing a benefit-backed let there should work to those figures rather than the Derby ones.
Buy-to-Let Considerations
Are House Prices High in Derby? Price-to-Earnings Ratios
Buying in Derby takes between 4.9 and 10.3 times the median annual salary. This uses the Nomis Labour Market Profile for Derby, which puts the median gross annual income for Derby residents at £36,428.
The national benchmark for price-to-earnings is 7.4 times (England's average sold price of £289,946 divided by the Great Britain median salary of £39,125). Four of Derby's nine postcodes sit below that benchmark, meaning they are more affordable against local incomes than the England average is against national ones.
| Rank | Area | Price-to-Earnings Ratio |
|---|---|---|
| 1 | DE1 (City Centre) | 4.9x |
| 2 | DE24 (Alvaston, Sinfin, Shelton Lock) | 5.6x |
| 3 | DE21 (Chaddesden, Oakwood, Spondon) | 6.6x |
| 4 | DE23 (Littleover, Sunny Hill, Normanton) | 7.5x |
| 5 | DE22 (Allestree, Mackworth, Darley Abbey) | 7.7x |
| 6 | DE3 (Mickleover) | 8.4x |
| 7 | DE74 (Castle Donington, Kegworth) | 9.2x |
| 8 | DE72 (Borrowash, Ockbrook) | 9.6x |
| 9 | DE73 (Chellaston, Melbourne) | 10.3x |
DE1 (City Centre) at 4.9 times income is among the most affordable postcodes anywhere in the East Midlands. An asking price of £177,372 against a £36,428 median salary means a home here costs under five years' gross income, well below the national 7.4 mark. DE24 (Alvaston, Sinfin, Shelton Lock) at 5.6 times keeps the southern suburbs in the affordable band too.
DE73 (Chellaston, Melbourne) sits at the other end at 10.3 times income. At more than ten years' gross salary, this postcode is priced above both the local and national benchmarks, reflecting the family housing stock and village character that pull in owner-occupiers rather than yield-driven investors. DE72 (Borrowash, Ockbrook) at 9.6 times shows the same profile. Read these alongside the buy to let costs to see the total investment required.
Deposit Requirements in Derby
A 30% buy-to-let deposit in Derby runs from £53,212 in DE1 to £112,850 in DE73. A 30% deposit is the assumption used across this guide because it reflects typical buy-to-let lending and secures more competitive rates. Use our stamp duty calculator to estimate the full upfront cost including tax.
| Rank | Area | 30% Deposit Required |
|---|---|---|
| 1 | DE1 (City Centre) | £53,212 |
| 2 | DE24 (Alvaston, Sinfin, Shelton Lock) | £60,800 |
| 3 | DE21 (Chaddesden, Oakwood, Spondon) | £71,938 |
| 4 | DE23 (Littleover, Sunny Hill, Normanton) | £82,108 |
| 5 | DE22 (Allestree, Mackworth, Darley Abbey) | £84,383 |
| 6 | DE3 (Mickleover) | £91,352 |
| 7 | DE74 (Castle Donington, Kegworth) | £100,741 |
| 8 | DE72 (Borrowash, Ockbrook) | £104,672 |
| 9 | DE73 (Chellaston, Melbourne) | £112,850 |
The £53,212 deposit in DE1 is one of the lowest entry points in the East Midlands. Paired with the 5.8% top yield, the city centre is the most accessible start for an investor working with limited capital. Three postcodes (DE1, DE24, DE21) need under £75,000, covering the affordable inner and southern suburbs.
The four postcodes above £90,000 (DE3, DE74, DE72, DE73) are the outer suburban and semi-rural districts where larger detached and family homes lift the average. The £59,638 gap between the cheapest and dearest deposit shows there is genuine range across the Derby market, from a sub-£55,000 city-centre flat to a six-figure stake in a Chellaston family home. Sold prices, rather than deposits, mark the true ceiling of the outer villages: our sold-price ranking of the most expensive streets in Derby is led by Quarndon and Repton, with DE72's Breaston placing two of the ten.
What the Derby Data Tells Buy-to-Let Investors
In Derby the cheapest way in is also the highest-yielding, and it comes with the slowest exit. DE1 (City Centre) has the top yield at 5.8%, the lowest asking price at £177,372, the smallest deposit at £53,212, and the most affordable prices against local earnings at 4.9 times income. The catch is liquidity: at 338 days on market it is the slowest postcode to sell, and its five-year price record is flat at -2.2%. For DE1, the current return is in the rental income, not capital growth.
DE24 (Alvaston, Sinfin, Shelton Lock) is the postcode that balances the books. It pairs the second-best yield at 5.1% with the strongest five-year growth in the city at 22.2%. It is also the market where listings clear fastest in Derby, selling in around 105 days with a 30% turnover rate. The recent -4.7% one-year reading is a pause on a strong run rather than a turn. For an investor who wants income, growth and a quick sale in one place, DE24 does more jobs at once than any other Derby district.
DE22 (Allestree, Mackworth, Darley Abbey) is the steadier growth option, with 18.1% over five years and 7.6% over three on a 4.3% yield, backed by Allestree's schools and a deep rented sector. At the premium end, DE72 (Borrowash) and DE73 (Chellaston) take strong rents but sit on the dearest prices and the weakest yields at 3.3%, so the premium there is doing more for the rent than for the return. Buyers who want to come in under asking often work the off-market property sales route, before stock reaches the portals.
Derby City Council operates a selective licence in parts of the city, so landlords in designated areas need a licence to let. Check the current boundaries before buying. Underneath the postcode detail, the city's case is consistent: prices nearly a third below the England average, sitting on long-term engineering and rail employment, with a regeneration pipeline concentrated in the highest-yielding district.
How Derby Compares
Derby's mean asking price of £282,243 sits between Nottingham and Leicester, the two East Midlands cities investors most often weigh against it. Mean asking price and mean rent are simple averages across each city's postcodes; top gross yield is the single highest postcode yield in each.
| Location | Mean Asking Price | Mean Monthly Rent | Mean Gross Yield | Top Yield (postcode) |
|---|---|---|---|---|
| Nottingham | £242,515 | £1,053 | 5.2% | 8.2% (NG1, NG7) |
| Derby | £282,243 | £984 | 4.2% | 5.8% (DE1) |
| Leicester | £300,970 | £1,058 | 4.2% | 7.3% (LE1) |
Derby's top yield of 5.8% is the lowest of the three, with Nottingham at 8.2% and Leicester at 7.3% both ahead on headline return. Nottingham and Leicester both carry larger student populations that concentrate high-yield demand into specific postcodes, while Derby's smaller university market is one tenant source among several. Derby also carries the lowest mean rent of the three, at £984 a month against roughly £1,055 in both neighbours. Rolls-Royce, Toyota and Alstom show the city's advanced-manufacturing and rail-engineering sector mix, but the available employer data does not isolate its effect on tenant demand. For a data-driven comparison across every UK location, see our best buy-to-let areas guide.
Frequently Asked Questions
What are buy-to-let prices, yields and tenant-demand indicators in Derby?
The average sold home is £204,149, 29.6% below the England average. Current asking prices run from £177,372 in DE1 to £376,166 in DE73, equivalent to a 30% deposit of £53,212 to £112,850. The top gross yield is 5.8% in DE1.
The private rented sector accounts for 28.8% of households in DE1 and 27.2% in DE22, the two deepest shares in the city. In the current rental-listing snapshot DE23 reads as a landlord's market, DE1, DE22 and DE24 are balanced, and the other postcodes have too little live-listing data for a confident classification. These are the page's measured tenant-demand indicators; the named major employers describe Derby's sector mix rather than proving rental demand.
What are the best areas in Derby for property investment?
DE1 (City Centre) is the cheapest way in at £177,372 and carries the highest yield at 5.8%, so it leans towards income, though it sells slowly. DE24 (Alvaston, Sinfin, Shelton Lock) is the most rounded, pairing a 5.1% yield with the strongest five-year growth at 22.2% and the fastest selling time in the city.
For steadier growth, DE22 (Allestree, Mackworth, Darley Abbey) has risen 18.1% over five years on the back of good schools and a deep rented sector. The premium suburbs, DE72 (Borrowash) and DE73 (Chellaston), take the strongest rents but yield only 3.3%, so they suit a capital-weighted buyer rather than an income one.
What is the average rent in Derby?
The mean across all 9 postcodes is £984 a month. The range runs from £856 in DE1 (City Centre) up to £1,205 in DE3 (Mickleover), with the affordable inner and southern districts at the lower end and the premium suburbs at the top. The pattern to watch is that the highest rents do not produce the highest yields: DE3 charges the most but yields 4.7%, because its prices are high enough to absorb the extra rent.
What type of property is most common in Derby?
Detached houses, in most of the city, running past half the stock in the outer suburbs of DE74, DE3 and DE73. The smaller homes that usually suit buy-to-let, terraces and flats, cluster in DE1, where flats alone make up 30.4% of stock against single figures almost everywhere else. So the type you buy tends to follow the postcode: city-centre flats and terraces for income, suburban detached houses for owner-occupier resale.
How does Derby compare to Nottingham for property investment?
Nottingham offers the higher headline yield, up to 8.2% against Derby's 5.8%, and a lower mean asking price, £242,515 against £282,243. The gap is mostly student demand: Nottingham's large university population concentrates renters into specific postcodes and lifts yields there. Derby's pitch is a different one, built on engineering and rail employment that produces steady professional tenants rather than a student churn.
On the data, an income-first investor will find Nottingham's numbers more attractive, while an investor weighting tenant stability and a wide sold-price discount may prefer Derby. They are complementary rather than directly competing markets.
Does Derby have a university, and does it support rental demand?
Yes. The University of Derby has roughly 17,000 students, with its main campus at Kedleston Road in DE22 and a city-centre presence in DE1, and student demand concentrates around those two areas. It is a smaller student market than Nottingham or Leicester, so it works as one consistent tenant source for lower-value city-centre stock rather than the dominant force it is in bigger university cities. For the purpose-built end of that market, see our guide to PBSA.
What are the Local Housing Allowance rates in Derby?
Eight of Derby's nine postcodes fall in the Derby Broad Rental Market Area and share one set of rates. As of June 2026, Local Housing Allowance runs at £82.81 a week for a shared room, £103.56 for one bed, £136.93 for two beds, £161.10 for three and £215.18 for four. That figure is the most a tenant on housing support can claim, so it is one read on the paying power of the benefit-supported end of the market. The exception is DE74 (Castle Donington, Kegworth), which sits in the Leicester market area on higher rates.
How do I buy an investment property in Derby?
Decide first whether you are buying for income or for growth, because the two goals point at different postcodes. DE1 (City Centre) is the cheapest entry at £177,372 and the highest-yielding at 5.8%; DE24 (Alvaston, Sinfin, Shelton Lock) pairs a 5.1% yield with the strongest five-year growth at 22.2%. Budget for a 30% deposit, which runs from £53,212 in DE1 to £112,850 in DE73.
Beyond what is listed openly, experienced investors often buy under asking through off market property and BMV property. To see what is available now, browse investment property derby or buy-to-let homes for sale.
Ready to buy property?
Browse investment properties with prices and gross yields shown for each opportunity.
See the latest deals