

Best Buy-to-Let Locations UK: 154 Areas Compared (2026)
Most "best buy-to-let" lists cover 10 or 15 cities. Usually the ones the publisher happens to sell property in. This one compares 154 locations across the UK, from Aberdeen to Wrexham, to help you decide where to invest in property using government data and the same methodology for every single one. The data does not change based on what we have available to sell. The numbers are the numbers.
Article updated: July 2026
Best Places to Invest in Property in the UK in 2026
Based on the March 2026 data, six cities stand out as the best cities to invest in property across different investment profiles.
Newcastle (9.7% yield, £76,065 deposit) leads the country. A deep rental market across multiple postcodes, strong student and professional demand, and asking prices still well below the national average. It has led this and the two previous dated comparisons.
Leeds (9.6% yield, £85,396 deposit) sits second nationally and brings scale. A broad postcode spread, a large professional and student tenant pool, and a city economy that has diversified well beyond its traditional base.
Nottingham (9.0% yield, £72,800 deposit) is the Midlands standout. A large university city with one of the lowest entry costs in the top 5 nationally. For investors looking for yield without a six-figure deposit, this is where the numbers work hardest.
Southampton (9.0% yield, £78,217 deposit) is the one most investors will not expect. A South East location matching Nottingham's yield at a similar price point. Port city economics and a university keep rental demand strong relative to purchase prices.
Aberdeen (8.6% yield, £46,932 deposit) has the lowest entry cost of any location in this analysis. Under £47,000 gets you into a market yielding 8.6%. Different tax rules (LBTT instead of Stamp Duty) change the cost structure, but the numbers are hard to ignore.
Hull (8.4% yield, £51,784 deposit) is the budget pick with substance. One of only three locations where a 30% deposit comes in under £55,000 while still delivering a yield above 8%.
These are the property investment locations where the data is strongest in March 2026. The full comparison table below covers all 154, and each location links to a dedicated guide with postcode-level analysis.
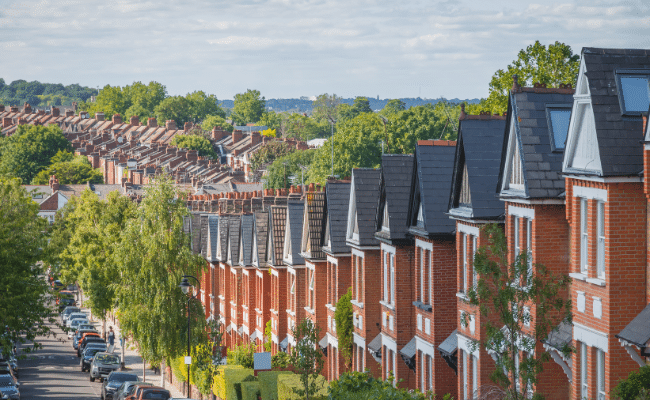
154 Buy-to-Let Locations Compared
The table below includes every location in this edition. Every row links to a detailed location guide with postcode-level analysis.
| Location | Avg. Asking Price | Avg. Monthly Rent | Top Gross Yield | 30% Deposit |
|---|---|---|---|---|
| Newcastle | £253,549 | £1,177 pcm | 9.7% | £76,065 |
| Leeds | £284,654 | £1,118 pcm | 9.6% | £85,396 |
| Hampshire | £411,548 | £1,386 pcm | 9.0% | £123,464 |
| Nottingham | £242,667 | £1,076 pcm | 9.0% | £72,800 |
| Southampton | £260,724 | £1,362 pcm | 9.0% | £78,217 |
| Swansea | £250,854 | £1,233 pcm | 8.8% | £75,256 |
| Aberdeen | £156,439 | £807 pcm | 8.6% | £46,932 |
| Hull | £172,613 | £752 pcm | 8.4% | £51,784 |
| Bristol | £372,904 | £1,777 pcm | 8.2% | £111,871 |
| Glasgow | £180,998 | £1,046 pcm | 8.1% | £54,299 |
| Norwich | £303,660 | £1,321 pcm | 8.1% | £91,098 |
| Middlesbrough | £181,853 | £685 pcm | 7.9% | £54,556 |
| Manchester | £266,893 | £1,308 pcm | 7.8% | £80,068 |
| Bournemouth | £355,164 | £1,408 pcm | 7.7% | £106,549 |
| Sheffield | £238,489 | £901 pcm | 7.5% | £71,547 |
| Sunderland | £163,545 | £695 pcm | 7.5% | £49,064 |
| Leicester | £294,053 | £1,042 pcm | 7.4% | £88,216 |
| Liverpool | £207,760 | £870 pcm | 7.4% | £62,328 |
| Cardiff | £308,726 | £1,223 pcm | 7.3% | £92,618 |
| Birkenhead | £211,192 | £797 pcm | 7.2% | £63,358 |
| Birmingham | £272,676 | £1,113 pcm | 7.2% | £81,803 |
| Coventry | £295,886 | £1,099 pcm | 7.1% | £88,766 |
| Dundee | £201,050 | £799 pcm | 7.0% | £60,315 |
| Portsmouth | £284,807 | £1,351 pcm | 7.0% | £85,442 |
| Barking & Dagenham | £402,065 | £1,850 pcm | 6.7% | £120,620 |
| East London | £543,860 | £2,066 pcm | 6.7% | £163,158 |
| Kent | £420,564 | £1,416 pcm | 6.7% | £126,169 |
| London | £594,910 | £2,166 pcm | 6.7% | £178,473 |
| Milton Keynes | £388,510 | £1,384 pcm | 6.7% | £116,553 |
| Newham | £431,423 | £2,053 pcm | 6.7% | £129,427 |
| Stoke-on-Trent | £239,223 | £828 pcm | 6.7% | £71,767 |
| Brighton | £420,745 | £1,825 pcm | 6.6% | £126,224 |
| Edinburgh | £319,974 | £1,429 pcm | 6.6% | £95,992 |
| Salford | £247,746 | £1,163 pcm | 6.6% | £74,324 |
| Sussex (east) | £444,974 | £1,421 pcm | 6.6% | £133,492 |
| Cheshire West and Chester | £368,939 | £1,143 pcm | 6.4% | £110,682 |
| Hertfordshire | £533,357 | £1,666 pcm | 6.4% | £160,007 |
| Blackpool | £198,183 | £750 pcm | 6.3% | £59,455 |
| Gloucester | £293,930 | £1,215 pcm | 6.3% | £88,179 |
| Guildford | £639,106 | £2,259 pcm | 6.3% | £191,732 |
| Medway | £338,351 | £1,356 pcm | 6.3% | £101,505 |
| Surrey | £611,516 | £2,107 pcm | 6.3% | £183,455 |
| Bexley | £427,101 | £1,774 pcm | 6.2% | £128,130 |
| Enfield | £525,475 | £1,885 pcm | 6.2% | £157,642 |
| Greenwich | £466,954 | £1,953 pcm | 6.2% | £140,086 |
| North London | £634,943 | £2,197 pcm | 6.2% | £190,483 |
| Preston | £249,695 | £999 pcm | 6.2% | £74,908 |
| South London | £536,371 | £2,056 pcm | 6.2% | £160,911 |
| Stockport | £371,546 | £1,314 pcm | 6.2% | £111,464 |
| Trafford | £380,710 | £1,343 pcm | 6.2% | £114,213 |
| Reading | £415,265 | £1,603 pcm | 6.1% | £124,580 |
| Basildon | £414,342 | £1,609 pcm | 5.9% | £124,303 |
| Derby | £274,397 | £981 pcm | 5.9% | £82,319 |
| Essex | £430,855 | £1,471 pcm | 5.9% | £129,256 |
| Harlow | £419,592 | £1,537 pcm | 5.9% | £125,878 |
| West London | £838,043 | £2,705 pcm | 5.9% | £251,413 |
| Bath | £450,726 | £1,782 pcm | 5.8% | £135,218 |
| Haringey | £587,745 | £2,025 pcm | 5.8% | £176,324 |
| Havering | £510,953 | £1,707 pcm | 5.8% | £153,286 |
| Redbridge | £536,952 | £2,008 pcm | 5.8% | £161,086 |
| Romford | £527,152 | £1,766 pcm | 5.8% | £158,146 |
| Tottenham | £538,486 | £2,042 pcm | 5.8% | £161,546 |
| Walsall | £285,025 | £986 pcm | 5.8% | £85,508 |
| Waltham Forest | £506,314 | £1,883 pcm | 5.8% | £151,894 |
| Basingstoke and Deane | £489,238 | £1,472 pcm | 5.7% | £146,771 |
| Bradford | £219,292 | £828 pcm | 5.7% | £65,788 |
| Carlisle | £276,315 | £779 pcm | 5.7% | £82,894 |
| Durham | £183,073 | £765 pcm | 5.7% | £54,922 |
| Tameside | £255,481 | £1,002 pcm | 5.7% | £76,644 |
| Doncaster | £215,244 | £820 pcm | 5.6% | £64,573 |
| Exeter | £387,814 | £1,284 pcm | 5.6% | £116,344 |
| Hounslow | £506,393 | £1,915 pcm | 5.6% | £151,918 |
| Plymouth | £282,189 | £1,002 pcm | 5.6% | £84,657 |
| Solihull | £467,880 | £1,372 pcm | 5.6% | £140,364 |
| Wigan | £227,201 | £892 pcm | 5.6% | £68,160 |
| Barnet | £697,446 | £2,191 pcm | 5.5% | £209,234 |
| Brent | £552,292 | £2,115 pcm | 5.5% | £165,688 |
| Ealing | £539,698 | £2,077 pcm | 5.5% | £161,909 |
| Lambeth | £573,848 | £2,289 pcm | 5.5% | £172,154 |
| Lancaster | £278,238 | £906 pcm | 5.5% | £83,471 |
| Newport | £272,487 | £1,037 pcm | 5.5% | £81,746 |
| Northampton | £340,422 | £1,177 pcm | 5.5% | £102,127 |
| St Helens | £231,449 | £944 pcm | 5.5% | £69,435 |
| Wakefield | £252,745 | £875 pcm | 5.5% | £75,824 |
| Watford | £443,723 | £1,637 pcm | 5.5% | £133,117 |
| York | £362,627 | £1,341 pcm | 5.5% | £108,788 |
| Bromley | £528,459 | £1,826 pcm | 5.4% | £158,538 |
| Colchester | £358,142 | £1,289 pcm | 5.4% | £107,443 |
| Croydon | £460,661 | £1,747 pcm | 5.4% | £138,198 |
| Dudley | £265,610 | £958 pcm | 5.4% | £79,683 |
| Eastbourne | £333,016 | £1,287 pcm | 5.4% | £99,905 |
| Hackney | £674,787 | £2,538 pcm | 5.4% | £202,436 |
| Harrow | £553,954 | £1,962 pcm | 5.4% | £166,186 |
| Oxford | £518,350 | £1,776 pcm | 5.4% | £155,505 |
| Wolverhampton | £246,971 | £984 pcm | 5.4% | £74,091 |
| Halifax | £243,994 | £783 pcm | 5.3% | £73,198 |
| Lewisham | £487,537 | £1,907 pcm | 5.3% | £146,261 |
| Maidstone | £477,473 | £1,539 pcm | 5.3% | £143,242 |
| Peterborough | £287,432 | £1,042 pcm | 5.3% | £86,230 |
| Swindon | £332,719 | £1,145 pcm | 5.3% | £99,816 |
| Wandsworth | £671,821 | £2,660 pcm | 5.3% | £201,546 |
| High Wycombe | £541,303 | £1,575 pcm | 5.2% | £162,391 |
| Huddersfield | £261,660 | £799 pcm | 5.2% | £78,498 |
| Ipswich | £313,558 | £1,011 pcm | 5.2% | £94,067 |
| Somerset | £370,381 | £1,142 pcm | 5.2% | £111,114 |
| Bolton | £248,685 | £936 pcm | 5.1% | £74,606 |
| Canterbury | £405,940 | £1,439 pcm | 5.1% | £121,782 |
| Merton | £592,206 | £2,247 pcm | 5.1% | £177,662 |
| Oldham | £268,665 | £1,012 pcm | 5.1% | £80,600 |
| Rochdale | £255,610 | £956 pcm | 5.1% | £76,683 |
| Sussex (west) | £463,034 | £1,424 pcm | 5.1% | £138,910 |
| Woking | £559,571 | £2,029 pcm | 5.1% | £167,871 |
| Cambridge | £492,709 | £1,742 pcm | 5.0% | £147,813 |
| Camden | £1,023,201 | £3,343 pcm | 5.0% | £306,960 |
| Islington | £697,951 | £2,602 pcm | 5.0% | £209,385 |
| Telford | £313,914 | £1,023 pcm | 5.0% | £94,174 |
| Worcester | £290,814 | £915 pcm | 5.0% | £87,244 |
| Bury | £279,435 | £1,017 pcm | 4.9% | £83,830 |
| Cheshire East | £398,597 | £1,210 pcm | 4.9% | £119,579 |
| Hastings | £366,342 | £1,142 pcm | 4.9% | £109,903 |
| Isle Of Wight | £338,391 | £954 pcm | 4.9% | £101,517 |
| Poole | £443,756 | £1,443 pcm | 4.9% | £133,127 |
| Slough | £421,952 | £1,544 pcm | 4.9% | £126,586 |
| Stirling | £325,119 | £966 pcm | 4.9% | £97,536 |
| Chester | £325,454 | £1,095 pcm | 4.8% | £97,636 |
| Crawley | £412,102 | £1,369 pcm | 4.8% | £123,631 |
| Luton | £408,606 | £1,401 pcm | 4.8% | £122,582 |
| Southend-on-Sea | £371,853 | £1,294 pcm | 4.8% | £111,556 |
| Blackburn | £221,601 | £816 pcm | 4.7% | £66,480 |
| Warrington | £311,729 | £1,068 pcm | 4.7% | £93,519 |
| Bracknell | £555,697 | £1,934 pcm | 4.6% | £166,709 |
| Chelmsford | £530,087 | £1,626 pcm | 4.6% | £159,026 |
| Hemel Hempstead | £528,828 | £1,566 pcm | 4.6% | £158,648 |
| Lincoln | £268,342 | £905 pcm | 4.6% | £80,503 |
| Stevenage | £430,671 | £1,370 pcm | 4.6% | £129,201 |
| Cheltenham | £440,501 | £1,376 pcm | 4.5% | £132,150 |
| Chichester | £509,470 | £1,598 pcm | 4.5% | £152,841 |
| Winchester | £536,655 | £1,650 pcm | 4.5% | £160,996 |
| Ely | £385,712 | £1,278 pcm | 4.4% | £115,714 |
| Lichfield | £371,187 | £1,173 pcm | 4.4% | £111,356 |
| St Albans | £696,075 | £2,176 pcm | 4.4% | £208,822 |
| Truro | £442,300 | £1,234 pcm | 4.4% | £132,690 |
| Welwyn Garden City | £611,602 | £1,387 pcm | 4.4% | £183,481 |
| Wiltshire | £392,132 | £1,260 pcm | 4.4% | £117,640 |
| Bangor | £276,089 | £899 pcm | 4.3% | £82,827 |
| Salisbury | £403,588 | £1,282 pcm | 4.3% | £121,076 |
| Sussex (mid) | £512,060 | £1,560 pcm | 4.3% | £153,618 |
| Bicester | £449,912 | £1,377 pcm | 4.1% | £134,974 |
| Ripon | £381,952 | £1,170 pcm | 4.1% | £114,586 |
| Rhyl | £234,228 | £716 pcm | 4.0% | £70,268 |
| St Asaph | £271,778 | £716 pcm | 4.0% | £81,533 |
| Hereford | £346,017 | £1,028 pcm | 3.9% | £103,805 |
| Wrexham | £259,235 | £780 pcm | 3.9% | £77,770 |
| Wells | £364,636 | £1,086 pcm | 3.7% | £109,391 |
Source: HM Land Registry, ONS, Nomis and PropertyData. March 2026 snapshot.

Highest Rental Yields in the UK: The Top 20
The top 20 tells a story that contradicts the usual narrative. Most best buy-to-let lists are dominated by Northern cities. This one spans 9 regions. Hampshire and Southampton, both South East locations, sit at 9.0% alongside Nottingham. That is not what the "North equals yields" crowd expects.
Newcastle and Leeds take the top two spots at 9.7% and 9.6%. Yorkshire and the North West each place 3 locations in the top 20. But the surprise entries from the South East and South West mean investors filtering by region alone will miss some of the best rental yield areas in the UK.
Eight of these 20 locations have asking prices below £250,000. Aberdeen, ranked 7th at 8.6%, has the lowest entry price in the top tier at £156,439. A 30% deposit of under £47,000 gets you into one of the strongest yielding markets in the country. That is less than most people spend on a new car.
These are gross yields from top-performing postcodes. Individual property yields vary by postcode, property type and condition. The location guides break it down further.
| Location | Top Gross Yield | Avg. Monthly Rent |
|---|---|---|
| 1. Newcastle | 9.7% | £1,177 pcm |
| 2. Leeds | 9.6% | £1,118 pcm |
| 3. Hampshire | 9.0% | £1,386 pcm |
| 4. Nottingham | 9.0% | £1,076 pcm |
| 5. Southampton | 9.0% | £1,362 pcm |
| 6. Swansea | 8.8% | £1,233 pcm |
| 7. Aberdeen | 8.6% | £807 pcm |
| 8. Hull | 8.4% | £752 pcm |
| 9. Bristol | 8.2% | £1,777 pcm |
| 10. Glasgow | 8.1% | £1,046 pcm |
| 11. Norwich | 8.1% | £1,321 pcm |
| 12. Middlesbrough | 7.9% | £685 pcm |
| 13. Manchester | 7.8% | £1,308 pcm |
| 14. Bournemouth | 7.7% | £1,408 pcm |
| 15. Sheffield | 7.5% | £901 pcm |
| 16. Sunderland | 7.5% | £695 pcm |
| 17. Leicester | 7.4% | £1,042 pcm |
| 18. Liverpool | 7.4% | £870 pcm |
| 19. Cardiff | 7.3% | £1,223 pcm |
| 20. Birkenhead | 7.2% | £797 pcm |
Use the deposit filter on the main comparison table to find locations within your budget. A 30% deposit ranges from under £47,000 in Aberdeen to over £300,000 in parts of London. For a different lens on affordability, our analysis of the cheapest places to buy a house in England ranks locations purely by purchase price. The stamp duty calculator can help model the full acquisition cost alongside deposit figures.

Best Buy-to-Let Areas by Region
The UK splits into clear regional patterns. London has the highest rents but the weakest yields once you account for entry costs. The North is the opposite. The Midlands and South fall between, with specific cities doing far better than their regional averages suggest.
Here are the top performers across the 11 regions we cover, with links to the full collection of guides in each. Ten of those regions appear in the comparison table above; Northern Ireland is the eleventh, covered separately below because comparable yield figures are not available for it in this edition.
East of England
Norwich is the standout across 18 East of England locations. An 8.1% yield from a university city with asking prices still under £304,000. Hertfordshire (6.4%) and Basildon (5.9%) follow, though both need deposits above £120,000 at 30%. See all East of England location guides.
London
The capital is a different game. Rents are the highest in the UK. Camden hits £3,343 a month. But asking prices compress those rents into yields of just 5.0% to 6.7% across 30 tracked locations. Barking and Dagenham, East London and the city overall share the top spot at 6.7%. Even the most affordable boroughs need deposits from £120,000. The figures show higher rents but lower yields relative to asking prices. See all London location guides.
Midlands
Nottingham at 9.0% places third nationally. That is a headline figure for a city of this size. Leicester (7.4%) and Birmingham (7.2%) sit behind it, both with deposits in the £80,000 to £90,000 range. Growing employment, university demand, and housing stock that is still affordable compared to the South. Sixteen locations tracked in total. See all Midlands location guides.
North East
Newcastle owns this region and the national table. 9.7% from just 4 tracked locations. Middlesbrough (7.9%) and Sunderland (7.5%) round it out, and Sunderland is one of only two locations in the UK where a 30% deposit comes in under £50,000, at £49,064. Rents are lower than national averages, but so are prices. That is what drives the yield arithmetic. See all North East location guides.
North West
The deepest market outside London: 22 locations tracked. Manchester leads at 7.8%, Liverpool at 7.4%, Birkenhead at 7.2%. Deposits run from around £59,000 in Blackpool to over £119,000 in Cheshire East. Two major cities anchor the rental demand with large student and professional tenant pools. See all North West location guides.
Northern Ireland
Belfast and Derry City and Strabane do not have comparable postcode-level yield figures in this edition, so neither appears in the comparison table. Their individual guides show the evidence that is available: Belfast and Derry City and Strabane.
Scotland
Aberdeen holds a unique position. The cheapest entry point in the entire UK at £46,932 (30% deposit) and a yield of 8.6%. Glasgow (8.1%) and Dundee (7.0%) sit next in the table. Scotland operates under different tax rules: LBTT instead of Stamp Duty, which changes the cost calculation. Five locations tracked. See all Scotland location guides.
South East
This is where the data gets interesting. Hampshire and Southampton both hit 9.0%. Those are top-five national numbers from a region most investors write off as too expensive. Portsmouth (7.0%) is the third pick. The South East has the widest deposit spread: £78,000 in Southampton to over £220,000 near London. The high-yield pockets cluster around port cities where rental demand is strong relative to prices. Twenty-eight locations tracked. See all South East location guides.
South West
Bristol at 8.2%. A large professional and student rental market underpins that figure. Bournemouth (7.7%) benefits from coastal demand and a growing digital economy. After that, yields drop. Popular tourist areas like Bath and Exeter sit below the 5.8% national average because purchase prices are pushed up by lifestyle buyers, not investor maths. Fourteen locations tracked. See all South West location guides.
Wales
Two-speed market. Swansea (8.8%) and Cardiff (7.3%) stand clearly apart from the rest of the country. The remaining five Welsh locations cluster between 3.9% and 5.5%, on lower monthly rents. Swansea pairs the highest Welsh yield with an average asking price of £250,854 and a monthly rent of £1,233. See all Wales location guides.
Yorkshire
Three of the national top 20 come from Yorkshire. Leeds (9.6%) takes second place nationally, with a rental market that runs deep across multiple postcodes. Hull (8.4%) offers the region's lowest entry cost at £51,784. Sheffield (7.5%) brings a broad postcode spread and strong student demand. Ten locations tracked, and the region punches well above its weight. See all Yorkshire location guides.
How the Comparison Works
Every location uses the same definitions and dated snapshot. The comparison combines mean asking prices and rents, HM Land Registry sold prices for historical context, and local earnings from ONS via Nomis.
The gross yield figure is annual rent divided by asking price. It is the top yield recorded across the postcodes included for each location. That means best-case before costs. Actual net yields will be lower once you factor in buy-to-let costs like mortgage payments, management fees, maintenance and void periods. The return on investment depends on those costs as much as the headline yield.
The 30% deposit figure comes from the mean asking price across all postcodes in that location. We use 30% as a standard comparison point because it reflects a typical buy-to-let mortgage requirement. Your actual deposit may differ depending on lender, property type and circumstances.
Within this edition, the methodology is identical whether the location is a major city or a smaller town. That consistency is the whole point. You can compare Newcastle with Norwich, or Hull with Hampshire, and know the numbers use the same calculation basis.

Where to Invest in Property in the UK: Three Patterns in the 2026 Data
Three patterns stand out from the March 2026 data for investors deciding where to invest in property in the UK.
Cheaper does not mean worse. The inverse relationship between price and yield is consistent across 154 locations. The 25 locations with deposits under £75,000 average a 6.6% top yield compared to 5.8% nationally. That gap is real. Investors chasing ROI from their postcodes rather than capital growth will find the numbers favour the North East, Yorkshire and Scotland over London and the South East.
The yield map is changing. Hampshire and Southampton at 9.0% both sit in the South East. That would not have happened five years ago. The North still dominates the top of the table, but the traditional regional boundaries are blurring. If you are choosing where to invest in property in the UK based on a region label, you will miss pockets like these.
Within-region gaps are wider than between-region gaps. Take the North West. The spread from Blackburn at 4.7% to Manchester at 7.8% is wider than the gap between the North West average and London's average. Choosing "the North West" is not a strategy. The postcode-level data in each individual guide is where the real differences show. Our investment property page can help once you have a target area.
For a broader perspective on whether the numbers still work: Is buy-to-let worth it?
Frequently Asked Questions
What is a good rental yield for buy-to-let in 2026?
The average top gross yield across the 154 locations in this analysis is 5.8%. Yields above 7% are generally considered strong for income-focused strategies. The top 20 locations in this dataset all achieve yields of 7.2% or higher. Gross yield is the starting point for comparison, but net yield (after costs) is what determines actual returns. Our guide to working out rental yield explains the calculation in detail.
Where has the highest rental yield in the UK?
Newcastle records the highest top gross yield in our March 2026 data at 9.7%, followed by Leeds at 9.6%. Three locations share third place at 9.0%: Nottingham, Hampshire and Southampton. These figures represent the top-performing postcodes within each location. Individual postcode yields are available in each location guide.
How much deposit do I need for a buy-to-let property?
Most buy-to-let mortgages require a deposit of 25% to 40% of the purchase price. This analysis uses 30% as a standard comparison point. Based on March 2026 asking prices, a 30% deposit ranges from £46,932 in Aberdeen to over £300,000 in parts of London. The cheapest entry points are concentrated in Scotland, the North East and Yorkshire. Use the comparison table above to filter by your available budget.
What do buy-to-let yields and costs look like in 2026?
Across the 154 locations in this March 2026 analysis, the average top gross yield is 5.8%; the highest postcode-level figure is 9.7%. These are gross comparisons rather than net returns. Purchase price, stamp duty or LBTT, legal and survey fees, finance, insurance, management, maintenance and void periods all affect the property-level cost and return. Our full analysis covers the wider question: Is buy-to-let worth it?
What costs should I budget for beyond the deposit?
Stamp duty (or LBTT in Scotland), legal fees, survey costs, mortgage arrangement fees and any refurbishment costs all sit on top of the deposit. Once the property is tenanted, ongoing costs include mortgage repayments, insurance, maintenance, letting agent fees and potential void periods. Our buy-to-let costs guide covers each line item.
What date does this comparison cover?
This page is a March 2026 snapshot. Its asking prices, rents and yield figures belong to that edition; Land Registry sold prices appear only once a sale is registered, which HM Land Registry says typically takes between 2 weeks and 2 months, occasionally longer. Read the table and its surrounding analysis together as one dated comparison rather than as live figures.
What is the difference between gross and net yield?
Gross yield is annual rental income divided by the purchase price. It is a useful comparison metric because it uses the same inputs for every property. Net yield subtracts costs (mortgage, insurance, maintenance, management, voids) from the rental income before dividing by the total investment. Net yield gives a more realistic picture of actual returns but varies based on individual circumstances. The yields on this page are gross yields.
Can I compare specific locations side by side?
The comparison table at the top of this page lets you filter by region, deposit budget and minimum yield. Each location also has a dedicated guide with postcode-level data, local market context and more detailed analysis. Use the filters to shortlist, then read the individual guides for depth. You can also explore property investment strategies to understand which location characteristics match different investment approaches.
Once you have compared the full table, try our daily UK property market game to see how well you can compare locations by prices, rents, yields and growth.
When you are ready to compare actual deals, browse buy-to-let properties and use the local data above to test whether advertised below market value properties are genuinely discounted.
Ready to buy property?
Browse investment properties with prices and gross yields shown for each opportunity.
Get property alerts