Barking and Dagenham Property Investment: Best Buy-to-Let Areas
Where factories once stood along the Thames, sleek apartment blocks now rise. Barking and Dagenham sits at that fascinating junction between East London's industrial past and its regeneration-fueled future. This is a borough where £250,000 still buys you a one-bedroom flat while most Londoners have long given up such hopes.
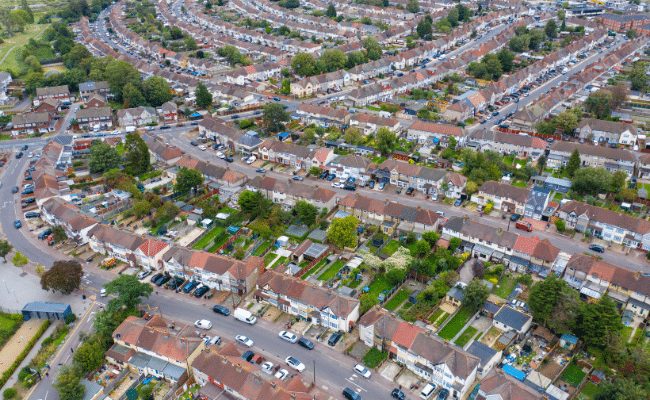
What makes Barking and Dagenham truly distinctive is its dual identity. The gleaming glass of Barking Riverside's waterfront developments stands in stark contrast to the characterful pre-war housing of Becontree Estate. For investors seeking genuine opportunity, the borough offers what much of London cannot: affordable entry prices, strong yields, and genuine growth potential.
This detailed analysis unpacks which Barking and Dagenham postcodes deliver the best balance of value, growth trajectory and rental returns.
Article updated: May 2025
Barking and Dagenham Buy-to-Let Market Overview 2025
Barking and Dagenham's property market offers investors exceptional value compared to London averages, with strong yields and positive growth trends. The borough shows notable variation across its postcodes, with RM6 (Chadwell Heath) experiencing the strongest price growth while IG11 (Barking) delivers the highest rental yields.
- Price range: £312,486 (IG11) to £431,464 (RM6)
- Rental yields: 5.6% to 6.8% across different postcodes
- Rental income: Weekly rents from £410 to £464 (monthly: £1,777 to £2,011)
- Price per sq ft: Consistent value across the borough from £428/sq ft to £452/sq ft
- Affordability: Property prices range from 9.74 to 13.45 times local annual salaries
Contents

-
by Robert Jones, Founder of Property Investments UK
With two decades in UK property, Rob has been investing in buy-to-let since 2005, and uses property data to develop tools for property market analysis.
Property Data Sources
Our location guide relies on diverse, authoritative datasets including:
- HM Land Registry UK House Price Index
- Ministry of Housing, Communities and Local Government
- Government Planning and Housing Data
- Propertydata.co.uk
We update our property data quarterly to ensure accuracy. Last update: May 2025. All data is presented as provided by our sources without adjustments or amendments.
Why Invest in Barking and Dagenham?
Barking and Dagenham offers exceptional value compared to most London boroughs, with average sold house prices 34.6% below the London average, making it one of the capital's most accessible entry points for investors.
When we look at property investment fundamentals, population growth often drives housing demand and price appreciation. This is where Barking and Dagenham truly stands out.
Total population growth significantly outpaced UK averages and even higher than average population growth across the rest of London.
The total population of Barking and Dagenham was 218,900 (as of the last UK government census in 2021) and it's population has increased by 17.7%, growing from 185,900 in 2011.
The borough of Barking and Dagenham includes areas such as Barking, Dagenham, Becontree, Chadwell Heath, Thames View, Creekmouth, Castle Green, Marks Gate, Rush Green, and Barking Riverside.
The borough is covered by the main postcodes: IG11, RM6, RM8, RM9, and RM10
With additional postcodes that cross Brent and other local London Boroughs including:
- E6 crosses Barking and Dagenham and Newham
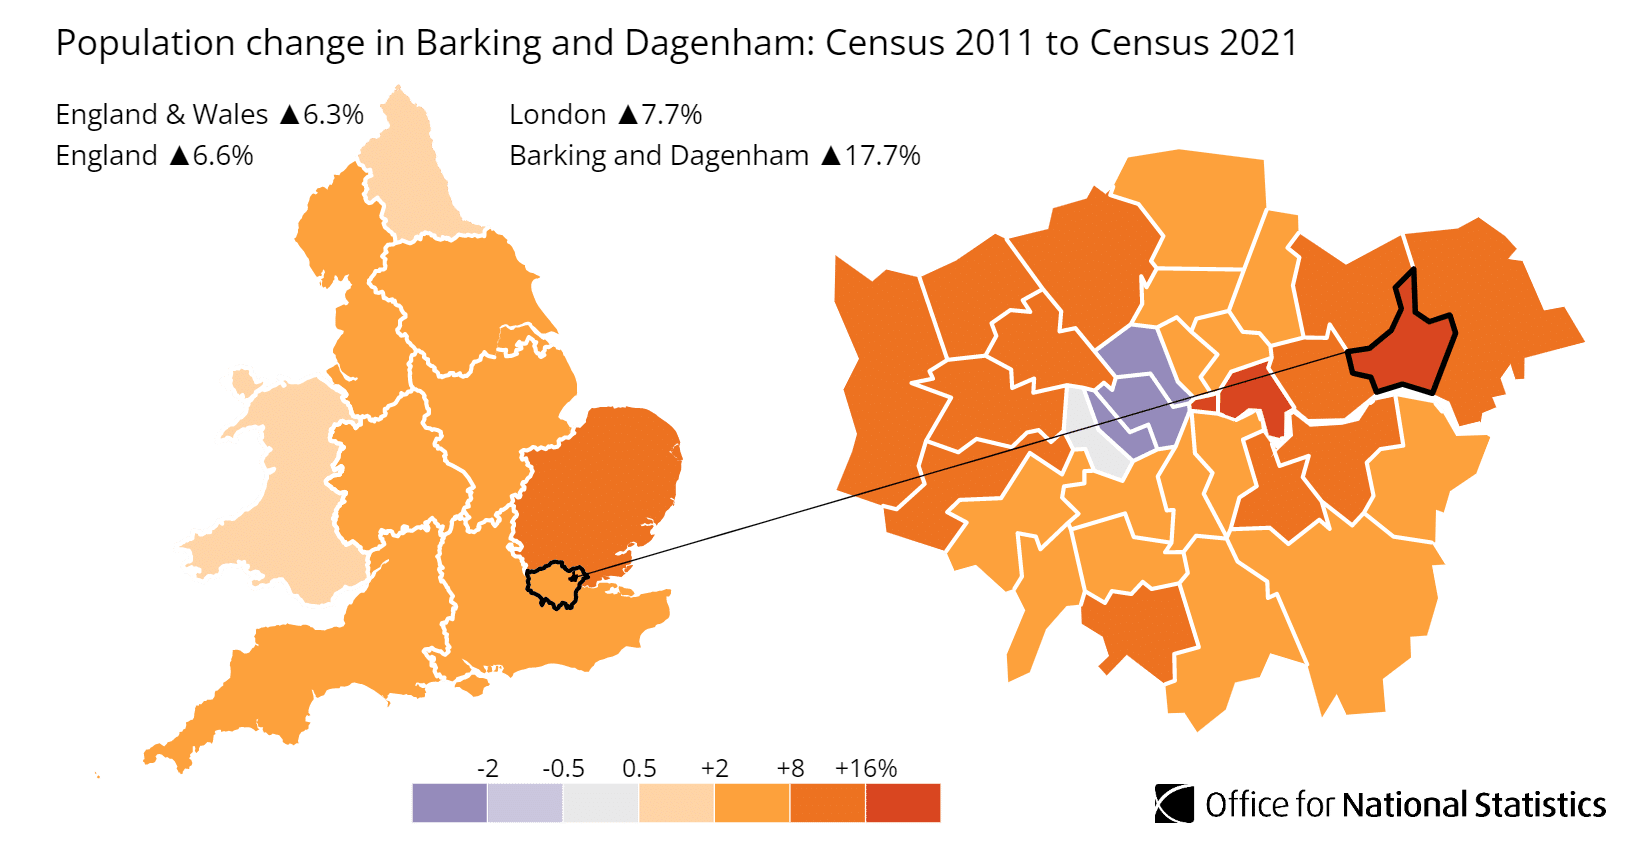
Source: Office for National Statistics
Brent Property Market Analysis
When Was the Last House Price Crash in Barking and Dagenham?
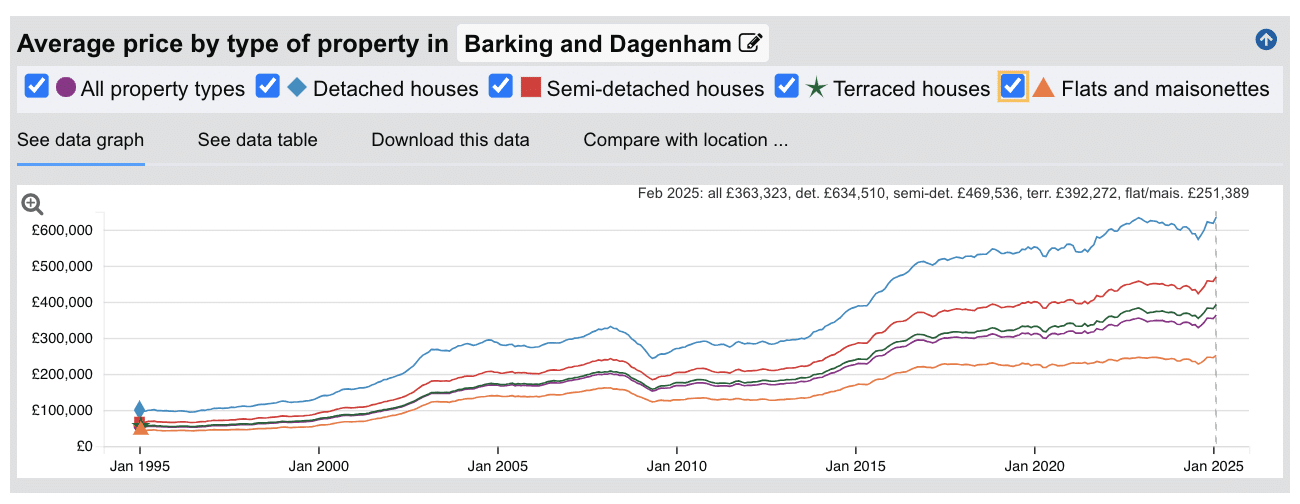
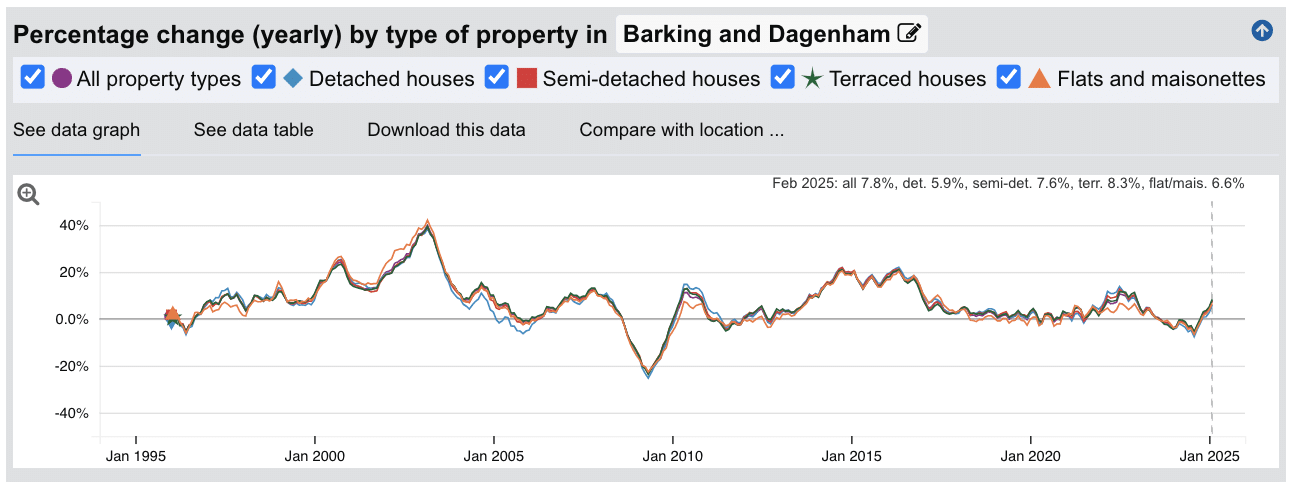
The last significant property price crash in Barking and Dagenham occurred during the global financial crisis of 2008-2010, with smaller corrections in late 2019 and during 2022-2023.
Source: HM Land Registry House Price Index
Looking at the property data across all types:
- 1995-2000: Steady growth period with annual increases ranging from 5-15%
- 2000-2004: Accelerated growth with peaks reaching 20-25% annual increases
- 2004-2007: Strong continued growth as London's property boom extended to more affordable areas
- 2008-2010: Significant house price crash during the financial crisis, with values dropping by approximately 25% - more severe than many other London areas
- 2010-2014: Slow, gradual recovery period
- 2014-2018: Strong growth period as buyers priced out of other areas discovered the borough's value
- 2018-2020: Period of stabilisation with more modest growth
- 2020-2022: Despite pandemic uncertainty, renewed growth as space became a priority
- 2022-2024: Minor correction followed by stabilisation
- 2025: Recent data (Feb 2025) shows positive annual growth: all property types (7.8%), detached houses (5.9%), semi-detached houses (7.6%), terraced houses (8.3%), and flats/maisonettes (6.6%) unlike some other areas of London that have seen a downtime in this same period.
What's particularly interesting about Barking and Dagenham is how it's weathered market downturns. During the 2008 crash, prices fell harder here than in many premium London areas, reflecting its more price-sensitive market. But the recovery has been remarkable, looking at the current growth rates above 5% across all property types while much of London experiences minor corrections.
The long-term picture tells an impressive story. Detached properties have increased from approximately £97,104 in 1995 to £634,510 by 2025 – more than a six-fold increase. While this growth hasn't matched some central London areas in absolute terms, the percentage returns have been substantial, especially for those who bought during recovery periods.
House Prices in Barking and Dagenham: Sold (£)
The latest sold house price index by the Land Registry, shows the following average sold house prices across the London Borough of Barking and Dagenham.
While detached houses in Barking and Dagenham offer exceptional value at 44.5% below the London average, semi-detached houses similarly provide remarkable accessibility at 33.4% below typical London prices.
Terraced houses in Barking and Dagenham represent substantial savings at 37.7% below London averages, while flats and maisonettes offer the biggest percentage discount, coming in 43.1% below typical London prices.
For investors ticking of their requirements of growth potential, yield and tenant demand in their investment property checklist, these figures highlight why Barking and Dagenham has become such a go-to location.
You're essentially getting London property at prices you'd typically find far outside the capital in areas like the leafy suburbs of South Manchester and Bath.
With average detached house prices at £634,510, families who'd be priced out of most London areas can find genuine options here. The most striking value is in the flat market at £251,389. Combined with those strong rental yields, this explains why so many buy-to-let investors have been focusing their attention on this eastern borough. When you can enter the North London market at less than half the typical price while achieving yields approaching 7%, it's not hard to see the appeal.
Updated May 2025
| Property Type | Barking and Dagenham Average Price | London Average | Difference |
|---|---|---|---|
| Detached houses | £634,510 | £1,142,545 | -44.5% |
| Semi-detached houses | £469,536 | £705,187 | -33.4% |
| Terraced houses | £392,272 | £629,315 | -37.7% |
| Flats and maisonettes | £251,389 | £441,704 | -43.1% |
| All property types | £363,323 | £555,625 | -34.6% |
Property Data Sources
Our location guide relies on diverse, authoritative datasets including:
- HM Land Registry UK House Price Index
- Ministry of Housing, Communities and Local Government
- Government Planning and Housing Data
- Propertydata.co.uk
We update our property data quarterly to ensure accuracy. Last update: May 2025. All data is presented as provided by our sources without adjustments or amendments.
House Prices in Barking and Dagenham: For Sale Asking Prices (£)
Updated May 2025
The data represents the average asking prices of properties currently listed for sale in Barking and Dagenham.
| Rank | Area | Average House Price |
|---|---|---|
| 1 | RM6 (Chadwell Heath) | £431,464 |
| 2 | RM8 (Becontree) | £382,010 |
| 3 | RM9 (Dagenham) | £391,474 |
| 4 | RM10 (Dagenham) | £379,535 |
| 5 | IG11 (Barking) | £312,486 |
Looking at these prices, you can see why Barking and Dagenham has become such a magnet for first-time buyers and investors. Where else in London can you find average asking prices starting at just £312,486? The RM6 postcode district (including Chadwell Heath) sits at the top end at £431,464, but that's still remarkably affordable for a London postcode. What I find most telling is the modest £119,000 gap between the highest and lowest prices – that's an unusually narrow spread for a London borough, suggesting the whole area offers good value. The £312,486 entry point in IG11 (Barking) is particularly eye-catching when you remember it also offers the borough's highest rental yield at 6.8%. From a practical perspective, that means a typical 25% deposit in Barking would be around £78,000, still a significant sum, but far more achievable than the £150,000+ deposits needed in many London areas. If you're weighing up whether to buy here, these figures show why so many are making the move east. Remember that these figures represent averages across all property types – from studios to family homes – so specific properties will vary in price depending on size, condition, and exact location within each postcode.
Sold Price Per Square Foot in Barking and Dagenham (£)
Updated May 2025
The data represents the average sold price per square foot of properties actually sold in Barking and Dagenham over the past 18 months.
| Rank | Area | Price Per Square Foot |
|---|---|---|
| 1 | RM9 (Dagenham) | £452 |
| 2 | RM6 (Chadwell Heath) | £449 |
| 3 | RM8 (Becontree) | £446 |
| 4 | RM10 (Dagenham) | £445 |
| 5 | IG11 (Barking) | £428 |
This is where you really see the value story in Barking and Dagenham. When you look at what you're getting for your money, every area in the borough offers value compared to most of London. Even the highest price per square foot – £452 in RM9 (Dagenham) – is less than half what you'd pay in many parts of the capital. What's particularly striking is how tightly clustered these figures are, with just £24 separating the highest and lowest areas. This tells you that the whole borough offers consistent value, with IG11 (Barking) being the standout at £428 per square foot. That's probably the best news for investors, combining the borough's most affordable price per square foot with its highest rental yield at 6.8%. For families looking to upsize, these numbers translate to getting significantly more living space for your budget than you would in most London locations. Remember that these figures are averages across all property types, and individual homes may vary based on condition, exact location, and specific features. New-build properties, for example, typically command a premium over existing housing stock.
House Price Growth in Barking and Dagenham (%)
Updated May 2025
The data represents the average house price growth over the past five years, calculated using a blended rolling annual comparison of both sold prices and asking prices.
| Rank | Area | 5 Year Growth |
|---|---|---|
| 1 | RM6 (Chadwell Heath) | 24.5% |
| 2 | RM8 (Becontree) | 19.1% |
| 3 | RM10 (Dagenham) | 19.0% |
| 4 | RM9 (Dagenham) | 18.6% |
| 5 | IG11 (Barking) | 5.6% |
These growth figures really highlight why investors have been getting excited about Barking and Dagenham. RM6 (Chadwell Heath) has been the star performer with an impressive 24.5% growth over five years – that's the kind of return that makes a real difference to your portfolio if you purchased at the right time. What's fascinating is how the three Dagenham postcode areas have all grown at nearly identical rates, hovering around 19%, suggesting a widespread uplift across the area rather than just isolated pockets of improvement. The surprise here is IG11 (Barking) with its modest 5.6% growth, especially given it leads in rental yields and transaction volumes. For investors playing the long game, this gap suggests Barking could be next in line for stronger growth as the ripple of regeneration continues across East London.
Average Monthly Property Sales in Barking and Dagenham
Updated May 2025
The data represents the average number of residential property sales per month across Barking and Dagenham's postcode districts, based on transactions recorded over the past 3 months.
| Rank | Area | Average Monthly Sales |
|---|---|---|
| 1 | IG11 (Barking) | 24 |
| 2 | RM6 (Chadwell Heath) | 20 |
| 3 | RM10 (Dagenham) | 17 |
| 4 | RM8 (Becontree) | 16 |
| 5 | RM9 (Dagenham) | 15 |
These sales figures tell an interesting story about Barking and Dagenham's property market. IG11 (Barking) leads the pack with 24 sales per month. Which makes perfect sense given it offers the most affordable entry point in the borough at £312,486. It's a good reminder that price really does drive demand! I'm also struck by how RM6 (including Chadwell Heath) maintains strong sales activity despite having the highest prices in the area. This suggests buyers see genuine value there, possibly due to it's higher-end feel. Remember that these figures represent the entire market, including different property types and price points, so individual segments may experience faster or slower sales rates.
Planning Applications in Barking and Dagenham
Updated May 2025
The data represents the average number of planning applications submitted per month in each postcode district, along with the percentage of applications that receive approval.
| Rank | Area | Monthly Applications | Success Rate |
|---|---|---|---|
| 1 | RM6 (Chadwell Heath) | 31 | 78% |
| 2 | RM8 (Becontree) | 28 | 75% |
| 3 | IG11 (Barking) | 24 | 73% |
| 4 | RM10 (Dagenham) | 24 | 73% |
| 5 | RM9 (Dagenham) | 23 | 71% |
When you look at these planning figures, you're seeing real evidence of Barking and Dagenham's transformation story. RM6 postcode district (including Chadwell Heath area) is clearly leading the charge with 31 monthly applications and a strong 78% success rate. What we find particularly interesting is how consistent the approval rates are across the borough, hovering between 71-78%. This suggests a council with a reasonably predictable planning approach that's generally supportive of appropriate development. If you're considering a property that might benefit from an extension or conversion, these approval rates should give you some confidence, especially in RM6 and RM8 areas. For the everyday investor, these numbers show a borough that's actively evolving, with residents improving their properties. Remember that these figures represent averages across each postcode, and specific streets or property types may experience different levels of planning activity and success rates.
Property Data Sources
Our location guide relies on diverse, authoritative datasets including:
- HM Land Registry UK House Price Index
- Ministry of Housing, Communities and Local Government
- Government Planning and Housing Data
- Propertydata.co.uk
We update our property data quarterly to ensure accuracy. Last update: May 2025. All data is presented as provided by our sources without adjustments or amendments.
Barking and Dagenham Rental Market Analysis
For those buying their first rental property, and thinking about how much they can charge for rent across the London borough of Barking and Dagenham.
The rental data below gives you an indication of the rental income per month and the potential highest rental yields across the London borough that landlords can aim to achieve for traditional assured shorthold tenants.
This is helpful if you are considering building a property portfolio in this area.
Rental Prices in Barking and Dagenham (£)
Updated May 2025
The data represents the average monthly rent for long-let AST properties in Barking and Dagenham. These figures reflect rents across all property types and do not account for differences in property size, number of bedrooms, or short-term lets.
| Rank | Area | Average Weekly Rent | Average Monthly Rent |
|---|---|---|---|
| 1 | RM6 (Chadwell Heath) | £464 | £2,011 |
| 2 | RM10 (Dagenham) | £452 | £1,959 |
| 3 | RM8 (Becontree) | £428 | £1,855 |
| 4 | RM9 (Dagenham) | £421 | £1,824 |
| 5 | IG11 (Barking) | £410 | £1,777 |
Looking at these rental figures, you might be pleasantly surprised by what you're seeing. Barking and Dagenham offers some of London's most accessible rental prices, with even the priciest area – RM6 (Chadwell Heath) at £464 weekly – sitting well below what you'd pay in most London postcodes. What's really interesting is how IG11 (Barking) combines the lowest entry price for buyers with the most affordable rents – yet still delivers the borough's highest yield at 6.8%. It's like finding that perfect balance where everyone wins – tenants get more affordable homes, and landlords still see healthy returns. This sweet spot exists because the area's excellent transport links and ongoing regeneration create genuine tenant demand without the premium prices found elsewhere in London. I've worked with many investors who've built successful portfolios here precisely because of this balanced equation. These figures represent average rents across all property types, from studio apartments to larger houses, and actual achievable rents can vary significantly based on property size, condition, and specific location within each postcode.
Gross Rental Yields in Barking and Dagenham (%)
Updated May 2025
The data represents the average gross rental yields across different postcode districts in Barking and Dagenham, calculated using a snapshot of current properties for sale and properties for rent. These figures are based on asking prices.
| Rank | Area | Gross Rental Yield |
|---|---|---|
| 1 | IG11 (Barking) | 6.8% |
| 2 | RM10 (Dagenham) | 6.2% |
| 3 | RM8 (Becontree) | 5.8% |
| 4 | RM9 (Dagenham) | 5.6% |
| 5 | RM6 (Chadwell Heath) | 5.6% |
Barking and Dagenham stands out as one of London's rental yield hotspots, with returns that are only usually found in the Midlands or up North. IG11 (Barking) leads the borough with an impressive 6.8% yield. RM10 (Dagenham) follows closely at 6.2%, while even the "lowest" performers in the borough – RM9 (Dagenham) and RM6 (Chadwell Heath) at 5.6%, still deliver yields that most London boroughs can't match. What's particularly noteworthy is the consistency across the entire borough, with all areas delivering 5.6% or higher, making this a genuine option for buy-to-let landlords seeking properties that can cover costs and provide additional cashflow not just reliance on potential capital growth. Remember that these figures represent gross rental yields before accounting for costs such as maintenance, void periods, and management fees.
Access our selection of exclusive, high-yielding, residential investment property deals and a personal consultant to guide you through your options.
Is Barking and Dagenham Rent High?
Yes, Barking and Dagenham's rental prices represent a substantial financial burden for local residents, despite being among London's more affordable areas.
Average rent in Barking and Dagenham consumes between 66.46% to 75.21% of local earnings based on the data showing a mean annual income of £32,080 for the borough.
This financial squeeze is most pronounced in RM6 (Chadwell Heath) where local rents reach £464 per week. Based on local mean earnings, a household with only one family member earning local incomes, tenants here need to allocate 75.21% of their income just to pay for rents, leaving precious little for utilities, food, and other essentials.
The situation remains challenging in RM10 (Dagenham), where weekly rents of £452 would require 73.27% of mean income, creating similar financial pressure for residents.
Even in the most affordable area, IG11 (Barking), where weekly rents average £410, residents still need to commit 66.46% of their mean income to housing costs.
These high rental-to-income ratios highlight the "affordability gap" that exists throughout London. While Barking and Dagenham offers lower absolute rents than many boroughs, the relatively low local wages mean residents face the same financial strain as those in more expensive areas.
For housing providers like councils, housing associations and buy-to-let landlords, this presents both an opportunity and an ethical consideration. The strong rental demand creates a solid investment case, but understanding the financial reality for tenants is essential and more affordable housing is needed.
Buy-to-Let Considerations
Are Barking and Dagenham House Prices High?
No, compared to the 32 London boroughs, Barking and Dagenham stands out as one of London's most affordable boroughs, offering exceptional value.
The borough's average property price of £363,323 sits just 35.4% above the UK average of £268,319, but a remarkable 34.6% below the London average of £555,625. This makes Barking and Dagenham a rare find for investors seeking London property without the typical London price tag.
The average asking prices for properties across the borough vary between postcodes, from the most expensive RM6 (Chadwell Heath) at £431,464 to the most affordable IG11 (Barking) at £312,486. Even the priciest area sits well below London averages.
When examining property types, East London's most affordable borough shows detached homes averaging £634,510 (44.5% below London average), semi-detached houses at £469,536 (33.4% below London average), terraced properties at £392,272 (37.7% below London average), and flats at £251,389 (43.1% below London average).
These significant discounts across all property types reveal why rental yield focused investors are increasingly drawn to this area.
Median annual earnings in Barking and Dagenham are £28,941 (with 3.9%+ annual change).
Mean annual earnings in Barking and Dagenham are £32,080 (with a 3.6%+ annual increase).
Considering the cost of living in London, these local earnings are low, even compared to UK averages.
Salary to house price ratios
To afford an average local house, residents affordability ratios are:
- RM6 (Chadwell Heath) - 13.45 times mean annual salary
- RM9 (Dagenham) - 12.20 times mean annual salary
- RM8 (Becontree) - 11.91 times mean annual salary
- RM10 (Dagenham) - 11.83 times mean annual salary
- IG11 (Barking) - 9.74 times mean annual salary
For local property buyers on 'mean full-time earnings', purchasing in the most affordable area, IG11 (Barking), requires 9.74 times annual salary, remarkably similar to greater London's ratio.
With London's average house price of £555,625 and mean income of £56,752, the typical London buyer needs about 9.79 times their annual salary to buy a property.
So while Barking and Dagenham offers better value than most London boroughs in absolute terms, local residents on average incomes still face the same affordability challenges as their counterparts across the capital.
This highlights the persistent gap between earnings and housing costs throughout London, even in its most accessibly-priced areas.
How Much Deposit to Buy a House in Barking and Dagenham?
Assuming a 30% deposit for buy-to-let investments, here's an overview of deposit requirements across different Brent regions:
Barking Area
- IG11 (including Barking): Investors considering properties in this area (typical value £312,486) would need to prepare a 30% deposit of £93,746.
Dagenham Areas
- RM10 (including Dagenham): Purchasing in this area with significant growth potential requires a 30% down payment of £113,861 based on median property values of £379,535.
- RM6 (including Chadwell Heath): To secure a home here, landlords should budget for a 30% deposit of £129,439 on properties typically priced around £431,464.
- RM8 (including Becontree): Property buyers in this established neighbourhood need to allocate £114,603 for a 30% deposit on homes valued at approximately £382,010.
- RM9 (including Dagenham): Investors looking at this area should prepare a 30% contribution of £117,442 for properties with median prices of £391,474.
If you’re new to property, or just starting out through a property training course, Barking (IG11) offers the most affordable entry point with lower deposit requirements than other areas in the borough. While its 5.6% growth might seem modest compared to the impressive 24.5% in RM6 (including Chadwell Heath), this actually represents a more sustainable, reliable trajectory that's less likely to experience a correction. Combined with the borough's strongest rental yield at 6.8% it could represent an opportunity for growth that isn't too over heated.
How to Invest in Buy-to-Let in Barking and Dagenham
For properties to buy in Barking and Dagenham, including:
- Finding off-market properties
- Buy-to-lets
- Buying a Holiday let or investing in serviced accommodation
- HMOs (houses of multiple occupation)
- PBSA (purpose-built student accommodation)
- and other high-yielding opportunities
We have partnered with the best property investment agents we can find for 8+ years.
Here you can get access to the latest investment property opportunities from our network.
For more information about specific areas:
- If you're interested in the highest rental returns in the London borough of Barking and Dagenham, consider IG11 (Barking) with yields of 6.8% and RM10 (Dagenham) at 6.2%
- For an alternative look at the local London housing market, with affordable entry prices, check out our guide to the cheapest areas to live in London.
- For different opportunities further afield, consider exploring buy-to-let in Bristol or buy-to-let in Gloucester.
