Brent Property Investment: Best Buy-to-Let Areas
Sandwiched between the £2 million Victorian villas of Queen's Park and the sprawling retail parks of Park Royal, the London borough of Brent defies easy categorisation. This is a borough where stadium crowds spill out from Wembley and red-brick council estates back onto £1.2 million detached homes.
The property numbers tell a tale of stark contrasts that shrewd investors can leverage. While NW6 (Kilburn) commands a staggering £864 per square foot, HA9 (Wembley Park) – despite its Olympic Way regeneration and 35.9% five-year growth – still offers flats at prices that would barely buy you a garage in neighbouring Westminster.
The real Brent story lies in its extremes: Cricklewood's family-friendly streets feel worlds apart from the gleaming high-rises sprouting around Wembley Stadium. For landlords seeking genuine returns, NW9 (including Colindale) delivers yields of 5.4% (almost unheard of this close to Zone 2).
This in-depth analysis reveals which Brent postcodes truly deliver on affordability, value, yields and growth.
Article updated: May 2025
Brent Buy-to-Let Market Overview 2025
Brent's property market offers investors a blend of established neighborhoods and regeneration areas with prices almost identical to London's average. The borough shows interesting variation across its postcodes, with NW6 (Kilburn) commanding the highest prices while NW9 (Colindale) delivers the strongest yields.
- Price range: £458,004 (NW9) to £710,333 (NW6)
- Rental yields: 3.6% to 5.4% across different postcodes
- Rental income: Weekly rents from £447 to £495 (monthly: £1,937 to £2,145)
- Price per sq ft: Premium areas reach £864/sq ft while affordable areas start at £528/sq ft
- Affordability: Property prices range from 12.8 to 19.9 times local annual salaries
Contents

-
by Robert Jones, Founder of Property Investments UK
With two decades in UK property, Rob has been investing in buy-to-let since 2005, and uses property data to develop tools for property market analysis.

Property Data Sources
Our location guide relies on diverse, authoritative datasets including:
- HM Land Registry UK House Price Index
- Ministry of Housing, Communities and Local Government
- Government Planning and Housing Data
- Propertydata.co.uk
We update our property data quarterly to ensure accuracy. Last update: May 2025. All data is presented as provided by our sources without adjustments or amendments.
Why Invest in Brent?
Brent is a borough that closely mirrors the overall London average property prices, with sold house prices just 0.1% below the London average.
Often in property, house price growth is seen to be closely connected with population growth and development. Brent has seen substantial regeneration in recent years, particularly around Wembley Park, which has contributed to its exceptional growth rates in population and house prices across certain postcodes.
Total population growth has been higher than UK averages and even higher than average population growth across the rest of London.
The total population of Brent was 339,800 (as of the last UK government census in 2021) and Brent's population has increased by 9.2%, growing from 311,215 in 2011.
Brent borough includes the areas of Kilburn, Willesden, Cricklewood, Wembley, Wembley Park, Colindale, Alperton, Harlesden, Neasden, Queens Park, and Kensal Green.
Brent is covered by the main postcodes: NW2, NW6, NW9, NW10, HA0, and HA9
With additional postcodes that cross Brent and other local London Boroughs including:
- HA1, HA3 and HA7 crosses Brent and Harrow
- HA8 crosses Brent, Barnet and Harrow
Brent Property Market Analysis
When Was the Last House Price Crash in Brent?
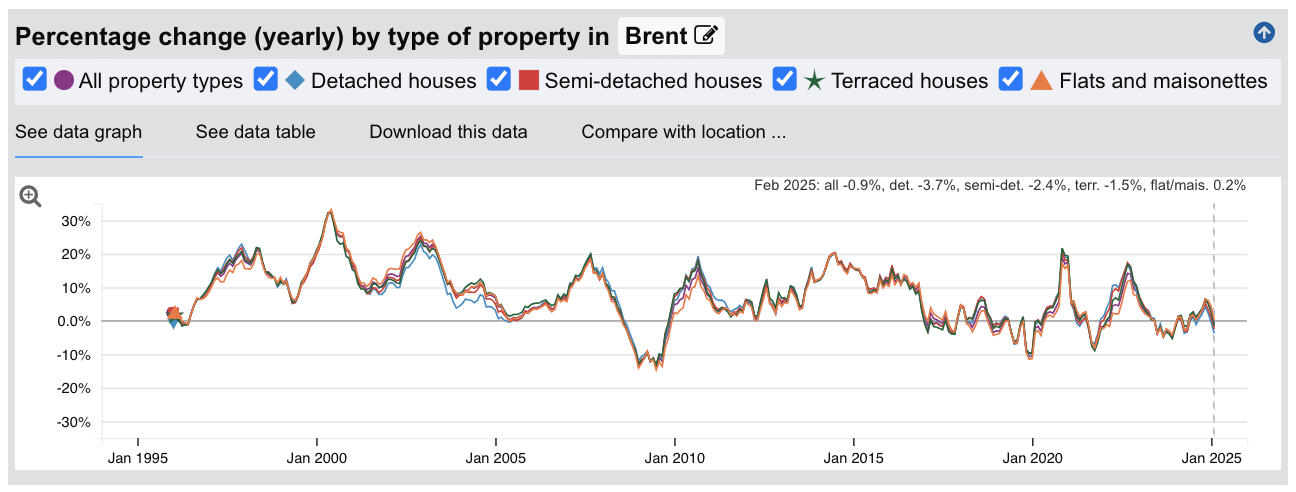
The last significant property price crash in Brent occurred during the global financial crisis of 2008-2010 with a small drop in Oct 2019 to Jan 2020 and Oct 2022 to Feb 2023.
Source: HM Land Registry House Price Index
Looking at the property data across all types:
- 1995-2000: Steady growth period with annual increases of 5-20%
- 2000-2003: Accelerated growth with peaks reaching 25-30% annual increases
- 2003-2007: Continued strong but somewhat steady growth
- 2008-2010: Significant house price crash during the financial crisis, with values dropping by approximately 15%
- 2010-2013: Recovery period with modest growth resuming
- 2013-2016: Sustained growth period with annual increases of 10-20%
- 2016-2020: Mixed performance with periods of growth and minor corrections
- 2020-2022: Despite pandemic uncertainty, strong growth resumed with values increasing significantly
- 2022-2024: Modest correction with small declines across most property types
- 2025: Recent data (Feb 2025) shows negative annual growth across most property types: all property types (-0.9%), detached houses (-3.7%), semi-detached houses (-2.4%), and terraced houses (-1.5%). Only flats and maisonettes show positive growth at 0.2%.
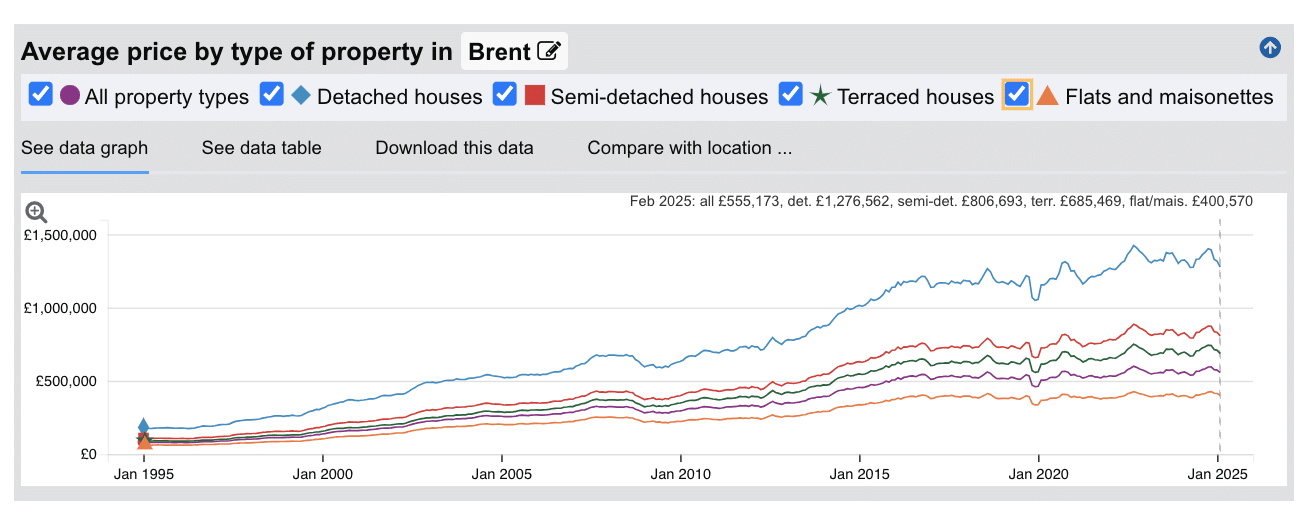
Brent has demonstrated good resilience during market downturns, particularly considering its more diverse housing stock compared to some other London boroughs. The long-term price trajectories show substantial appreciation, with detached properties increasing from approximately £176,169 in 1995 to over £1,276,562 by 2025 - more than a seven-fold increase that significantly outperforms inflation.
House Prices in Brent: Sold (£)
The latest sold house price index by the Land Registry, shows the following average sold house prices across the London Borough of Brent.
While detached houses in Brent command a significant premium at 11.7% above the London average, semi-detached houses show an even higher premium at 14.4% above.
Terraced houses in Brent sit at a healthy premium of 8.9% above London averages, while flats and maisonettes are the only property type showing a discount, coming in 9.3% below typical London prices.
For investors weighing up their options across their investment property checklist, Brent's flat market offers the best value entry point into this popular borough. The substantial premium for family homes – particularly semi-detached properties – reflects Brent's appeal to families but the extra prices mean it's likely out of the range of providing rental yield value for investors. With average detached house prices at £1,276,562, Brent has established itself as a prime location for family homes in North London.
Updated May 2025
| Property Type | Brent Average Price | London Average | Difference |
|---|---|---|---|
| Detached houses | £1,276,562 | £1,142,545 | +11.7% |
| Semi-detached houses | £806,693 | £705,187 | +14.4% |
| Terraced houses | £685,469 | £629,315 | +8.9% |
| Flats and maisonettes | £400,570 | £441,704 | -9.3% |
| All property types | £555,173 | £555,625 | -0.1% |
Property Data Sources
Our location guide relies on diverse, authoritative datasets including:
- HM Land Registry UK House Price Index
- Ministry of Housing, Communities and Local Government
- Government Planning and Housing Data
- Propertydata.co.uk
We update our property data quarterly to ensure accuracy. Last update: May 2025. All data is presented as provided by our sources without adjustments or amendments.
House Prices in Brent: For Sale Asking Prices (£)
Updated May 2025
The data represents the average asking prices of properties currently listed for sale in Brent.
| Rank | Area | Average House Price |
|---|---|---|
| 1 | NW6 (Kilburn) | £710,333 |
| 2 | NW2 (Cricklewood) | £616,086 |
| 3 | NW10 (Willesden) | £524,468 |
| 4 | HA9 (Wembley Park) | £516,499 |
| 5 | HA0 (Wembley) | £465,484 |
| 6 | NW9 (Colindale) | £458,004 |
Brent's property prices are much more tightly bunched than many other London boroughs, with NW6 (Kilburn) topping the table at £710,333 and NW9 (Colindale) at the bottom with £458,004 – a difference of around £250,000. This is relatively modest compared to other areas where the gap can be £600,000+. NW2 (Cricklewood) sits comfortably in second place at £616,086, while NW10 (Willesden) and HA9 (Wembley Park) are nearly neck-and-neck at just over £500,000. HA0 (Wembley) offers slightly better value at £465,484. What's interesting here is how the price rankings match almost perfectly with the price per square foot data – NW6 tops both tables, while NW9 sits at the bottom of each. The only exception is HA9, which has shown the strongest growth yet remains one of the more affordable areas to buy, suggesting buyers are getting better value here. These are averages across all property types, so a two-bed flat in Kilburn might set you back less than these figures, while a family house in Colindale could cost substantially more.
Sold Price Per Square Foot in Brent (£)
Updated May 2025
The data represents the average sold price per square foot of properties actually sold in Brent over the past 18 months.
| Rank | Area | Price Per Square Foot |
|---|---|---|
| 1 | NW6 (Kilburn) | £864 |
| 2 | NW2 (Cricklewood) | £631 |
| 3 | NW10 (Willesden) | £629 |
| 4 | NW9 (Colindale) | £550 |
| 5 | HA0 (Wembley) | £546 |
| 6 | HA9 (Wembley Park) | £528 |
Looking at what you get for your money across Brent, there's a clear premium for NW6 (Kilburn), where you'll pay a whopping £864 per square foot – far ahead of anywhere else in the borough. This reflects its Zone 2 location and proximity to West Hampstead and St John's Wood. There's then quite a drop to NW2 (Cricklewood) and NW10 (Willesden), which sit at £631 and £629 respectively. The more affordable end of the scale includes NW9 (Colindale) at £550, HA0 (Wembley) at £546, and surprisingly, HA9 (Wembley Park) at £528. What's particularly interesting is that HA9, despite showing the strongest price growth over five years (35.9%), still offers the most space for your money. This suggests there's still room for growth in the area. Meanwhile, NW6's sky-high square footage prices explain its lower rental yield (3.6%) – investors are paying a premium for the location, which eats into potential returns. These figures cover all property types, so terraced houses might show different values to flats in the same area.
House Price Growth in Brent (%)
Updated May 2025
The data represents the average house price growth over the past five years, calculated using a blended rolling annual comparison of both sold prices and asking prices.
| Rank | Area | 5 Year Growth |
|---|---|---|
| 1 | HA9 (Wembley Park) | 35.9% |
| 2 | NW10 (Willesden) | 23.5% |
| 3 | NW2 (Cricklewood) | 15.7% |
| 4 | NW6 (Kilburn) | 11.2% |
| 5 | HA0 (Wembley) | 9.9% |
| 6 | NW9 (Colindale) | 3.0% |
Brent's growth figures show remarkable differences across the borough. Wembley Park (HA9) stands out with a hefty 35.9% five-year growth rate, likely down to the ongoing transformation around the stadium and improved transport links. Willesden (NW10) has performed well too at 23.5%, whilst Cricklewood (NW2) has posted a respectable 15.7% growth. The more established areas of Kilburn (NW6) and Wembley (HA0) have seen more modest increases at 11.2% and 9.9%.
Average Monthly Property Sales in Brent
Updated May 2025
The data represents the average number of residential property sales per month across Brent's postcode districts, based on transactions recorded over the past 3 months.
| Rank | Area | Average Monthly Sales |
|---|---|---|
| 1 | NW6 (Kilburn) | 36 |
| 2 | NW10 (Willesden) | 33 |
| 3 | NW9 (Colindale) | 25 |
| 4 | NW2 (Cricklewood) | 24 |
| 5 | HA9 (Wembley Park) | 21 |
| 6 | HA0 (Wembley) | 15 |
Brent's property market shows relatively strong transaction volumes across the borough. Kilburn (NW6) leads with the highest activity at 36 sales per month, closely followed by Willesden (NW10) with 33 monthly sales. This robust transaction level in Kilburn is particularly notable given it has the lowest number of planning applications in the borough, suggesting a mature market with ongoing appeal to buyers. Colindale (NW9) and Cricklewood (NW2) maintain steady activity with 25 and 24 sales respectively per month. There's a noticeable drop in transaction volumes for Wembley Park (HA9) at 21 sales, and a further significant decrease for Wembley (HA0) with only 15 monthly sales. For investors, areas with higher transaction volumes like Kilburn and Willesden typically offer greater market liquidity, making entry and exit strategies more flexible.
Planning Applications in Brent
Updated May 2025
The data represents the average number of planning applications submitted per month in each postcode district, along with the percentage of applications that receive approval.
| Rank | Area | Monthly Applications | Success Rate |
|---|---|---|---|
| 1 | NW2 (Cricklewood) | 81 | 79% |
| 2 | NW10 (Willesden) | 69 | 75% |
| 3 | NW9 (Colindale) | 50 | 74% |
| 4 | HA9 (Wembley Park) | 44 | 72% |
| 5 | HA0 (Wembley) | 42 | 72% |
| 6 | NW6 (Kilburn) | 38 | 84% |
Planning application data reveals significant development activity across Brent, with Cricklewood (NW2) leading at an impressive 81 applications per month, followed by Willesden (NW10) with 69. These figures indicate substantial regeneration and development interest in these areas. Success rates vary across the borough, with Kilburn (NW6) achieving the highest approval rate at 84%, despite having the lowest number of monthly applications. Cricklewood combines both high application volume and a strong 79% success rate, suggesting robust development momentum. For investors, this data highlights Cricklewood and Willesden as areas experiencing significant development activity, while Kilburn's high approval rate indicates a planning environment potentially more favourable to selective, higher quality proposals. Areas with both substantial application numbers and good success rates may point to neighbourhoods undergoing positive transformation and significant investment across smaller sites by local residents that could enhance property values over time.
Property Data Sources
Our location guide relies on diverse, authoritative datasets including:
- HM Land Registry UK House Price Index
- Ministry of Housing, Communities and Local Government
- Government Planning and Housing Data
- Propertydata.co.uk
We update our property data quarterly to ensure accuracy. Last update: May 2025. All data is presented as provided by our sources without adjustments or amendments.
Brent Rental Market Analysis
For those purchasing rental property, and thinking about how much they can charge for rent in Brent?
The rental data below gives you an indication on the rental income per month and the rental yields landlords can aim to achieve for traditional assured shorthold tenants. This is helpful if you are considering building a buy-to-let portfolio in this area.
Rental Prices in Brent (£)
Updated May 2025
The data represents the average monthly rent for long-let AST properties in Brent. These figures reflect rents across all property types and do not account for differences in property size, number of bedrooms, or short-term lets.
| Rank | Area | Average Weekly Rent | Average Monthly Rent |
|---|---|---|---|
| 1 | NW6 (Kilburn) | £495 | £2,145 |
| 2 | HA9 (Wembley Park) | £482 | £2,089 |
| 3 | NW9 (Colindale) | £471 | £2,041 |
| 4 | HA0 (Wembley) | £462 | £2,002 |
| 5 | NW2 (Cricklewood) | £457 | £1,980 |
| 6 | NW10 (Willesden) | £447 | £1,937 |
Brent's rental market shows relatively consistent pricing across different areas, with Kilburn (NW6) commanding the highest average weekly rents at £495 (£2,145 monthly), followed closely by Wembley Park (HA9) at £482 weekly. Colindale (NW9) and Wembley (HA0) occupy the middle tier, offering weekly rents of £471 and £462 respectively. Cricklewood (NW2) and Willesden (NW10) represent the more affordable options in the borough, though with weekly rents still above £440. Interestingly, Colindale (NW9), which offers the highest rental yields at 5.4%, commands moderately high rents while benefiting from more accessible property prices. This creates an attractive balance for investors seeking strong returns. These figures represent average rents across all property types, from studio apartments to larger houses, and actual achievable rents can vary significantly based on property size, condition, and specific location within each postcode.
Gross Rental Yields in Brent (%)
Updated May 2025
The data represents the average gross rental yields across different postcode districts in Brent, calculated using a snapshot of current properties for sale and properties for rent. These figures are based on asking prices.
| Rank | Area | Gross Rental Yield |
|---|---|---|
| 1 | NW9 (Colindale) | 5.4% |
| 2 | HA0 (Wembley) | 5.2% |
| 3 | HA9 (Wembley Park) | 4.8% |
| 4 | NW10 (Willesden) | 4.4% |
| 5 | NW2 (Cricklewood) | 3.9% |
| 6 | NW6 (Kilburn) | 3.6% |
Brent's rental yields show notable variation across different postcodes, with Colindale (NW9) offering the highest yield at 5.4%, followed by Wembley (HA0) at 5.2%. These areas typically have more accessible property prices while maintaining strong rental demand. Wembley Park (HA9) and Willesden (NW10) offer solid mid-range yields at 4.8% and 4.4% respectively. Premium areas like Cricklewood (NW2) and Kilburn (NW6) show lower yields of 3.9% and 3.6% respectively due to their higher purchase prices. These figures represent gross rental yields calculated from average rents and prices, and investors should note that net yields will be lower after accounting for costs, void periods, and management expenses.
Access our selection of exclusive, high-yielding, residential investment property deals and a personal consultant to guide you through your options.
Is Brent Rent High?
Yes, Brent's rental prices represent a substantial financial burden for local residents, consuming a significant percentage of local incomes.
Average rent in Brent costs an eye watering 65.15% to 72.15% as a percentage of earnings based on the ONS earnings data showing Brent's mean annual income at £35,677.
Interestingly this is most extreme in Brent in the NW6 postcode district where local rents are the highest at £495 per week currently based on the market local comparisons at the time of data collection.
Based on local average mean earnings this would require tenants to pay 72.15% of their income just to pay for rental housing costs (before tax, utilities, and other living expenses)
The situation is similar in Wembley Park (HA9), where weekly rents of £482 would require 70.25% of the mean income for tenants to pay on only their rents.
Even in more affordable areas like NW10, where weekly rents average £447, residents still need to commit 65.15% of mean income to rent.
The rental-to-income ratio in Brent highlights the significant "affordability gap" that exists across London boroughs for local residents, where rental costs and local London rental yields have risen faster than wages for a consistent number of years.
Buy-to-Let Considerations
Are Brent House Prices High?
Yes, Brent is seen as expensive when compared to the rest of the UK, although for some property types it is inline with London averages.
Bren's average property price of £555,173 sits 106.9% above the UK average of £268,319, making affordability a challenge for new property buyers looking to get on the housing ladder.
In context to London averages, Brent is almost exactly in line with the London average of £555,625, reflecting its position as a representative London borough in terms of property prices.
The average asking prices for properties in Brent currently on the market vary considerably across postcodes, from the most expensive Brent postcode of NW6 (Kilburn) at £710,333 and NW2 (Cricklewood) at £616,086 to the more accessible areas of NW9 (Colindale) at £458,004 and HA0 (Wembley) at £465,484.
When we look at property types, Brent's detached homes average £1,276,562 (191.5% above the UK average of £438,255), while semi-detached houses average £806,693 (197.8% above the UK average of £270,925). Terraced properties in Brent average £685,469 (203.9% above the UK average of £225,486), and flats average £400,570 (104.3% above the UK average of £196,110).
Interestingly, median annual earnings in Brent comes in at £32,225 (with 9.9% annual change), which puts significant pressure on affordability, with residents earning near the local median income struggling to afford the high property prices.
Whilst mean earnings in Brent are £35,677 (with 7.8% annual change), which is still insufficient to comfortably afford the high property prices in the borough.
Salary to house price ratios
- Kilburn (NW6) - 22.0 times median annual salary
- Cricklewood (NW2) - 19.1 times median annual salary
- Willesden (NW10) - 16.3 times median annual salary
- Wembley Park (HA9) - 16.0 times median annual salary
- Wembley (HA0) - 14.4 times median annual salary
- Colindale (NW9) - 14.2 times median annual salary
Meaning that for a local property buyer on 'median full-time earnings', to buy a property across Brent would require between 14.2 and 22.0 times annual salary.
In the most affordable area, Colindale (NW9 postcode district), requires around 14.2 times median annual salary, while the more affluent areas like Kilburn (NW6 postcode district) currently exceed 22.0 times the local median wage.
Source: ONS Earnings and Hours Worked dataset
For buy-to-let investors, these high price-to-income ratios typically translate to significantly lower rental yields compared to other parts of the UK. This is creating a compounding effect of low supply of new rental properties, putting more pressure on local rents and affordability.
How Much Deposit to Buy a House in Brent?
Assuming a 30% deposit for buy-to-let investments, here's an overview of deposit requirements across different Brent regions:
North Brent
- HA9 (including Wembley Park): Investors eyeing properties in this area (typical value £516,499) would need to prepare a 30% deposit of £154,950.
- HA0 (including Wembley): Purchasing in this popular district requires a 30% down payment of £139,645 based on median property values of £465,484.
- NW9 (including Colindale): To secure a home here, landlords should budget for a 30% deposit of £137,401 on properties typically priced around £458,004.
Central Brent
- NW2 (including Cricklewood): Property buyers in this central location need to allocate £184,826 for a 30% deposit on homes valued at approximately £616,086.
- NW10 (including Willesden): Investors looking at this neighbourhood should prepare a 30% contribution of £157,340 for properties with median prices of £524,468.
South Brent
- NW6 (including Kilburn): In this sought-after southern section, buyers will require a more substantial 30% deposit of £213,100 for properties typically listed at £710,333.
If you’re new to property, or just starting out through a property training course, areas like Colindale (NW9) and Wembley (HA0) offer potentially more affordable prices for the average buyer looking for value.

How to Invest in Buy-to-Let in Brent
For properties to buy in Brent, including:
- Finding off-market properties
- Buy-to-lets
- Buying a Holiday let or investing in serviced accommodation
- HMOs (houses of multiple occupation)
- PBSA (purpose-built student accommodation)
- and other high-yielding opportunities
We have partnered with the best property investment agents we can find for 8+ years.
Here you can get access to the latest investment property opportunities from our network.
For more information about specific areas:
- If you're interested in the highest rental returns in Brent, consider NW9 (Colindale) with yields of 5.4% and HA0 (Wembley) at 5.2%
- For an alternative look at the local London housing market, with affordable entry prices, check out our guide to the cheapest areas to live in London.
- For different opportunities further afield consider exploring buy-to-let in Cheltenham or buy-to-let in Wiltshire.
