Where to Buy Property Investments in Haringey: Yields of 5.7%
Haringey's top postcode yield of 5.7% sits in N17 (Tottenham), where asking prices average £437,618 and monthly rents reach £2,088. At a borough-level average sold price of £637,041, Haringey is 119.3% above the England average of £290,437. The borough's population grew 3.65% between the 2011 and 2021 censuses, from 254,926 to 264,238.
Gross rental yields across Haringey's 11 postcodes range from 3.2% in N14 (Southgate) to 5.7% in N17 (Tottenham), a spread that reflects a borough divided between its affordable eastern corridor and its premium western ridge. Asking prices run from £437,618 in N17 to £812,165 in N6 (Highgate), with a mean of £590,130 and a mean monthly rent of £2,065. Seven of the 11 postcodes sit below the borough mean, with the three cheapest (N17, N15, N22) concentrated in the Tottenham and Wood Green corridor where £2 billion of regeneration investment is focused.
Haringey is a North London borough covering approximately 11 square miles. It borders Enfield to the north, Waltham Forest and Hackney to the east, Islington and Camden to the south, and Barnet to the west. The ONS code is E09000014. This guide covers all 11 postcode districts assigned to Haringey, from Tottenham in the east to Highgate and Muswell Hill in the west. Some postcodes cross borough borders: N19 straddles Haringey and Islington, N11 covers parts of the Haringey, Barnet and Enfield border area, N22 crosses into Enfield at its northern edge, and N6 extends into Camden. Browse more London locations or explore buy-to-let property for sale across the UK.
Article updated: April 2026
Haringey Buy-to-Let Market Overview 2026
Haringey's property market splits sharply between affordable eastern postcodes with higher yields and premium western postcodes with compressed returns.
- Average sold price: £637,041 (119.3% above England's £290,437)
- Asking price range: £437,618 (N17, Tottenham) to £812,165 (N6, Highgate)
- Rental yields: 3.2% (N14) to 5.7% (N17) across 11 postcodes with rental data
- Rental income: Monthly rents from £1,785 (N13) to £2,675 (N6)
- Price per sq ft: House prices from £535/sq ft (N13) to £908/sq ft (N6)
- Market activity: Sales ranging from 11 per month (N6) to 37 per month (N4)
- Deposit requirements: 30% deposits range from £131,285 (N17) to £243,650 (N6)
- Affordability ratios: Property prices from 9.9 to 18.5 times Haringey's median annual salary of £43,995
Contents

-
by Robert Jones, Founder of Property Investments UK
With two decades in UK property, Rob has been investing in buy-to-let since 2005, and uses property data to develop tools for property market analysis.

Property Data Sources
Our location guide relies on diverse, authoritative datasets including:
- HM Land Registry UK House Price Index
- Ministry of Housing, Communities and Local Government
- Ordnance Survey Data Hub
- Propertydata.co.uk
We update our property data quarterly to ensure accuracy. Last update: April 2026. All data is presented as provided by our sources without adjustments or amendments.
Why Invest in Haringey?
Haringey is a borough in North London with a population of 264,238 at the 2021 Census, a 3.65% increase from 254,926 in 2011. The borough covers approximately 11 square miles and contains some of the capital's sharpest internal contrasts. Tottenham and Seven Sisters in the east sit at the centre of billion-pound regeneration programmes. Highgate and Muswell Hill in the west are among London's most established residential areas.
The median gross annual salary for Haringey residents is £43,995, based on weekly earnings of £846.10. This is below the London regional median of £46,415 per year (£892.60 per week) but above the Great Britain median of £39,125 per year (£752.40 per week). Haringey's employment rate of 69.9% is below the London average of 75.0%, and the unemployment rate of 6.9% is above London's 5.7%.
The lower employment rate is relevant for buy-to-let investors because it shapes tenant demand profiles. Areas with higher proportions of private renters tend to correlate with mixed employment patterns and younger populations. Haringey's rental market reflects this: all 11 postcodes return rental data, with monthly rents from £1,785 to £2,675.
Haringey Economic Summary
- Population: 264,238 (2021 Census). Growth of 3.65% from 2011.
- Median annual salary: £43,995 (local), £46,415 (London), £39,125 (Great Britain)
- Employment rate: 69.9% (local), 75.0% (London)
- Unemployment rate: 6.9% (local), 5.7% (London)
Source: ONS Census 2021, Nomis Labour Market Profile (ASHE 2025)
Regeneration and Investment in Haringey
More than £2 billion of regeneration investment is concentrated across Haringey's eastern corridor, from Tottenham Hale to High Road West. The combined programmes across Tottenham and Wood Green include over 6,000 new homes and are at various stages of delivery.
- High Road West, Tottenham (Under construction, £2 billion programme): A full regeneration programme adjacent to Tottenham Hotspur Stadium, delivered through a partnership between Lendlease and The Crown Estate. Plans include 2,600 new homes with 40% affordable, including at least 500 council homes at council rents. Phase A (61 homes at Love Lane Estate) was approved in February 2026. Updates at Haringey Council.
- Tottenham Hale (In delivery, £600m+): A major mixed-use development centred on the Tottenham Hale transport hub, comprising 1,032 new homes across seven buildings. Related Argent is delivering the Ferry Island scheme with completion phases through 2026. The nearby Ashley Road Depot will add 275 new council homes. Updates at Haringey Council.
- Wood Green / Haringey Heartlands (London Plan Opportunity Area): Identified for 4,500 new homes and 2,500 new jobs by 2041. Berkeley Group's Alexandra Gate development (formerly Clarendon) includes 1,714 apartments. The Chocolate Factory Phase 2 adds 150 homes at council rent. A new 1-acre public park (Hornsey Park) has already been delivered. Updates at Haringey Council.

Haringey Property Market Analysis
When Was the Last House Price Crash in Haringey?
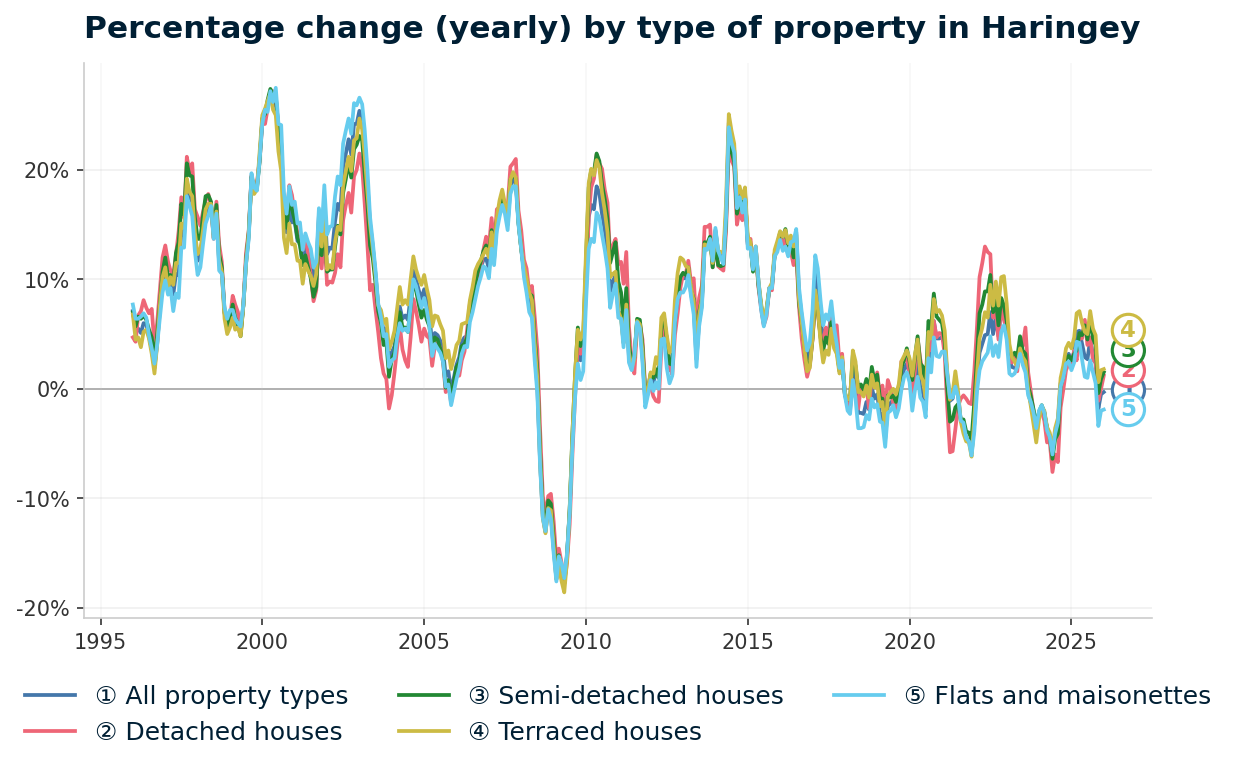
Haringey property prices have risen 676.9% since January 1995, from £81,997 to £637,041 in January 2026. The borough's full Land Registry history shows two major corrections within that run.
The average property price in Haringey peaked at £351,634 in October 2007 before falling 20.4% to a trough of £280,048 in February 2009. That decline was steeper than both London's 17.8% peak-to-trough fall (January 2008 to April 2009) and England's 18.2% decline (September 2007 to March 2009). The worst single annual change reading in Haringey was -17.8% in May 2009.
Here is the full cycle-by-cycle breakdown from HM Land Registry data:
- 1995-2007 (The Boom): Haringey's average price started at £81,997 in January 1995 and climbed to a pre-crash peak of £351,634 by October 2007. That is a 328.8% increase over nearly 13 years, driven by London's sustained economic expansion and low interest rates.
- 2008-2009 (The Financial Crisis): From the October 2007 peak of £351,634, prices fell to £280,048 by February 2009. The 20.4% decline over 16 months was sharper than the London average (17.8%) and the England average (18.2%). The worst annual change reading was -17.8% in May 2009.
- 2010-2013 (Recovery): The recovery was rapid by national standards. By April 2011, just over two years after the trough, the average price reached £352,594 and exceeded the pre-crash peak for the first time. Prices continued climbing through 2013, reaching £419,255 by December 2013 (19.2% above the pre-crash peak). Annual growth rates returned to double digits by late 2013.
- 2014-2016 (London Boom): This was Haringey's fastest-ever period of price growth. Annual change readings exceeded 10% consistently and peaked at 24.3% in June 2014. By July 2016, the average had reached £581,881, more than double the pre-crash trough in just seven years.
Post-recovery: 2017 to present
- 2017-2019 (Brexit Slowdown): Prices peaked at £611,206 in August 2017 and then softened. Through 2019, annual change readings turned negative, ranging from -4.6% in April 2019 to +2.3% by December 2019. The borough essentially stagnated for two years as Brexit uncertainty dampened London transactions.
- 2020-2022 (Pandemic Era): A brief dip to £578,332 in June 2020 was followed by a stamp-duty-holiday-driven recovery. From August 2020, annual growth returned to positive territory. By early 2023, the average price had climbed past £630,000, surpassing the 2017 peak.
- 2023-2024 (Rate Shock): Higher mortgage rates slowed the market. Annual changes turned negative through the first half of 2024, reaching -5.9% in June 2024. Prices held between £590,000 and £640,000 through this period without a sharp crash.
- 2024-2026 (Current): Recovery began in September 2024 (+0.5% annual change) and strengthened through 2025. The all-time high of £651,593 was recorded in September 2025. Prices then eased in Q4 2025, with January 2026 at £637,041 (-0.3% annual change).
Long-term growth summary:
- 5 years (2021-2026): +2.3% growth (£622,431 to £637,041)
- 10 years (2016-2026): +14.1% growth (£558,253 to £637,041)
- 15 years (2011-2026): +87.5% growth (£339,672 to £637,041)
- 20 years (2006-2026): +136.5% growth (£269,341 to £637,041)
- 30 years (1996-2026): +625.6% growth (£87,790 to £637,041)
The five-year figure of +2.3% stands out. After a decade of double-digit London growth, Haringey's borough-level average has been broadly flat since 2021. The 30-year return of 625.6% confirms the long-term trajectory, but the recent stagnation is visible in the 18-year property cycle context. The postcode-level growth table later in this guide shows that this flat borough average masks significant divergence between individual areas.
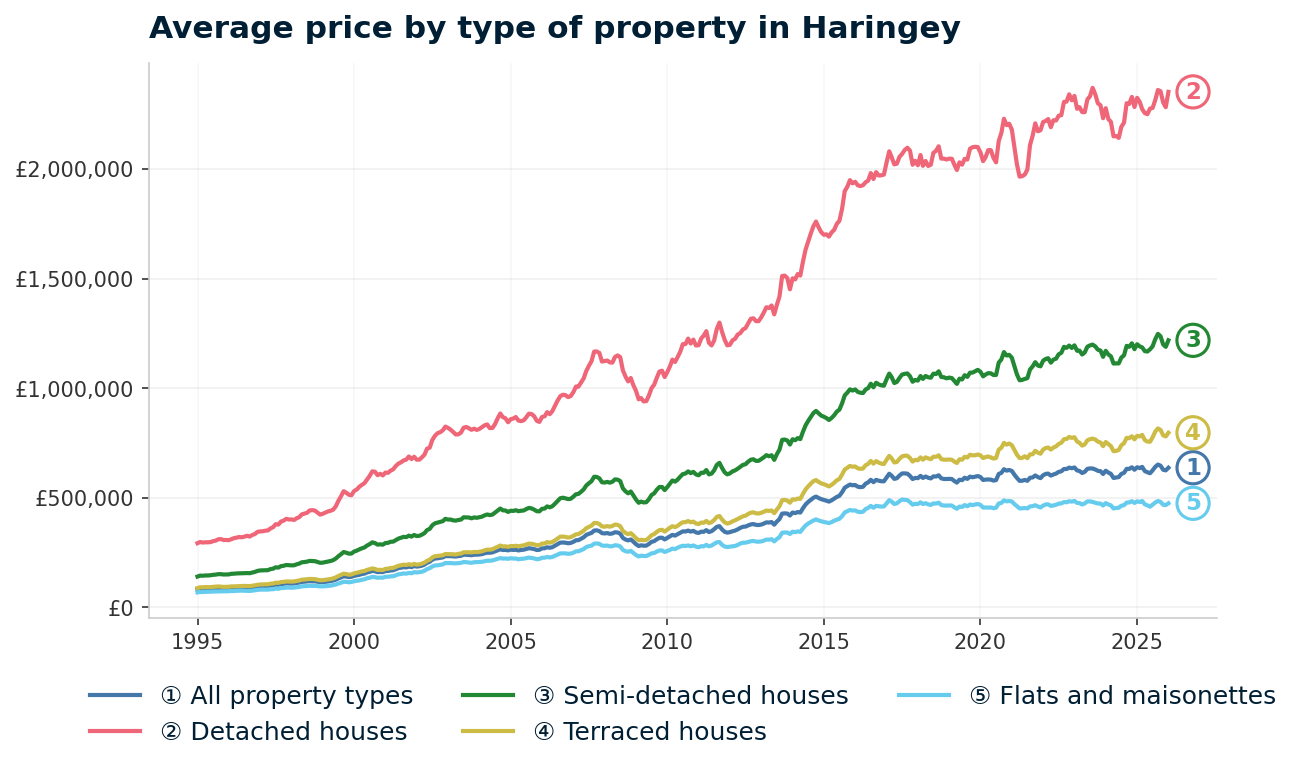
Source: HM Land Registry House Price Index for Haringey, January 1995 to January 2026.
Thinking of Buying?
We have off-market investment properties averaging 8%+ annual yield.
View Property DealsSold House Prices in Haringey
The average sold price across all property types in Haringey is £637,041, which is £346,604 (119.3%) above the England average of £290,437. That premium varies dramatically by property type. Detached houses in Haringey average £2,351,015, more than five times the England average. Flats, which make up the bulk of the borough's housing stock, carry a smaller premium of 117.3% above England.
| Property Type | Haringey Average | England Average | Difference |
|---|---|---|---|
| Detached houses | £2,351,015 | £468,546 | +£1,882,469 (+401.8%) |
| Semi-detached houses | £1,218,067 | £288,046 | +£930,021 (+322.9%) |
| Terraced houses | £796,518 | £243,580 | +£552,938 (+227.0%) |
| Flats and maisonettes | £474,733 | £218,449 | +£256,284 (+117.3%) |
| All property types | £637,041 | £290,437 | +£346,604 (+119.3%) |
Detached houses at £2,351,015 carry the largest premium at 401.8% above England. These are concentrated in Highgate (N6) and Muswell Hill (N10), where large Victorian and Edwardian properties are scarce and command exceptional prices. The volume of detached sales in Haringey is very low, which pushes the average higher.
Semi-detached houses at £1,218,067 sit 322.9% above the England average. The semi-detached stock is clustered in the western and northern postcodes (N10, N14, N8), where tree-lined streets of interwar houses attract families willing to pay a premium for space and school catchments.
Terraced houses at £796,518 are 227.0% above England. Terraced housing is the most common house type across Haringey. The gap between Tottenham terraces and Crouch End terraces is significant, as the asking price data later in this guide shows.
Flats at £474,733 carry the smallest premium at 117.3% above England. Flats dominate the borough's transactions, particularly in Tottenham, Wood Green and along the main transport corridors. The new-build pipeline from the regeneration schemes will add further flat stock in the coming years.
Property Data Sources
Our location guide relies on diverse, authoritative datasets including:
- HM Land Registry UK House Price Index
- Ministry of Housing, Communities and Local Government
- Ordnance Survey Data Hub
- Propertydata.co.uk
We update our property data quarterly to ensure accuracy. Last update: April 2026. All data is presented as provided by our sources without adjustments or amendments.
Price Per Square Foot in Haringey
How much floor space does a pound buy in Haringey? Sold prices per square foot range from £535 in N13 (Palmers Green) to £908 in N6 (Highgate), a 69.7% gap. The price per square foot strips out the effect of property size and reveals where the borough's value concentrations sit. All figures below are based on actual sold transaction data, not asking prices.
| Rank | Area | Price Per Sq Ft |
|---|---|---|
| 1 | N13 (Palmers Green) | £535 |
| 2 | N17 (Tottenham) | £560 |
| 3 | N11 (New Southgate, Bounds Green) | £573 |
| 4 | N14 (Southgate) | £581 |
| 5 | N15 (South Tottenham, Seven Sisters) | £645 |
| 6 | N22 (Wood Green) | £648 |
| 7 | N4 (Finsbury Park, Harringay) | £750 |
| 8 | N10 (Muswell Hill) | £759 |
| 9 | N8 (Crouch End, Hornsey) | £773 |
| 10 | N19 (Archway, Upper Holloway) | £795 |
| 11 | N6 (Highgate) | £908 |
The five cheapest postcodes by floor space (N13, N17, N11, N14, N15) all sit below £650 per square foot. These are concentrated in the northern and eastern parts of the borough. N17 (Tottenham) at £560 per square foot costs 38.3% less than N6 (Highgate) at £908, which means an investor gets substantially more floor space for the same budget in the eastern corridor.
The five most expensive postcodes (N4, N10, N8, N19, N6) range from £750 to £908. These are the western and southern postcodes where Victorian and Edwardian housing stock, proximity to Central London, and established neighbourhood character command a premium on every square foot. The gap between N22 at £648 and N4 at £750 marks the boundary between Haringey's two pricing tiers.
Houses and Flats for Sale in Haringey: Asking Prices
The mean asking price across all 11 Haringey postcodes is £590,130, with a £374,547 gap between the most expensive and most affordable areas. N6 (Highgate) at £812,165 sits at one end. N17 (Tottenham) at £437,618 sits at the other. The table below ranks all postcodes from most expensive to most affordable.
| Rank | Area | Asking Price |
|---|---|---|
| 1 | N6 (Highgate) | £812,165 |
| 2 | N10 (Muswell Hill) | £703,252 |
| 3 | N14 (Southgate) | £688,866 |
| 4 | N4 (Finsbury Park, Harringay) | £625,977 |
| 5 | N8 (Crouch End, Hornsey) | £573,400 |
| 6 | N19 (Archway, Upper Holloway) | £564,286 |
| 7 | N13 (Palmers Green) | £559,810 |
| 8 | N11 (New Southgate, Bounds Green) | £522,337 |
| 9 | N22 (Wood Green) | £522,116 |
| 10 | N15 (South Tottenham, Seven Sisters) | £481,607 |
| 11 | N17 (Tottenham) | £437,618 |
Seven postcodes sit below the borough mean of £590,130: N17, N15, N22, N11, N13, N19 and N8. The five cheapest postcodes (N17, N15, N22, N11, N13) are all in the eastern and northern parts of the borough. Investors looking for below market value properties or renovation properties will find the widest selection in these areas, where asking prices sit between £437,618 and £559,810.
The premium tier (N6, N10, N14) averages £734,761. The affordable tier (N17, N15, N22, N11) averages £490,919. That £243,842 gap between the two tiers is wider than the entire asking price of many regional buy-to-let postcodes outside London. Anyone searching for houses for sale in Haringey will encounter this two-tier market, where the postcode matters as much as the property type.

House Price Growth in Haringey
Two postcodes in the same borough, two opposite trajectories. N8 (Crouch End) has grown 15.5% over five years while N6 (Highgate) has fallen 11.0% over the same period. The borough's most expensive postcodes show double-digit negative growth. Mid-priced and affordable postcodes have grown. The table below ranks all 11 postcodes by five-year growth.
| Area | 1 Year | 3 Years | 5 Years |
|---|---|---|---|
| N8 (Crouch End, Hornsey) | +9.0% | +13.1% | +15.5% |
| N11 (New Southgate, Bounds Green) | -2.0% | -5.8% | +14.7% |
| N22 (Wood Green) | +14.4% | +5.4% | +11.9% |
| N19 (Archway, Upper Holloway) | +5.1% | +3.2% | +8.6% |
| N13 (Palmers Green) | +5.1% | +6.9% | +7.9% |
| N14 (Southgate) | +10.2% | -0.4% | +6.8% |
| N17 (Tottenham) | -1.0% | -7.1% | +4.2% |
| N4 (Finsbury Park, Harringay) | +0.9% | -8.8% | +0.4% |
| N15 (South Tottenham, Seven Sisters) | +5.1% | -1.2% | 0.0% |
| N10 (Muswell Hill) | -9.0% | -8.5% | -10.4% |
| N6 (Highgate) | -2.2% | -7.4% | -11.0% |
N8 (Crouch End) leads with positive growth across all three time windows: +9.0% one-year, +13.1% three-year, +15.5% five-year. N22 (Wood Green) and N13 (Palmers Green) also show positive growth across all three periods. These mid-priced postcodes have benefited from relative affordability within the borough and from investment activity around the Wood Green regeneration zone.
N6 (Highgate) and N10 (Muswell Hill) are the only postcodes with negative growth across all three time windows. At £812,165 and £703,252 respectively, these are the borough's most expensive areas. Their decline suggests a ceiling effect where premium London prices have corrected while more affordable postcodes have held or grown. The contrast is sharp: N8 at £573,400 has grown 15.5% over five years while N6 at £812,165 has fallen 11.0% over the same period.
Monthly Property Sales in Haringey
An estimated 229 properties change hands in Haringey each month, but that volume is unevenly distributed. N4 (Finsbury Park, Harringay) accounts for 37 of those sales, more than triple the 11 per month in N6 (Highgate). Turnover rates give a picture of market liquidity: higher turnover generally means shorter void periods and faster re-letting when selling on.
| Area | Sales Per Month | Turnover | Asking Price |
|---|---|---|---|
| N4 (Finsbury Park, Harringay) | 37 | 10% | £625,977 |
| N8 (Crouch End, Hornsey) | 30 | 13% | £573,400 |
| N17 (Tottenham) | 29 | 9% | £437,618 |
| N15 (South Tottenham, Seven Sisters) | 23 | 13% | £481,607 |
| N14 (Southgate) | 18 | 9% | £688,866 |
| N11 (New Southgate, Bounds Green) | 18 | 10% | £522,337 |
| N10 (Muswell Hill) | 17 | 8% | £703,252 |
| N13 (Palmers Green) | 16 | 8% | £559,810 |
| N22 (Wood Green) | 16 | 7% | £522,116 |
| N19 (Archway, Upper Holloway) | 14 | 8% | £564,286 |
| N6 (Highgate) | 11 | 5% | £812,165 |
The three most liquid postcodes (N4, N8, N17) account for 96 of the borough's estimated 229 monthly sales. N8 and N15 share the highest turnover at 13%, meaning roughly 1 in 8 properties changes hands each year. N6 (Highgate) at 5% turnover is the least liquid postcode in the borough, consistent with its premium pricing and long-hold ownership profile.
N17 (Tottenham) combines 29 sales per month with the lowest asking price of £437,618. That pairing of high volume and low entry price means more stock on the market and a more active buy-to-let market. N6, by contrast, averages just 11 sales per month, and many of those are owner-occupied family homes rather than investment transactions.
Property Data Sources
Our location guide relies on diverse, authoritative datasets including:
- HM Land Registry UK House Price Index
- Ministry of Housing, Communities and Local Government
- Ordnance Survey Data Hub
- Propertydata.co.uk
We update our property data quarterly to ensure accuracy. Last update: April 2026. All data is presented as provided by our sources without adjustments or amendments.
Haringey Rental Market Analysis
For investors weighing up whether rental property is a worthwhile investment in Haringey, the data below breaks down average monthly rents and gross rental yields across the borough's postcodes.
All 11 Haringey postcodes return rental data, with monthly rents from £1,785 (N13) to £2,675 (N6) and gross yields from 3.2% to 5.7%. If you are looking to build a property portfolio in London, Haringey's combination of regeneration-backed rental demand and a 2.5 percentage point yield spread across postcodes gives investors a range of entry points within a single borough.
Average Rent & Gross Rental Yields in Haringey
N17 (Tottenham) tops the yield table at 5.7%, achieving £2,088 per month on an asking price of £437,618. The yield ranking broadly inverts the asking price ranking: the cheapest postcodes produce the highest yields, and the most expensive postcodes compress returns. The table below ranks all 11 postcodes by gross rental yield.
| Area | Monthly Rent | Asking Price | Gross Yield |
|---|---|---|---|
| N17 (Tottenham) | £2,088 | £437,618 | 5.7% |
| N15 (South Tottenham, Seven Sisters) | £1,920 | £481,607 | 4.8% |
| N4 (Finsbury Park, Harringay) | £2,433 | £625,977 | 4.7% |
| N19 (Archway, Upper Holloway) | £2,158 | £564,286 | 4.6% |
| N11 (New Southgate, Bounds Green) | £1,874 | £522,337 | 4.3% |
| N8 (Crouch End, Hornsey) | £2,053 | £573,400 | 4.3% |
| N22 (Wood Green) | £1,820 | £522,116 | 4.2% |
| N6 (Highgate) | £2,675 | £812,165 | 4.0% |
| N13 (Palmers Green) | £1,785 | £559,810 | 3.8% |
| N10 (Muswell Hill) | £2,070 | £703,252 | 3.5% |
| N14 (Southgate) | £1,844 | £688,866 | 3.2% |
The top four yielding postcodes (N17, N15, N4, N19) all sit above 4.5% gross yield. Three of these four are in the eastern corridor: N17 (Tottenham), N15 (South Tottenham), and N4 (Finsbury Park). N19 (Archway, Upper Holloway) on the Haringey/Islington border rounds out the group. These postcodes benefit from high rental demand driven by transport links and proximity to Central London.
N14 (Southgate) returns the lowest yield at 3.2% despite a rent of £1,844 per month. The yield is compressed by its high asking price of £688,866. N10 (Muswell Hill) at 3.5% and N13 (Palmers Green) at 3.8% face the same dynamic: rents that are lower than the borough mean but asking prices that are significantly higher. For yield-focused investors, the Tottenham corridor delivers 78% more yield (5.7% vs 3.2%) than the borough's most expensive residential areas.
Is Haringey Rent High?
Monthly rents in Haringey consume between 48.7% and 73.0% of the local median gross monthly income. That is a significant range. In N6 (Highgate), where rents average £2,675, a single earner on the Haringey median salary would need to allocate nearly three quarters of their gross monthly income to rent. In N13 (Palmers Green), the figure drops to just under half.
The median gross weekly salary in Haringey is £846.10, which equates to £3,666 per month or £43,995 per year. This is below the London regional median of £892.60 per week and above the Great Britain median of £752.40 per week. Data from the Nomis Labour Market Profile (ASHE 2025).
| Rank | Area | Rent as % of Income |
|---|---|---|
| 1 | N6 (Highgate) | 73.0% |
| 2 | N4 (Finsbury Park, Harringay) | 66.4% |
| 3 | N19 (Archway, Upper Holloway) | 58.9% |
| 4 | N17 (Tottenham) | 57.0% |
| 5 | N10 (Muswell Hill) | 56.5% |
| 6 | N8 (Crouch End, Hornsey) | 56.0% |
| 7 | N15 (South Tottenham, Seven Sisters) | 52.4% |
| 8 | N11 (New Southgate, Bounds Green) | 51.1% |
| 9 | N14 (Southgate) | 50.3% |
| 10 | N22 (Wood Green) | 49.6% |
| 11 | N13 (Palmers Green) | 48.7% |
Every Haringey postcode exceeds the commonly cited 30% rent-to-income threshold. Even N13 at 48.7% is well above it. This reflects the broader London rental market, where median salaries have not kept pace with rents. For landlords, the high rent-to-income ratios indicate strong rental demand pressure in every part of the borough. Tenants have limited alternatives within the same price bracket, which supports occupancy rates.
N6 (Highgate) and N4 (Finsbury Park) rank highest at 73.0% and 66.4%. These two postcodes have the borough's highest absolute rents (£2,675 and £2,433 respectively). At these levels, the typical tenant profile shifts toward dual-income households, sharers, or professionals earning above the borough median.
Thinking of Buying?
We have off-market investment properties averaging 8%+ annual yield.
View Property DealsBuy-to-Let Considerations
Are House Prices High? Price-to-Earnings Ratios
Purchasing a property in Haringey requires between 9.9 and 18.5 times the median annual salary. This is based on the Nomis Labour Market Profile for Haringey showing the median gross annual income for Haringey residents is £43,995.
For context, the England benchmark price-to-earnings ratio is 7.4x (England average sold price of £290,437 divided by the Great Britain median annual salary of £39,125). Every Haringey postcode exceeds this by a significant margin, which is characteristic of London boroughs.
| Rank | Area | Price-to-Earnings Ratio |
|---|---|---|
| 1 | N17 (Tottenham) | 9.9x |
| 2 | N15 (South Tottenham, Seven Sisters) | 10.9x |
| 3 | N11 (New Southgate, Bounds Green) | 11.9x |
| 4 | N22 (Wood Green) | 11.9x |
| 5 | N13 (Palmers Green) | 12.7x |
| 6 | N19 (Archway, Upper Holloway) | 12.8x |
| 7 | N8 (Crouch End, Hornsey) | 13.0x |
| 8 | N4 (Finsbury Park, Harringay) | 14.2x |
| 9 | N14 (Southgate) | 15.7x |
| 10 | N10 (Muswell Hill) | 16.0x |
| 11 | N6 (Highgate) | 18.5x |
N17 (Tottenham) at 9.9x is the most affordable postcode in the borough by this measure. It is 1.3 times the England benchmark of 7.4x. N6 (Highgate) at 18.5x is 2.5 times the national benchmark. The 8.6x gap between the cheapest and most expensive postcodes is wider than the entire P/E ratio of many regional buy-to-let locations.
N15 (South Tottenham) at 10.9x and N11 (New Southgate) at 11.9x offer the next most accessible entry points. All three of these postcodes (N17, N15, N11) also appear in the upper half of the yield table. The lower the P/E ratio, the less capital required per pound of rental income generated.
Deposit Requirements in Haringey
A 30% deposit on the cheapest Haringey postcode (N17, Tottenham) is £131,285. At the most expensive postcode (N6, Highgate), a 30% deposit requires £243,650. The difference of £112,365 between the lowest and highest deposit is a significant capital allocation decision. The table below ranks all postcodes from lowest to highest deposit requirement. Understanding the full costs of buy-to-let is essential before committing, and a stamp duty calculator can help model the total upfront investment.
| Rank | Area | 30% Deposit Required |
|---|---|---|
| 1 | N17 (Tottenham) | £131,285 |
| 2 | N15 (South Tottenham, Seven Sisters) | £144,482 |
| 3 | N22 (Wood Green) | £156,635 |
| 4 | N11 (New Southgate, Bounds Green) | £156,701 |
| 5 | N13 (Palmers Green) | £167,943 |
| 6 | N19 (Archway, Upper Holloway) | £169,286 |
| 7 | N8 (Crouch End, Hornsey) | £172,020 |
| 8 | N4 (Finsbury Park, Harringay) | £187,793 |
| 9 | N14 (Southgate) | £206,660 |
| 10 | N10 (Muswell Hill) | £210,976 |
| 11 | N6 (Highgate) | £243,650 |
The four postcodes with the lowest deposit requirements (N17, N15, N22, N11) all require less than £157,000. These same four postcodes also deliver yields between 4.2% and 5.7%. The additional £13,197 between N17 (£131,285) and N15 (£144,482) buys a postcode with 0.9 percentage points less yield but a higher turnover rate and marginally better one-year growth. Investors exploring alternative routes can read about no-deposit investment property options or search for repossessed houses for sale to reduce upfront capital.
N8 (Crouch End) at £172,020 sits in the middle tier and is the borough's strongest five-year growth postcode at +15.5%. The extra £40,735 over N17 funds a postcode that has outperformed every other Haringey area on capital appreciation.
What the Haringey Data Tells Buy-to-Let Investors
N17 (Tottenham) leads on yield at 5.7%, has the lowest asking price at £437,618, the lowest deposit at £131,285, and ranks third for sales volume at 29 per month. It sits at the centre of the £2 billion High Road West regeneration programme. N15 (South Tottenham) at 4.8% yield and £481,607 is the next step up, with the borough's joint-highest turnover at 13%. Both postcodes concentrate in the eastern corridor where the regeneration investment is heaviest.
N8 (Crouch End, Hornsey) delivers the borough's strongest capital growth story: +15.5% over five years, +13.1% over three years, and +9.0% over one year. It produces a 4.3% yield on a £573,400 asking price, combining growth and income in a postcode with 30 sales per month. N22 (Wood Green) at 4.2% yield and +11.9% five-year growth offers similar dual returns at a lower entry price of £522,116, positioned within the Haringey Heartlands opportunity area.
N6 (Highgate) and N10 (Muswell Hill) show negative five-year growth of -11.0% and -10.4% respectively, with yields of 4.0% and 3.5%. Both postcodes have the borough's lowest sales volumes (11 and 17 per month) and highest P/E ratios (18.5x and 16.0x). N14 (Southgate) at 3.2% yield and N13 (Palmers Green) at 3.8% also sit in the lower-yielding tier. The data across these four postcodes shows compressed income returns and, in N6 and N10, declining capital values.
Haringey operates a selective licensing scheme covering parts of the borough. Investors exploring investment properties in Haringey should factor in licensing requirements and associated costs when modelling net yields.
How Haringey Compares
Haringey's mean asking price of £590,130 places it in the middle of its North London neighbours. The comparison below shows how Haringey sits against four bordering boroughs on three key metrics: mean asking price (the simple average across all postcodes), mean monthly rent, and top single-postcode gross yield.
| Location | Mean Asking Price | Mean Monthly Rent | Top Gross Yield |
|---|---|---|---|
| Waltham Forest | £509,842 | £1,988 | 5.9% |
| Enfield | £527,549 | £1,881 | 6.2% |
| Haringey | £590,130 | £2,065 | 5.7% |
| Hackney | £660,489 | £2,573 | 5.3% |
| Barnet | £691,818 | £2,114 | 5.7% |
Enfield to the north offers the highest top yield of the group at 6.2% with a lower mean asking price of £527,549. Its rents are the lowest in the group at £1,881, which means the yield is driven by entry price rather than rental income. Waltham Forest to the east is the cheapest borough in this comparison at £509,842, with a 5.9% top yield and rents of £1,988.
Hackney commands £660,489 with the highest rents in the group at £2,573 per month, but its top yield of 5.3% trails Haringey's 5.7%. Barnet is the most expensive at £691,818 with a top yield matching Haringey at 5.7%, though its rents of £2,114 are only marginally above Haringey's £2,065.
Haringey sits at the intersection of these four neighbours: more expensive than Enfield and Waltham Forest but cheaper than Hackney and Barnet, with rents above Enfield and Waltham Forest but below Hackney. Investors looking across the best buy-to-let areas in North London have a range of entry points within a 15-minute radius.
Frequently Asked Questions
How does Haringey compare to other North London boroughs for buy-to-let?
Haringey sits in the middle of its North London neighbours on price and yield. Its mean asking price of £590,130 falls between Enfield (£527,549) and Hackney (£660,489). Its top yield of 5.7% in N17 (Tottenham) is lower than Enfield's 6.2% but higher than Hackney's 5.3%. Haringey's mean rent of £2,065 per month is higher than both Enfield (£1,881) and Waltham Forest (£1,988) but below Hackney (£2,573). The borough's distinctive feature is the regeneration investment concentrated in its eastern postcodes, which distinguishes it from neighbours where comparable investment programmes are smaller or absent.
What types of property are most common in Haringey?
Flats and terraced houses dominate Haringey's housing stock. The Land Registry average for flats in Haringey is £474,733, which accounts for the majority of transactions in postcodes like N17, N15 and N22. Terraced houses average £796,518 and are common across the borough. Semi-detached houses (£1,218,067) and detached houses (£2,351,015) are concentrated in the western postcodes of N6 (Highgate), N10 (Muswell Hill) and N14 (Southgate), where they are scarce and command substantial premiums over the England averages.
What transport links does Haringey have?
Three London Underground lines and 11 railway stations serve the borough. The tube lines cover seven stations: the Piccadilly line (Bounds Green, Turnpike Lane, Wood Green, and Manor House on the Haringey/Hackney border), the Victoria line (Seven Sisters, Tottenham Hale), and the Northern line (Highgate). The borough also has 11 railway stations served by National Rail and London Overground, including Tottenham Hale (a transport hub with Victoria line and Greater Anglia/Stansted Express services) and Alexandra Palace (Great Northern services). This connectivity is a significant driver of rental demand.
Are Haringey house prices rising or falling in 2026?
Borough-level prices are broadly flat, but postcode-level trends vary widely. The Land Registry average for Haringey in January 2026 is £637,041, with an annual change of -0.3%. The all-time high of £651,593 was recorded in September 2025. Over five years, the borough-level average has grown just 2.3% (from £622,431 in January 2021). At the postcode level, the picture is mixed: N8 (Crouch End) has grown 15.5% over five years and N22 (Wood Green) has grown 11.9%, while N6 (Highgate) has fallen 11.0% and N10 (Muswell Hill) has fallen 10.4% over the same period.
What regeneration projects are planned near Tottenham Hotspur Stadium?
High Road West is a £2 billion regeneration programme directly adjacent to the Stadium. It is delivered through a partnership between Lendlease and The Crown Estate. Plans include 2,600 new homes (40% affordable, including at least 500 at council rents). Phase A (61 homes) was approved in February 2026. The Stadium itself has generated an estimated £900 million in gross output and £478 million in GVA annually across Haringey, Enfield and Waltham Forest. Investors looking for off-market property in the area may find opportunities as the regeneration progresses.