

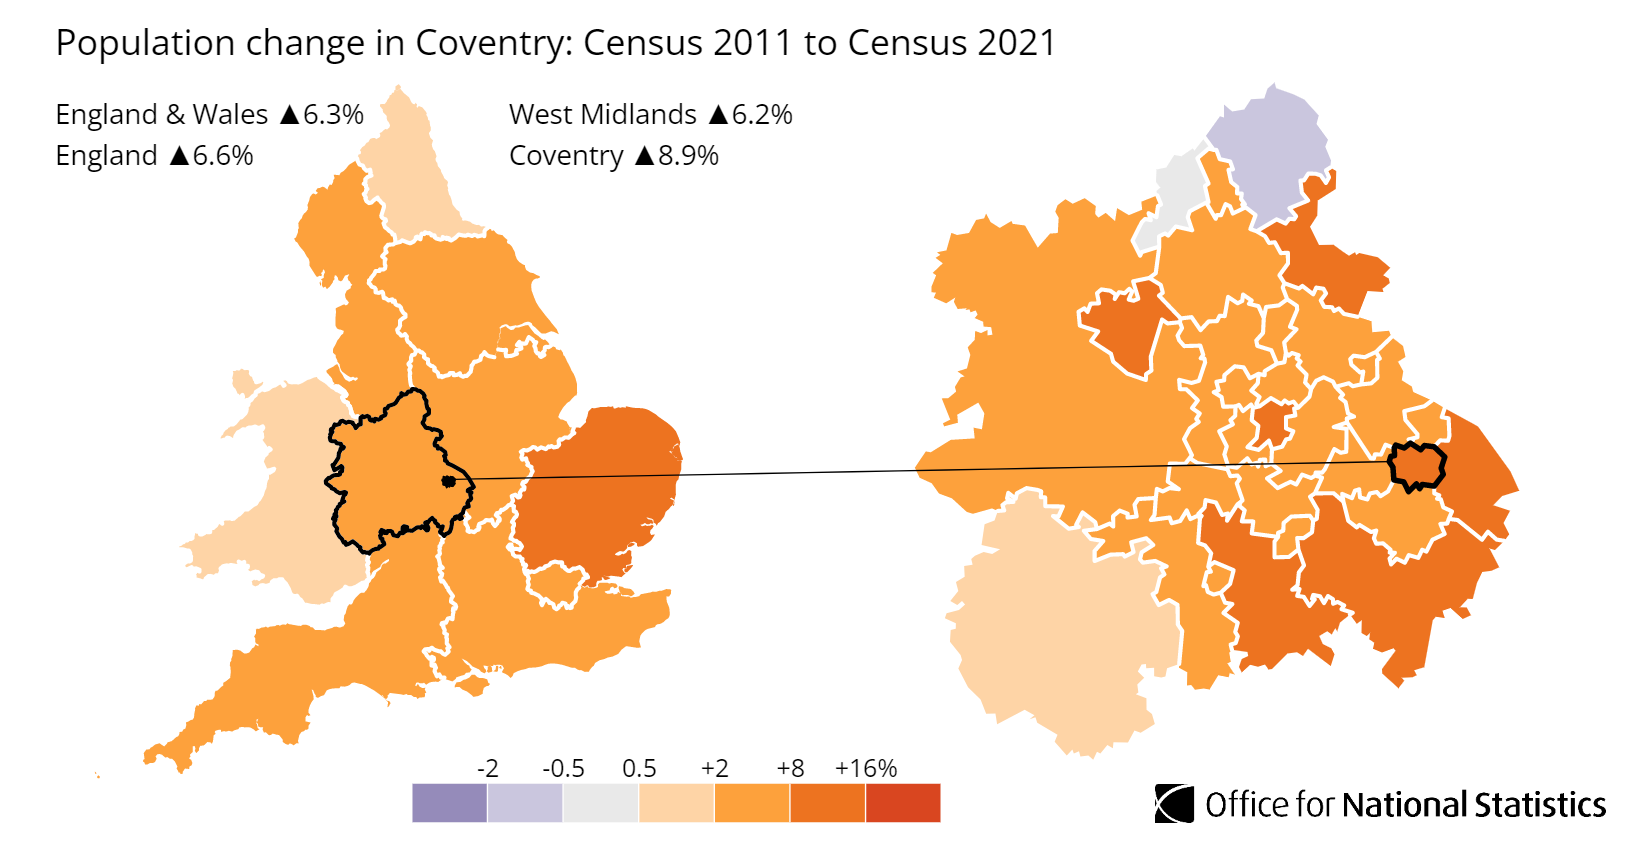
Coventry sits in the West Midlands, just east of Birmingham. The average sold price in Coventry is £219,765, which is 24.2% below the England average of £289,946 as of March 2026. That discount is the headline for any investor weighing up the city. Coventry buys you a major West Midlands centre, two universities and a city-wide regeneration programme at a price that sits well under the national average and 10.9% under the wider West Midlands regional average of £246,728. The local authority population grew 8.95% between the 2011 and 2021 censuses, from 316,960 to 345,325 residents.
What that low entry point unlocks is yield. CV1, the city-centre postcode, is the cheapest way in at a £163,893 average asking price and also carries the highest gross yield in the city at 6.9%. That pairing, where the cheapest postcode is the highest-yielding, is the opposite of how Coventry's premium outer postcodes behave, where CV8 at £437,918 returns just 3.1%. Across the eight postcodes covered here the city splits into a tight, high-yield core and an affluent commuter ring, and the data below shows where the line falls.
This guide covers the metropolitan district of Coventry (ONS code E08000026) across postcodes CV1, CV2, CV3, CV4, CV5, CV6, CV7 and CV8. Coventry sits in the West Midlands, around 19 miles east of Birmingham and bordered by Warwickshire on its outer edges. For the wider regional picture, see our location guides for the wider Midlands, including neighbouring Birmingham.
Article updated: July 2026
Why Invest in Coventry?
Coventry grew its population 8.95% between the 2011 and 2021 censuses, from 316,960 to 345,325 residents, faster than the England and Wales average of 6.3%. Two universities sit at the heart of that growth. The University of Warwick, ranked among the UK's leading institutions, and Coventry University between them draw tens of thousands of students into the city each year, and a large share of those rent privately. That student base, layered on top of a working population employed across manufacturing, logistics and higher education, gives the rental market two distinct sources of demand.
The local employment rate of 70.4% sits below both the West Midlands average and the Great Britain figure of 75.6%, and the unemployment rate of 9.2% is higher than the national picture. Coventry's economy carries the legacy of its motor-industry past alongside newer strengths in advanced manufacturing, gaming and battery technology, and the City of Culture year in 2021 left a programme of cultural investment behind it. For an investor, the read is a city with genuine tenant demand and below-average prices rather than one riding high wages.
The median gross annual salary in Coventry is £37,759, which is just below the Great Britain median of £39,125 and a touch above the wider West Midlands. Wages here do not stretch as far as in the affluent commuter towns on the city's edge, and that keeps owner-occupier demand in check while supporting a deep, established private rented sector in the central postcodes.
Coventry Economic Summary
- Population: 345,325 (2021 Census). Growth of 8.95% from 2011.
- Median annual salary: £37,759 (local), £39,125 (Great Britain)
- Employment rate: 70.4% (local), 75.6% (Great Britain)
- Unemployment rate: 9.2% (local)
- Key employment sectors: Advanced manufacturing, logistics and distribution, higher education, health and social work, retail
Source: ONS Explore Local Statistics, Nomis Labour Market Profile (ASHE 2025).
Regeneration and Investment in Coventry
Coventry is in the middle of the largest city-centre rebuild it has seen in decades, led by the £450 million City Centre South scheme. Public money is going in alongside private development, and the work below is funded and under way rather than at the concept stage.
- City Centre South (Under construction, £450 million): Developer The Hill Group, in partnership with Shearer Property Group, began demolition in June 2025 on a 15-acre site covering Bull Yard, Shelton Square and City Arcade, with up to 1,575 new homes planned and 991 in Phase 1, of which 200 are affordable. The West Midlands Combined Authority has committed £110 million to the scheme, and the first homes are targeted for late 2027, adding a substantial residential population to the heart of the city. Updates at West Midlands Combined Authority.
- Coventry Station Masterplan (Completed, £82 million): The £82 million redevelopment of Coventry railway station delivered a second entrance building, a new footbridge linking all four platforms with step-free access, and a 633-space multi-storey car park, funded by the West Midlands Combined Authority and the Coventry and Warwickshire Local Enterprise Partnership Growth Deal. The station sits a short walk from the city centre and puts Birmingham around 20 minutes away by train, strengthening Coventry's pull for commuting tenants. Updates at Coventry City Council.
- Coventry Very Light Rail (In trial): Coventry City Council opened a city-centre test track for its battery-powered Very Light Rail system in May 2025, backed by £2.4 million of UK Government funding and £12.2 million from the West Midlands devolution deal, with an 800-metre demonstrator route between the railway station and the university technology park targeted for completion by 2027. The system is designed to give the city a low-cost tram alternative without overhead wires. Updates at Coventry City Council.
Coventry Property Market Analysis
Average property prices in Coventry have risen 471.5% since January 1995, from £38,455 to £219,765. The sections below trace that path through the cycles, then drill down into postcode-level sold prices, price per square foot, asking prices, growth, and how active each part of the market is.
When was the last house price crash in Coventry?
Coventry is a metropolitan district, so all sold property prices from HM Land Registry are recorded at the city level. The Land Registry House Price Index tracks average prices from January 1995 to March 2026, covering 31 years of market cycles.
The 1995 to 2007 climb: Coventry started at £38,455 in January 1995. By December 2000 the average had reached £56,983, and the early-2000s boom then took it sharply higher, passing £124,617 by December 2005. The market peaked at £136,968 in August 2007 before the financial crisis turned it.
2008 to 2009, the financial crisis: Prices fell from the August 2007 peak of £136,968 to a trough of £109,809 in February 2009. That is a decline of 19.8% over 18 months, with the worst year-on-year reading of -18.3% recorded in February 2009. Coventry's correction was steeper than many southern markets, in line with the West Midlands pattern, where the lower-priced industrial cities took a sharper hit than the commuter belt.
2010 to 2013, the flat years: Prices bounced off the early-2009 trough but then went sideways for several years. The average sat at £121,878 in December 2010, slipped to £118,104 by December 2011, and was still only £127,881 by December 2013. Coventry spent the best part of four years below its pre-crash peak, unable to push higher while wider lending stayed tight.
Recovery, 2014 onwards: The market finally cleared its August 2007 peak in November 2014, when the average reached £137,105. That recovery took seven years and three months. Growth then built steadily, with the average reaching £148,008 by December 2015 and £172,301 by December 2017.
2018 to 2019, the slowdown: Growth flattened ahead of the pandemic, and the average drifted to £179,851 by December 2019, recording a small -0.6% annual reading as the market paused.
2020 to 2022, the pandemic surge: The stamp duty holiday and a shift in buyer demand reignited the market. Prices rose from £182,883 in June 2020 to £188,103 by December 2020 (4.6% annual growth), £201,232 by December 2021 (7.0% annual), and £219,996 by December 2022 (9.3% annual).
The 2023 rate shock: Higher mortgage rates pulled the market back. The average eased to £211,044 by June 2023 and £211,971 by December 2023, a -3.6% annual reading, before steadying.
2024 to present: Prices recovered to £219,262 by December 2024 (3.4% annual growth) and reached an all-time high of £224,217 in December 2025. Since then the market has eased gently to £219,765 by March 2026, a -0.4% annual reading. The current price is 60.4% above the pre-crash peak of £136,968.
Long-term growth summary:
- 5 years (March 2021 to March 2026): 13.6% growth (£193,401 to £219,765)
- 10 years (March 2016 to March 2026): 49.9% growth (£146,562 to £219,765)
- 15 years (March 2011 to March 2026): 85.5% growth (£118,474 to £219,765)
- 20 years (March 2006 to March 2026): 77.0% growth (£124,142 to £219,765)
- 30 years (January 1995 to March 2026): 471.5% growth (£38,455 to £219,765)
Coventry's 19.8% crash was deeper than the national average, and the seven-year wait to clear the old peak was longer than England's. But the 30-year return of 471.5% is strong, and the recent pattern, an all-time high in December 2025 followed by a gentle easing into early 2026, points to a market that has done its growing rather than one mid-correction. An investor who bought at the August 2007 peak would now be sitting on a 60.4% gain on the Land Registry average.
- All property types
- Detached
- Semi-detached
- Terraced
- Flats
Source: HM Land Registry House Price Index
| Year | All property types | Detached | Semi-detached | Terraced | Flats |
|---|---|---|---|---|---|
| 1995-01 | £38,455 | £72,749 | £44,120 | £34,308 | £27,748 |
| 1995-02 | £39,165 | £73,480 | £45,124 | £34,945 | £28,115 |
| 1995-03 | £39,264 | £73,464 | £45,186 | £35,072 | £28,157 |
| 1995-04 | £39,699 | £73,941 | £45,708 | £35,481 | £28,465 |
| 1995-05 | £39,796 | £73,967 | £45,789 | £35,586 | £28,568 |
| 1995-06 | £39,990 | £74,352 | £46,110 | £35,708 | £28,822 |
| 1995-07 | £39,995 | £74,586 | £46,142 | £35,709 | £28,656 |
| 1995-08 | £40,264 | £75,609 | £46,428 | £35,938 | £28,684 |
| 1995-09 | £39,831 | £74,925 | £45,876 | £35,584 | £28,196 |
| 1995-10 | £39,865 | £75,244 | £46,078 | £35,521 | £28,336 |
| 1995-11 | £39,057 | £73,796 | £45,246 | £34,730 | £27,978 |
| 1995-12 | £39,529 | £74,754 | £45,906 | £35,098 | £28,370 |
| 1996-01 | £37,448 | £71,015 | £43,434 | £33,271 | £26,754 |
| 1996-02 | £37,508 | £71,105 | £43,539 | £33,336 | £26,654 |
| 1996-03 | £36,932 | £70,275 | £42,971 | £32,786 | £26,134 |
| 1996-04 | £38,331 | £72,579 | £44,546 | £34,071 | £27,169 |
| 1996-05 | £38,742 | £72,980 | £44,908 | £34,516 | £27,419 |
| 1996-06 | £39,621 | £74,350 | £45,781 | £35,346 | £28,216 |
| 1996-07 | £40,731 | £76,656 | £47,103 | £36,322 | £28,892 |
| 1996-08 | £40,971 | £77,678 | £47,416 | £36,498 | £28,907 |
| 1996-09 | £40,746 | £77,653 | £47,124 | £36,308 | £28,519 |
| 1996-10 | £40,696 | £77,718 | £47,132 | £36,237 | £28,421 |
| 1996-11 | £40,591 | £77,304 | £47,032 | £36,144 | £28,413 |
| 1996-12 | £40,610 | £77,026 | £47,161 | £36,164 | £28,352 |
| 1997-01 | £39,976 | £75,726 | £46,375 | £35,636 | £27,835 |
| 1997-02 | £39,992 | £76,091 | £46,446 | £35,606 | £27,833 |
| 1997-03 | £40,283 | £76,850 | £46,700 | £35,875 | £28,067 |
| 1997-04 | £41,072 | £78,143 | £47,662 | £36,581 | £28,608 |
| 1997-05 | £41,653 | £78,888 | £48,347 | £37,153 | £28,848 |
| 1997-06 | £41,941 | £79,520 | £48,736 | £37,404 | £28,907 |
| 1997-07 | £41,850 | £79,471 | £48,587 | £37,352 | £28,668 |
| 1997-08 | £42,354 | £80,755 | £49,173 | £37,783 | £28,928 |
| 1997-09 | £42,891 | £81,901 | £49,822 | £38,248 | £29,261 |
| 1997-10 | £43,328 | £82,961 | £50,417 | £38,581 | £29,603 |
| 1997-11 | £42,736 | £81,977 | £49,787 | £38,015 | £29,236 |
| 1997-12 | £42,421 | £81,395 | £49,531 | £37,700 | £28,985 |
| 1998-01 | £42,090 | £81,099 | £49,066 | £37,410 | £28,705 |
| 1998-02 | £42,831 | £82,435 | £49,869 | £38,054 | £29,359 |
| 1998-03 | £42,386 | £81,606 | £49,288 | £37,665 | £29,050 |
| 1998-04 | £43,308 | £82,995 | £50,476 | £38,480 | £29,652 |
| 1998-05 | £44,006 | £83,989 | £51,265 | £39,177 | £29,910 |
| 1998-06 | £45,275 | £86,278 | £52,706 | £40,319 | £30,820 |
| 1998-07 | £45,798 | £87,375 | £53,263 | £40,790 | £31,203 |
| 1998-08 | £45,669 | £87,709 | £53,087 | £40,638 | £31,133 |
| 1998-09 | £45,562 | £87,830 | £52,990 | £40,536 | £30,925 |
| 1998-10 | £45,605 | £88,176 | £53,041 | £40,541 | £31,024 |
| 1998-11 | £45,550 | £88,349 | £53,176 | £40,388 | £31,081 |
| 1998-12 | £45,631 | £88,281 | £53,337 | £40,412 | £31,349 |
| 1999-01 | £45,764 | £88,607 | £53,554 | £40,488 | £31,524 |
| 1999-02 | £45,782 | £88,467 | £53,529 | £40,540 | £31,487 |
| 1999-03 | £46,267 | £89,600 | £54,068 | £40,967 | £31,823 |
| 1999-04 | £46,403 | £89,312 | £54,118 | £41,177 | £31,849 |
| 1999-05 | £47,282 | £90,542 | £55,059 | £42,018 | £32,469 |
| 1999-06 | £48,054 | £91,876 | £55,876 | £42,758 | £32,909 |
| 1999-07 | £48,784 | £93,613 | £56,697 | £43,411 | £33,295 |
| 1999-08 | £49,006 | £94,368 | £56,866 | £43,627 | £33,358 |
| 1999-09 | £49,186 | £95,081 | £57,006 | £43,778 | £33,496 |
| 1999-10 | £49,585 | £96,080 | £57,623 | £44,031 | £33,958 |
| 1999-11 | £50,421 | £97,737 | £58,675 | £44,722 | £34,663 |
| 1999-12 | £50,925 | £98,285 | £59,292 | £45,165 | £35,162 |
| 2000-01 | £50,687 | £98,105 | £59,034 | £44,944 | £34,904 |
| 2000-02 | £50,530 | £98,014 | £58,847 | £44,800 | £34,711 |
| 2000-03 | £50,643 | £98,552 | £59,098 | £44,881 | £34,526 |
| 2000-04 | £52,178 | £100,963 | £60,774 | £46,288 | £35,711 |
| 2000-05 | £53,219 | £102,711 | £62,032 | £47,189 | £36,558 |
| 2000-06 | £54,757 | £105,473 | £63,823 | £48,516 | £37,862 |
| 2000-07 | £55,239 | £107,219 | £64,548 | £48,869 | £38,031 |
| 2000-08 | £56,544 | £110,503 | £66,211 | £49,915 | £38,994 |
| 2000-09 | £56,933 | £112,243 | £66,656 | £50,193 | £39,250 |
| 2000-10 | £57,207 | £113,019 | £67,124 | £50,352 | £39,545 |
| 2000-11 | £56,611 | £112,145 | £66,425 | £49,789 | £39,216 |
| 2000-12 | £56,983 | £112,557 | £66,980 | £50,071 | £39,638 |
| 2001-01 | £57,435 | £113,318 | £67,325 | £50,532 | £39,950 |
| 2001-02 | £58,488 | £115,052 | £68,499 | £51,530 | £40,540 |
| 2001-03 | £58,953 | £115,975 | £69,030 | £51,995 | £40,613 |
| 2001-04 | £60,769 | £119,237 | £71,004 | £53,652 | £41,910 |
| 2001-05 | £61,634 | £120,217 | £71,939 | £54,477 | £42,563 |
| 2001-06 | £62,982 | £122,372 | £73,321 | £55,691 | £43,809 |
| 2001-07 | £62,945 | £122,412 | £73,356 | £55,631 | £43,774 |
| 2001-08 | £63,669 | £124,528 | £74,085 | £56,233 | £44,371 |
| 2001-09 | £63,842 | £125,645 | £74,222 | £56,357 | £44,448 |
| 2001-10 | £64,172 | £126,369 | £74,669 | £56,597 | £44,814 |
| 2001-11 | £64,816 | £127,558 | £75,628 | £57,098 | £45,330 |
| 2001-12 | £65,456 | £128,224 | £76,545 | £57,576 | £46,169 |
| 2002-01 | £66,286 | £129,973 | £77,538 | £58,254 | £46,935 |
| 2002-02 | £66,213 | £129,893 | £77,263 | £58,227 | £46,942 |
| 2002-03 | £67,012 | £131,398 | £78,142 | £58,999 | £47,266 |
| 2002-04 | £69,035 | £134,601 | £80,297 | £60,840 | £48,944 |
| 2002-05 | £71,561 | £138,633 | £83,340 | £63,072 | £50,871 |
| 2002-06 | £73,587 | £142,190 | £85,396 | £64,934 | £52,495 |
| 2002-07 | £74,973 | £144,884 | £86,959 | £66,210 | £53,278 |
| 2002-08 | £76,608 | £148,148 | £88,769 | £67,671 | £54,432 |
| 2002-09 | £78,400 | £151,856 | £91,171 | £69,190 | £55,484 |
| 2002-10 | £79,328 | £153,664 | £92,561 | £69,912 | £56,186 |
| 2002-11 | £80,983 | £157,021 | £94,477 | £71,343 | £57,457 |
| 2002-12 | £82,012 | £158,317 | £95,772 | £72,217 | £58,467 |
| 2003-01 | £84,408 | £162,316 | £98,203 | £74,455 | £60,273 |
| 2003-02 | £85,651 | £163,781 | £99,749 | £75,562 | £61,304 |
| 2003-03 | £87,663 | £167,715 | £101,797 | £77,428 | £62,676 |
| 2003-04 | £88,374 | £168,544 | £102,828 | £78,010 | £63,311 |
| 2003-05 | £89,264 | £170,070 | £103,819 | £78,869 | £63,714 |
| 2003-06 | £90,146 | £170,899 | £104,894 | £79,635 | £64,649 |
| 2003-07 | £92,198 | £174,169 | £107,246 | £81,546 | £65,907 |
| 2003-08 | £94,580 | £177,849 | £109,876 | £83,724 | £67,762 |
| 2003-09 | £96,338 | £180,721 | £111,864 | £85,420 | £68,563 |
| 2003-10 | £97,922 | £183,137 | £113,500 | £86,908 | £69,763 |
| 2003-11 | £98,591 | £184,036 | £114,289 | £87,548 | £70,127 |
| 2003-12 | £100,316 | £185,429 | £116,025 | £89,202 | £71,809 |
| 2004-01 | £101,476 | £187,519 | £117,240 | £90,259 | £72,711 |
| 2004-02 | £103,000 | £189,651 | £118,747 | £91,724 | £73,881 |
| 2004-03 | £104,169 | £192,027 | £119,867 | £92,870 | £74,478 |
| 2004-04 | £105,471 | £191,840 | £121,123 | £94,334 | £75,303 |
| 2004-05 | £107,651 | £193,219 | £123,191 | £96,559 | £77,113 |
| 2004-06 | £111,118 | £197,639 | £126,999 | £99,750 | £80,005 |
| 2004-07 | £113,979 | £202,179 | £130,352 | £102,347 | £82,009 |
| 2004-08 | £116,284 | £206,664 | £133,069 | £104,418 | £83,453 |
| 2004-09 | £117,498 | £209,329 | £134,526 | £105,554 | £83,926 |
| 2004-10 | £119,067 | £212,236 | £136,043 | £106,956 | £85,386 |
| 2004-11 | £118,550 | £210,991 | £135,265 | £106,493 | £85,337 |
| 2004-12 | £118,610 | £209,827 | £134,943 | £106,655 | £85,844 |
| 2005-01 | £116,734 | £206,541 | £132,501 | £105,022 | £84,664 |
| 2005-02 | £117,809 | £208,335 | £133,868 | £105,975 | £85,368 |
| 2005-03 | £117,820 | £208,782 | £134,097 | £105,999 | £84,957 |
| 2005-04 | £119,140 | £209,951 | £135,815 | £107,317 | £85,538 |
| 2005-05 | £120,521 | £211,999 | £137,102 | £108,671 | £86,554 |
| 2005-06 | £119,638 | £208,670 | £135,800 | £108,066 | £86,020 |
| 2005-07 | £120,452 | £209,948 | £136,665 | £108,817 | £86,645 |
| 2005-08 | £121,124 | £210,961 | £137,255 | £109,532 | £86,995 |
| 2005-09 | £122,998 | £215,014 | £139,353 | £111,245 | £88,124 |
| 2005-10 | £123,996 | £216,626 | £140,164 | £112,232 | £88,926 |
| 2005-11 | £123,685 | £215,602 | £139,894 | £111,998 | £88,575 |
| 2005-12 | £124,617 | £215,925 | £140,605 | £112,856 | £89,866 |
| 2006-01 | £123,897 | £214,515 | £139,578 | £112,314 | £89,248 |
| 2006-02 | £123,391 | £212,746 | £138,706 | £111,891 | £89,258 |
| 2006-03 | £124,142 | £214,785 | £139,846 | £112,652 | £89,085 |
| 2006-04 | £124,658 | £214,546 | £140,537 | £113,167 | £89,491 |
| 2006-05 | £127,962 | £220,140 | £144,433 | £116,186 | £91,673 |
| 2006-06 | £128,031 | £219,069 | £144,378 | £116,336 | £91,884 |
| 2006-07 | £131,106 | £224,415 | £147,655 | £119,263 | £93,869 |
| 2006-08 | £131,050 | £224,535 | £147,453 | £119,464 | £93,195 |
| 2006-09 | £132,275 | £227,592 | £148,887 | £120,526 | £93,941 |
| 2006-10 | £130,843 | £225,469 | £147,309 | £119,191 | £92,895 |
| 2006-11 | £130,911 | £225,488 | £147,481 | £119,218 | £92,980 |
| 2006-12 | £132,012 | £226,082 | £148,463 | £120,382 | £93,855 |
| 2007-01 | £132,768 | £227,484 | £149,303 | £121,107 | £94,278 |
| 2007-02 | £132,321 | £226,557 | £148,615 | £120,555 | £94,489 |
| 2007-03 | £131,362 | £225,404 | £147,532 | £119,772 | £93,435 |
| 2007-04 | £131,830 | £225,046 | £147,852 | £120,365 | £93,766 |
| 2007-05 | £133,519 | £226,910 | £149,575 | £122,137 | £94,759 |
| 2007-06 | £135,153 | £229,202 | £151,240 | £123,638 | £96,133 |
| 2007-07 | £136,332 | £232,067 | £152,543 | £124,655 | £96,958 |
| 2007-08 | £136,968 | £234,196 | £153,348 | £125,366 | £96,819 |
| 2007-09 | £136,254 | £234,038 | £152,740 | £124,688 | £96,004 |
| 2007-10 | £135,826 | £233,753 | £152,161 | £124,268 | £95,760 |
| 2007-11 | £135,818 | £234,336 | £152,345 | £124,098 | £95,871 |
| 2007-12 | £136,763 | £235,618 | £153,326 | £124,880 | £96,864 |
| 2008-01 | £136,528 | £235,619 | £153,056 | £124,566 | £96,859 |
| 2008-02 | £134,472 | £232,271 | £150,622 | £122,619 | £95,644 |
| 2008-03 | £131,301 | £227,590 | £147,335 | £119,825 | £92,771 |
| 2008-04 | £130,909 | £227,327 | £146,962 | £119,644 | £91,913 |
| 2008-05 | £131,710 | £228,170 | £147,919 | £120,439 | £92,374 |
| 2008-06 | £132,783 | £229,490 | £148,975 | £121,435 | £93,310 |
| 2008-07 | £131,451 | £227,030 | £147,834 | £120,117 | £92,390 |
| 2008-08 | £127,186 | £220,194 | £142,957 | £116,244 | £89,285 |
| 2008-09 | £123,952 | £216,867 | £139,255 | £113,141 | £86,996 |
| 2008-10 | £122,482 | £215,063 | £137,480 | £111,732 | £86,081 |
| 2008-11 | £120,583 | £212,296 | £135,608 | £109,890 | £84,717 |
| 2008-12 | £116,013 | £203,016 | £130,614 | £105,841 | £81,339 |
| 2009-01 | £111,631 | £195,961 | £125,671 | £101,726 | £78,458 |
| 2009-02 | £109,809 | £193,123 | £123,672 | £99,928 | £77,395 |
| 2009-03 | £112,214 | £197,835 | £126,332 | £101,922 | £79,634 |
| 2009-04 | £113,281 | £198,519 | £127,708 | £102,969 | £80,242 |
| 2009-05 | £115,202 | £200,992 | £129,768 | £104,887 | £81,405 |
| 2009-06 | £115,071 | £200,309 | £129,659 | £104,939 | £80,760 |
| 2009-07 | £116,199 | £202,328 | £130,907 | £106,104 | £81,053 |
| 2009-08 | £119,015 | £207,779 | £134,051 | £108,818 | £82,337 |
| 2009-09 | £119,884 | £209,767 | £135,163 | £109,625 | £82,535 |
| 2009-10 | £120,981 | £212,206 | £136,658 | £110,594 | £82,875 |
| 2009-11 | £119,634 | £209,949 | £135,072 | £109,470 | £81,612 |
| 2009-12 | £120,798 | £210,500 | £136,342 | £110,742 | £82,210 |
| 2010-01 | £121,653 | £212,751 | £137,393 | £111,628 | £82,057 |
| 2010-02 | £120,943 | £212,150 | £137,094 | £110,819 | £81,180 |
| 2010-03 | £121,463 | £215,330 | £137,889 | £111,028 | £81,388 |
| 2010-04 | £122,464 | £216,439 | £139,085 | £111,873 | £82,393 |
| 2010-05 | £123,065 | £217,284 | £139,668 | £112,416 | £83,013 |
| 2010-06 | £122,940 | £216,459 | £139,573 | £112,502 | £82,410 |
| 2010-07 | £122,026 | £215,785 | £138,557 | £111,705 | £81,373 |
| 2010-08 | £122,774 | £217,748 | £139,717 | £112,346 | £81,405 |
| 2010-09 | £123,265 | £220,005 | £140,353 | £112,666 | £81,630 |
| 2010-10 | £123,703 | £221,119 | £140,935 | £112,982 | £81,981 |
| 2010-11 | £123,195 | £220,949 | £140,294 | £112,423 | £81,813 |
| 2010-12 | £121,878 | £218,204 | £138,992 | £111,132 | £81,065 |
| 2011-01 | £119,743 | £215,138 | £136,559 | £109,063 | £79,814 |
| 2011-02 | £119,563 | £215,484 | £136,191 | £108,872 | £79,803 |
| 2011-03 | £118,474 | £215,279 | £134,904 | £107,748 | £79,040 |
| 2011-04 | £118,728 | £215,743 | £135,129 | £108,016 | £79,181 |
| 2011-05 | £119,244 | £215,851 | £135,799 | £108,467 | £79,733 |
| 2011-06 | £119,685 | £214,754 | £136,412 | £108,969 | £80,163 |
| 2011-07 | £119,879 | £214,264 | £136,595 | £109,203 | £80,436 |
| 2011-08 | £119,902 | £214,499 | £136,865 | £109,308 | £79,789 |
| 2011-09 | £120,333 | £216,133 | £137,305 | £109,753 | £79,707 |
| 2011-10 | £119,241 | £214,984 | £136,434 | £108,626 | £78,624 |
| 2011-11 | £119,258 | £215,211 | £136,435 | £108,478 | £79,111 |
| 2011-12 | £118,104 | £212,730 | £135,334 | £107,307 | £78,556 |
| 2012-01 | £117,987 | £211,789 | £135,252 | £107,251 | £78,482 |
| 2012-02 | £117,696 | £210,867 | £134,846 | £107,203 | £77,833 |
| 2012-03 | £118,109 | £210,638 | £135,173 | £107,734 | £78,137 |
| 2012-04 | £119,235 | £212,580 | £136,270 | £108,780 | £79,099 |
| 2012-05 | £118,919 | £211,609 | £135,847 | £108,498 | £79,084 |
| 2012-06 | £119,573 | £212,539 | £136,351 | £109,324 | £79,217 |
| 2012-07 | £120,526 | £213,596 | £137,249 | £110,451 | £79,516 |
| 2012-08 | £121,457 | £214,832 | £138,243 | £111,545 | £79,612 |
| 2012-09 | £122,339 | £217,237 | £139,246 | £112,297 | £80,096 |
| 2012-10 | £122,085 | £217,145 | £139,167 | £111,889 | £80,067 |
| 2012-11 | £120,927 | £215,668 | £137,893 | £110,682 | £79,506 |
| 2012-12 | £121,191 | £216,596 | £138,429 | £110,802 | £79,590 |
| 2013-01 | £120,658 | £215,875 | £138,148 | £110,271 | £78,869 |
| 2013-02 | £121,144 | £216,827 | £138,830 | £110,696 | £79,040 |
| 2013-03 | £121,022 | £217,153 | £138,823 | £110,457 | £78,950 |
| 2013-04 | £124,191 | £223,017 | £142,227 | £113,415 | £81,047 |
| 2013-05 | £124,589 | £223,435 | £142,743 | £113,748 | £81,429 |
| 2013-06 | £125,278 | £223,366 | £143,497 | £114,583 | £81,824 |
| 2013-07 | £124,359 | £220,973 | £142,236 | £113,915 | £81,265 |
| 2013-08 | £126,678 | £224,955 | £144,877 | £116,136 | £82,564 |
| 2013-09 | £128,534 | £229,511 | £147,022 | £117,704 | £83,659 |
| 2013-10 | £129,100 | £231,815 | £148,000 | £117,985 | £83,817 |
| 2013-11 | £129,090 | £232,444 | £148,147 | £117,837 | £83,771 |
| 2013-12 | £127,881 | £229,419 | £146,953 | £116,705 | £83,153 |
| 2014-01 | £127,720 | £228,760 | £146,713 | £116,559 | £83,251 |
| 2014-02 | £126,599 | £227,099 | £145,435 | £115,507 | £82,491 |
| 2014-03 | £128,168 | £230,120 | £147,296 | £116,893 | £83,484 |
| 2014-04 | £129,175 | £231,552 | £148,441 | £117,904 | £84,021 |
| 2014-05 | £131,052 | £234,036 | £150,512 | £119,715 | £85,345 |
| 2014-06 | £131,514 | £234,603 | £150,996 | £120,264 | £85,433 |
| 2014-07 | £132,913 | £236,824 | £152,591 | £121,609 | £86,262 |
| 2014-08 | £134,484 | £239,704 | £154,429 | £123,142 | £86,957 |
| 2014-09 | £136,200 | £242,731 | £156,249 | £124,749 | £88,140 |
| 2014-10 | £136,636 | £243,951 | £156,903 | £125,018 | £88,473 |
| 2014-11 | £137,105 | £245,245 | £157,554 | £125,303 | £88,905 |
| 2014-12 | £138,006 | £247,595 | £158,716 | £125,938 | £89,629 |
| 2015-01 | £137,498 | £246,996 | £158,262 | £125,362 | £89,369 |
| 2015-02 | £136,671 | £245,802 | £157,294 | £124,409 | £89,331 |
| 2015-03 | £135,838 | £245,023 | £156,652 | £123,438 | £88,820 |
| 2015-04 | £137,115 | £247,530 | £157,992 | £124,689 | £89,472 |
| 2015-05 | £139,645 | £251,580 | £161,032 | £127,077 | £90,886 |
| 2015-06 | £140,492 | £252,073 | £161,837 | £128,202 | £90,932 |
| 2015-07 | £141,705 | £253,501 | £163,371 | £129,335 | £91,735 |
| 2015-08 | £143,008 | £255,959 | £164,777 | £130,648 | £92,276 |
| 2015-09 | £144,340 | £259,614 | £166,242 | £131,705 | £93,265 |
| 2015-10 | £146,456 | £264,253 | £168,673 | £133,639 | £94,344 |
| 2015-11 | £146,687 | £265,199 | £169,112 | £133,760 | £94,378 |
| 2015-12 | £148,008 | £267,674 | £170,918 | £134,912 | £95,032 |
| 2016-01 | £146,114 | £263,942 | £169,047 | £133,048 | £93,955 |
| 2016-02 | £146,210 | £264,091 | £169,284 | £133,081 | £94,041 |
| 2016-03 | £146,562 | £264,217 | £169,491 | £133,365 | £94,780 |
| 2016-04 | £149,757 | £270,110 | £173,046 | £136,420 | £96,532 |
| 2016-05 | £152,847 | £275,086 | £176,307 | £139,341 | £98,767 |
| 2016-06 | £156,396 | £281,546 | £180,450 | £142,655 | £100,741 |
| 2016-07 | £158,111 | £284,354 | £182,252 | £144,242 | £102,080 |
| 2016-08 | £158,380 | £285,117 | £182,534 | £144,499 | £102,156 |
| 2016-09 | £157,972 | £284,475 | £182,218 | £144,064 | £101,867 |
| 2016-10 | £157,770 | £285,552 | £182,316 | £143,491 | £102,030 |
| 2016-11 | £157,855 | £287,699 | £182,805 | £143,172 | £102,145 |
| 2016-12 | £157,844 | £288,534 | £182,734 | £142,997 | £102,408 |
| 2017-01 | £159,037 | £291,225 | £183,948 | £144,120 | £103,081 |
| 2017-02 | £158,497 | £289,490 | £182,979 | £143,689 | £103,183 |
| 2017-03 | £158,906 | £290,694 | £183,562 | £143,884 | £103,677 |
| 2017-04 | £158,741 | £289,792 | £183,215 | £143,719 | £103,980 |
| 2017-05 | £163,189 | £297,126 | £188,666 | £147,642 | £107,082 |
| 2017-06 | £166,765 | £301,883 | £192,603 | £151,091 | £109,589 |
| 2017-07 | £169,193 | £305,319 | £195,519 | £153,330 | £111,242 |
| 2017-08 | £169,704 | £305,937 | £195,841 | £154,037 | £111,273 |
| 2017-09 | £171,339 | £309,985 | £197,824 | £155,450 | £112,094 |
| 2017-10 | £171,871 | £312,262 | £198,852 | £155,768 | £112,039 |
| 2017-11 | £173,120 | £315,212 | £200,724 | £156,761 | £112,554 |
| 2017-12 | £172,301 | £313,272 | £199,992 | £156,066 | £111,785 |
| 2018-01 | £175,249 | £318,590 | £203,476 | £158,726 | £113,667 |
| 2018-02 | £174,809 | £318,801 | £202,978 | £158,279 | £113,221 |
| 2018-03 | £175,948 | £321,590 | £204,381 | £159,340 | £113,617 |
| 2018-04 | £174,925 | £319,485 | £203,170 | £158,719 | £112,240 |
| 2018-05 | £174,869 | £318,807 | £203,235 | £158,862 | £111,702 |
| 2018-06 | £177,239 | £322,837 | £206,281 | £160,940 | £113,162 |
| 2018-07 | £177,600 | £323,977 | £206,671 | £161,197 | £113,474 |
| 2018-08 | £180,385 | £328,996 | £209,811 | £163,802 | £115,188 |
| 2018-09 | £179,865 | £328,668 | £209,156 | £163,381 | £114,597 |
| 2018-10 | £181,472 | £331,855 | £211,142 | £164,761 | £115,629 |
| 2018-11 | £182,004 | £333,889 | £212,027 | £165,171 | £115,553 |
| 2018-12 | £180,903 | £331,588 | £210,876 | £164,082 | £115,022 |
| 2019-01 | £180,741 | £332,094 | £210,969 | £163,825 | £114,662 |
| 2019-02 | £179,714 | £330,729 | £209,907 | £162,585 | £114,510 |
| 2019-03 | £179,119 | £330,426 | £209,561 | £162,075 | £113,452 |
| 2019-04 | £180,009 | £331,116 | £210,428 | £163,071 | £113,991 |
| 2019-05 | £180,333 | £330,534 | £210,800 | £163,802 | £113,431 |
| 2019-06 | £181,035 | £330,900 | £211,356 | £164,542 | £114,164 |
| 2019-07 | £180,438 | £329,415 | £210,479 | £164,041 | £113,994 |
| 2019-08 | £182,149 | £332,554 | £212,317 | £165,657 | £115,090 |
| 2019-09 | £183,267 | £334,609 | £213,220 | £166,820 | £115,853 |
| 2019-10 | £182,452 | £333,248 | £213,001 | £166,002 | £114,709 |
| 2019-11 | £180,492 | £330,080 | £211,178 | £164,158 | £113,015 |
| 2019-12 | £179,851 | £329,389 | £210,898 | £163,686 | £111,686 |
| 2020-01 | £181,922 | £333,695 | £213,333 | £165,649 | £112,628 |
| 2020-02 | £180,829 | £332,089 | £211,892 | £164,721 | £111,844 |
| 2020-03 | £182,168 | £334,791 | £213,595 | £165,835 | £112,749 |
| 2020-04 | £180,121 | £332,092 | £211,193 | £164,176 | £110,609 |
| 2020-05 | £181,700 | £335,264 | £213,506 | £165,361 | £111,620 |
| 2020-06 | £182,883 | £336,856 | £214,869 | £166,686 | £111,902 |
| 2020-07 | £182,951 | £335,520 | £214,711 | £166,773 | £112,614 |
| 2020-08 | £183,957 | £337,266 | £215,806 | £167,943 | £112,690 |
| 2020-09 | £183,772 | £337,743 | £215,618 | £167,778 | £112,279 |
| 2020-10 | £186,093 | £342,964 | £218,208 | £170,124 | £112,961 |
| 2020-11 | £187,620 | £345,650 | £219,351 | £171,853 | £113,831 |
| 2020-12 | £188,103 | £346,280 | £219,487 | £172,595 | £113,935 |
| 2021-01 | £189,495 | £346,134 | £220,574 | £173,974 | £116,013 |
| 2021-02 | £190,889 | £345,741 | £221,524 | £175,368 | £118,284 |
| 2021-03 | £193,401 | £347,128 | £223,679 | £177,711 | £121,645 |
| 2021-04 | £193,859 | £348,070 | £223,703 | £178,145 | £122,456 |
| 2021-05 | £194,664 | £350,163 | £224,582 | £178,877 | £122,837 |
| 2021-06 | £197,061 | £353,244 | £226,668 | £181,592 | £124,150 |
| 2021-07 | £198,029 | £356,060 | £228,408 | £182,203 | £124,456 |
| 2021-08 | £198,243 | £357,571 | £229,357 | £182,224 | £123,891 |
| 2021-09 | £198,799 | £360,103 | £230,741 | £182,355 | £123,902 |
| 2021-10 | £200,566 | £365,595 | £233,026 | £183,913 | £124,189 |
| 2021-11 | £201,600 | £368,349 | £234,348 | £184,763 | £124,686 |
| 2021-12 | £201,232 | £369,829 | £234,430 | £184,244 | £123,674 |
| 2022-01 | £203,070 | £371,345 | £236,682 | £186,206 | £124,494 |
| 2022-02 | £206,357 | £376,592 | £240,369 | £189,299 | £126,844 |
| 2022-03 | £207,764 | £379,568 | £242,399 | £190,446 | £127,548 |
| 2022-04 | £208,640 | £380,799 | £243,017 | £191,482 | £128,076 |
| 2022-05 | £209,044 | £380,983 | £243,605 | £192,053 | £127,706 |
| 2022-06 | £210,531 | £382,041 | £244,842 | £193,905 | £128,457 |
| 2022-07 | £214,555 | £388,180 | £249,717 | £197,809 | £130,461 |
| 2022-08 | £218,478 | £394,583 | £254,062 | £201,813 | £132,199 |
| 2022-09 | £221,691 | £400,858 | £258,145 | £204,704 | £133,670 |
| 2022-10 | £222,406 | £403,251 | £258,939 | £205,278 | £133,973 |
| 2022-11 | £221,839 | £403,273 | £258,399 | £204,557 | £133,658 |
| 2022-12 | £219,996 | £399,510 | £256,152 | £202,913 | £132,688 |
| 2023-01 | £217,685 | £396,066 | £253,980 | £200,479 | £131,204 |
| 2023-02 | £217,336 | £396,637 | £253,699 | £199,792 | £131,366 |
| 2023-03 | £214,619 | £394,419 | £251,239 | £196,561 | £129,885 |
| 2023-04 | £212,975 | £392,442 | £249,535 | £194,849 | £128,899 |
| 2023-05 | £210,987 | £387,995 | £247,243 | £193,140 | £127,595 |
| 2023-06 | £211,044 | £386,575 | £246,788 | £193,698 | £127,285 |
| 2023-07 | £214,812 | £391,755 | £251,106 | £197,467 | £129,330 |
| 2023-08 | £215,307 | £392,309 | £251,706 | £198,155 | £129,095 |
| 2023-09 | £216,749 | £394,792 | £253,382 | £199,619 | £129,655 |
| 2023-10 | £213,919 | £388,941 | £249,716 | £197,065 | £128,402 |
| 2023-11 | £212,583 | £387,676 | £248,635 | £195,443 | £127,784 |
| 2023-12 | £211,971 | £386,248 | £248,192 | £194,679 | £127,743 |
| 2024-01 | £213,841 | £390,341 | £250,333 | £196,473 | £128,525 |
| 2024-02 | £213,478 | £387,949 | £249,679 | £196,410 | £128,310 |
| 2024-03 | £213,847 | £388,724 | £250,017 | £196,622 | £129,014 |
| 2024-04 | £209,825 | £380,021 | £245,186 | £192,981 | £127,011 |
| 2024-05 | £211,549 | £382,242 | £246,818 | £194,670 | £128,531 |
| 2024-06 | £211,767 | £380,884 | £246,500 | £195,417 | £128,341 |
| 2024-07 | £215,577 | £387,369 | £250,945 | £199,188 | £130,005 |
| 2024-08 | £217,241 | £390,105 | £252,643 | £201,106 | £130,281 |
| 2024-09 | £220,493 | £397,725 | £256,912 | £203,919 | £131,626 |
| 2024-10 | £221,406 | £400,298 | £257,717 | £204,675 | £132,483 |
| 2024-11 | £221,098 | £400,709 | £257,855 | £204,170 | £131,994 |
| 2024-12 | £219,262 | £398,144 | £255,721 | £202,474 | £130,663 |
| 2025-01 | £217,552 | £396,052 | £254,248 | £200,867 | £128,749 |
| 2025-02 | £218,931 | £398,718 | £255,624 | £202,252 | £129,500 |
| 2025-03 | £220,625 | £397,617 | £256,818 | £204,205 | £131,674 |
| 2025-04 | £218,645 | £396,610 | £255,211 | £201,890 | £130,151 |
| 2025-05 | £218,064 | £396,605 | £254,896 | £201,332 | £129,130 |
| 2025-06 | £216,701 | £397,544 | £254,458 | £199,775 | £126,668 |
| 2025-07 | £221,027 | £401,852 | £258,930 | £204,496 | £129,119 |
| 2025-08 | £221,374 | £401,810 | £259,630 | £204,873 | £129,037 |
| 2025-09 | £221,922 | £403,205 | £260,386 | £205,552 | £128,687 |
| 2025-10 | £221,910 | £403,888 | £260,708 | £205,371 | £128,510 |
| 2025-11 | £222,358 | £404,878 | £261,086 | £205,839 | £128,760 |
| 2025-12 | £224,217 | £406,647 | £263,093 | £207,770 | £129,984 |
| 2026-01 | £223,011 | £403,300 | £261,773 | £207,008 | £128,644 |
| 2026-02 | £222,577 | £402,925 | £261,564 | £206,583 | £127,945 |
| 2026-03 | £219,765 | £399,146 | £258,694 | £203,986 | £125,361 |
- All property types
- Detached
- Semi-detached
- Terraced
- Flats
Source: HM Land Registry House Price Index
| Year | All property types | Detached | Semi-detached | Terraced | Flats |
|---|---|---|---|---|---|
| 1996-01 | -2.6% | -2.4% | -1.6% | -3.0% | -3.6% |
| 1996-02 | -4.2% | -3.2% | -3.5% | -4.6% | -5.2% |
| 1996-03 | -5.9% | -4.3% | -4.9% | -6.5% | -7.2% |
| 1996-04 | -3.4% | -1.8% | -2.5% | -4.0% | -4.6% |
| 1996-05 | -2.6% | -1.3% | -1.9% | -3.0% | -4.0% |
| 1996-06 | -0.9% | 0.0% | -0.7% | -1.0% | -2.1% |
| 1996-07 | +1.8% | +2.8% | +2.1% | +1.7% | +0.8% |
| 1996-08 | +1.8% | +2.7% | +2.1% | +1.6% | +0.8% |
| 1996-09 | +2.3% | +3.6% | +2.7% | +2.0% | +1.1% |
| 1996-10 | +2.1% | +3.3% | +2.3% | +2.0% | +0.3% |
| 1996-11 | +3.9% | +4.8% | +3.9% | +4.1% | +1.6% |
| 1996-12 | +2.7% | +3.0% | +2.7% | +3.0% | -0.1% |
| 1997-01 | +6.8% | +6.6% | +6.8% | +7.1% | +4.0% |
| 1997-02 | +6.6% | +7.0% | +6.7% | +6.8% | +4.4% |
| 1997-03 | +9.1% | +9.4% | +8.7% | +9.4% | +7.4% |
| 1997-04 | +7.1% | +7.7% | +7.0% | +7.4% | +5.3% |
| 1997-05 | +7.5% | +8.1% | +7.7% | +7.6% | +5.2% |
| 1997-06 | +5.9% | +7.0% | +6.5% | +5.8% | +2.5% |
| 1997-07 | +2.7% | +3.7% | +3.1% | +2.8% | -0.8% |
| 1997-08 | +3.4% | +4.0% | +3.7% | +3.5% | +0.1% |
| 1997-09 | +5.3% | +5.5% | +5.7% | +5.3% | +2.6% |
| 1997-10 | +6.5% | +6.7% | +7.0% | +6.5% | +4.2% |
| 1997-11 | +5.3% | +6.0% | +5.9% | +5.2% | +2.9% |
| 1997-12 | +4.5% | +5.7% | +5.0% | +4.2% | +2.2% |
| 1998-01 | +5.3% | +7.1% | +5.8% | +5.0% | +3.1% |
| 1998-02 | +7.1% | +8.3% | +7.4% | +6.9% | +5.5% |
| 1998-03 | +5.2% | +6.2% | +5.5% | +5.0% | +3.5% |
| 1998-04 | +5.4% | +6.2% | +5.9% | +5.2% | +3.6% |
| 1998-05 | +5.6% | +6.5% | +6.0% | +5.4% | +3.7% |
| 1998-06 | +7.9% | +8.5% | +8.1% | +7.8% | +6.6% |
| 1998-07 | +9.4% | +9.9% | +9.6% | +9.2% | +8.8% |
| 1998-08 | +7.8% | +8.6% | +8.0% | +7.6% | +7.6% |
| 1998-09 | +6.2% | +7.2% | +6.4% | +6.0% | +5.7% |
| 1998-10 | +5.3% | +6.3% | +5.2% | +5.1% | +4.8% |
| 1998-11 | +6.6% | +7.8% | +6.8% | +6.2% | +6.3% |
| 1998-12 | +7.6% | +8.5% | +7.7% | +7.2% | +8.2% |
| 1999-01 | +8.7% | +9.3% | +9.1% | +8.2% | +9.8% |
| 1999-02 | +6.9% | +7.3% | +7.3% | +6.5% | +7.2% |
| 1999-03 | +9.2% | +9.8% | +9.7% | +8.8% | +9.5% |
| 1999-04 | +7.1% | +7.6% | +7.2% | +7.0% | +7.4% |
| 1999-05 | +7.4% | +7.8% | +7.4% | +7.3% | +8.6% |
| 1999-06 | +6.1% | +6.5% | +6.0% | +6.0% | +6.8% |
| 1999-07 | +6.5% | +7.1% | +6.4% | +6.4% | +6.7% |
| 1999-08 | +7.3% | +7.6% | +7.1% | +7.4% | +7.1% |
| 1999-09 | +8.0% | +8.3% | +7.6% | +8.0% | +8.3% |
| 1999-10 | +8.7% | +9.0% | +8.6% | +8.6% | +9.5% |
| 1999-11 | +10.7% | +10.6% | +10.3% | +10.7% | +11.5% |
| 1999-12 | +11.6% | +11.3% | +11.2% | +11.8% | +12.2% |
| 2000-01 | +10.8% | +10.7% | +10.2% | +11.0% | +10.7% |
| 2000-02 | +10.4% | +10.8% | +9.9% | +10.5% | +10.2% |
| 2000-03 | +9.5% | +10.0% | +9.3% | +9.6% | +8.5% |
| 2000-04 | +12.4% | +13.0% | +12.3% | +12.4% | +12.1% |
| 2000-05 | +12.6% | +13.4% | +12.7% | +12.3% | +12.6% |
| 2000-06 | +13.9% | +14.8% | +14.2% | +13.5% | +15.1% |
| 2000-07 | +13.2% | +14.5% | +13.8% | +12.6% | +14.2% |
| 2000-08 | +15.4% | +17.1% | +16.4% | +14.4% | +16.9% |
| 2000-09 | +15.8% | +18.0% | +16.9% | +14.7% | +17.2% |
| 2000-10 | +15.4% | +17.6% | +16.5% | +14.4% | +16.5% |
| 2000-11 | +12.3% | +14.7% | +13.2% | +11.3% | +13.1% |
| 2000-12 | +11.9% | +14.5% | +13.0% | +10.9% | +12.7% |
| 2001-01 | +13.3% | +15.5% | +14.0% | +12.4% | +14.5% |
| 2001-02 | +15.7% | +17.4% | +16.4% | +15.0% | +16.8% |
| 2001-03 | +16.4% | +17.7% | +16.8% | +15.9% | +17.6% |
| 2001-04 | +16.5% | +18.1% | +16.8% | +15.9% | +17.4% |
| 2001-05 | +15.8% | +17.0% | +16.0% | +15.4% | +16.4% |
| 2001-06 | +15.0% | +16.0% | +14.9% | +14.8% | +15.7% |
| 2001-07 | +14.0% | +14.2% | +13.6% | +13.8% | +15.1% |
| 2001-08 | +12.6% | +12.7% | +11.9% | +12.7% | +13.8% |
| 2001-09 | +12.1% | +11.9% | +11.4% | +12.3% | +13.2% |
| 2001-10 | +12.2% | +11.8% | +11.2% | +12.4% | +13.3% |
| 2001-11 | +14.5% | +13.7% | +13.9% | +14.7% | +15.6% |
| 2001-12 | +14.9% | +13.9% | +14.3% | +15.0% | +16.5% |
| 2002-01 | +15.4% | +14.7% | +15.2% | +15.3% | +17.5% |
| 2002-02 | +13.2% | +12.9% | +12.8% | +13.0% | +15.8% |
| 2002-03 | +13.7% | +13.3% | +13.2% | +13.5% | +16.4% |
| 2002-04 | +13.6% | +12.9% | +13.1% | +13.4% | +16.8% |
| 2002-05 | +16.1% | +15.3% | +15.8% | +15.8% | +19.5% |
| 2002-06 | +16.8% | +16.2% | +16.5% | +16.6% | +19.8% |
| 2002-07 | +19.1% | +18.4% | +18.5% | +19.0% | +21.7% |
| 2002-08 | +20.3% | +19.0% | +19.8% | +20.3% | +22.7% |
| 2002-09 | +22.8% | +20.9% | +22.8% | +22.8% | +24.8% |
| 2002-10 | +23.6% | +21.6% | +24.0% | +23.5% | +25.4% |
| 2002-11 | +24.9% | +23.1% | +24.9% | +24.9% | +26.8% |
| 2002-12 | +25.3% | +23.5% | +25.1% | +25.4% | +26.6% |
| 2003-01 | +27.3% | +24.9% | +26.7% | +27.8% | +28.4% |
| 2003-02 | +29.4% | +26.1% | +29.1% | +29.8% | +30.6% |
| 2003-03 | +30.8% | +27.6% | +30.3% | +31.2% | +32.6% |
| 2003-04 | +28.0% | +25.2% | +28.1% | +28.2% | +29.4% |
| 2003-05 | +24.7% | +22.7% | +24.6% | +25.0% | +25.2% |
| 2003-06 | +22.5% | +20.2% | +22.8% | +22.6% | +23.2% |
| 2003-07 | +23.0% | +20.2% | +23.3% | +23.2% | +23.7% |
| 2003-08 | +23.5% | +20.0% | +23.8% | +23.7% | +24.5% |
| 2003-09 | +22.9% | +19.0% | +22.7% | +23.5% | +23.6% |
| 2003-10 | +23.4% | +19.2% | +22.6% | +24.3% | +24.2% |
| 2003-11 | +21.7% | +17.2% | +21.0% | +22.7% | +22.1% |
| 2003-12 | +22.3% | +17.1% | +21.1% | +23.5% | +22.8% |
| 2004-01 | +20.2% | +15.5% | +19.4% | +21.2% | +20.6% |
| 2004-02 | +20.3% | +15.8% | +19.0% | +21.4% | +20.5% |
| 2004-03 | +18.8% | +14.5% | +17.8% | +19.9% | +18.8% |
| 2004-04 | +19.3% | +13.8% | +17.8% | +20.9% | +18.9% |
| 2004-05 | +20.6% | +13.6% | +18.7% | +22.4% | +21.0% |
| 2004-06 | +23.3% | +15.6% | +21.1% | +25.3% | +23.8% |
| 2004-07 | +23.6% | +16.1% | +21.5% | +25.5% | +24.4% |
| 2004-08 | +22.9% | +16.2% | +21.1% | +24.7% | +23.2% |
| 2004-09 | +22.0% | +15.8% | +20.3% | +23.6% | +22.4% |
| 2004-10 | +21.6% | +15.9% | +19.9% | +23.1% | +22.4% |
| 2004-11 | +20.2% | +14.6% | +18.4% | +21.6% | +21.7% |
| 2004-12 | +18.2% | +13.2% | +16.3% | +19.6% | +19.5% |
| 2005-01 | +15.0% | +10.1% | +13.0% | +16.4% | +16.4% |
| 2005-02 | +14.4% | +9.9% | +12.7% | +15.5% | +15.5% |
| 2005-03 | +13.1% | +8.7% | +11.9% | +14.1% | +14.1% |
| 2005-04 | +13.0% | +9.4% | +12.1% | +13.8% | +13.6% |
| 2005-05 | +12.0% | +9.7% | +11.3% | +12.5% | +12.2% |
| 2005-06 | +7.7% | +5.6% | +6.9% | +8.3% | +7.5% |
| 2005-07 | +5.7% | +3.8% | +4.8% | +6.3% | +5.7% |
| 2005-08 | +4.2% | +2.1% | +3.1% | +4.9% | +4.2% |
| 2005-09 | +4.7% | +2.7% | +3.6% | +5.4% | +5.0% |
| 2005-10 | +4.1% | +2.1% | +3.0% | +4.9% | +4.1% |
| 2005-11 | +4.3% | +2.2% | +3.4% | +5.2% | +3.8% |
| 2005-12 | +5.1% | +2.9% | +4.2% | +5.8% | +4.7% |
| 2006-01 | +6.1% | +3.9% | +5.3% | +6.9% | +5.4% |
| 2006-02 | +4.7% | +2.1% | +3.6% | +5.6% | +4.6% |
| 2006-03 | +5.4% | +2.9% | +4.3% | +6.3% | +4.9% |
| 2006-04 | +4.6% | +2.2% | +3.5% | +5.5% | +4.6% |
| 2006-05 | +6.2% | +3.8% | +5.3% | +6.9% | +5.9% |
| 2006-06 | +7.0% | +5.0% | +6.3% | +7.7% | +6.8% |
| 2006-07 | +8.8% | +6.9% | +8.0% | +9.6% | +8.3% |
| 2006-08 | +8.2% | +6.4% | +7.4% | +9.1% | +7.1% |
| 2006-09 | +7.5% | +5.9% | +6.8% | +8.3% | +6.6% |
| 2006-10 | +5.5% | +4.1% | +5.1% | +6.2% | +4.5% |
| 2006-11 | +5.8% | +4.6% | +5.4% | +6.4% | +5.0% |
| 2006-12 | +5.9% | +4.7% | +5.6% | +6.7% | +4.4% |
| 2007-01 | +7.2% | +6.0% | +7.0% | +7.8% | +5.6% |
| 2007-02 | +7.2% | +6.5% | +7.1% | +7.7% | +5.9% |
| 2007-03 | +5.8% | +4.9% | +5.5% | +6.3% | +4.9% |
| 2007-04 | +5.8% | +4.9% | +5.2% | +6.4% | +4.8% |
| 2007-05 | +4.3% | +3.1% | +3.6% | +5.1% | +3.4% |
| 2007-06 | +5.6% | +4.6% | +4.8% | +6.3% | +4.6% |
| 2007-07 | +4.0% | +3.4% | +3.3% | +4.5% | +3.3% |
| 2007-08 | +4.5% | +4.3% | +4.0% | +4.9% | +3.9% |
| 2007-09 | +3.0% | +2.8% | +2.6% | +3.5% | +2.2% |
| 2007-10 | +3.8% | +3.7% | +3.3% | +4.3% | +3.1% |
| 2007-11 | +3.7% | +3.9% | +3.3% | +4.1% | +3.1% |
| 2007-12 | +3.6% | +4.2% | +3.3% | +3.7% | +3.2% |
| 2008-01 | +2.8% | +3.6% | +2.5% | +2.9% | +2.7% |
| 2008-02 | +1.6% | +2.5% | +1.4% | +1.7% | +1.2% |
| 2008-03 | 0.0% | +1.0% | -0.1% | 0.0% | -0.7% |
| 2008-04 | -0.7% | +1.0% | -0.6% | -0.6% | -2.0% |
| 2008-05 | -1.4% | +0.6% | -1.1% | -1.4% | -2.5% |
| 2008-06 | -1.8% | +0.1% | -1.5% | -1.8% | -2.9% |
| 2008-07 | -3.6% | -2.2% | -3.1% | -3.6% | -4.7% |
| 2008-08 | -7.1% | -6.0% | -6.8% | -7.3% | -7.8% |
| 2008-09 | -9.0% | -7.3% | -8.8% | -9.3% | -9.4% |
| 2008-10 | -9.8% | -8.0% | -9.6% | -10.1% | -10.1% |
| 2008-11 | -11.2% | -9.4% | -11.0% | -11.4% | -11.6% |
| 2008-12 | -15.2% | -13.8% | -14.8% | -15.2% | -16.0% |
| 2009-01 | -18.2% | -16.8% | -17.9% | -18.3% | -19.0% |
| 2009-02 | -18.3% | -16.9% | -17.9% | -18.5% | -19.1% |
| 2009-03 | -14.5% | -13.1% | -14.3% | -14.9% | -14.2% |
| 2009-04 | -13.5% | -12.7% | -13.1% | -13.9% | -12.7% |
| 2009-05 | -12.5% | -11.9% | -12.3% | -12.9% | -11.9% |
| 2009-06 | -13.3% | -12.7% | -13.0% | -13.6% | -13.5% |
| 2009-07 | -11.6% | -10.9% | -11.5% | -11.7% | -12.3% |
| 2009-08 | -6.4% | -5.6% | -6.2% | -6.4% | -7.8% |
| 2009-09 | -3.3% | -3.3% | -2.9% | -3.1% | -5.1% |
| 2009-10 | -1.2% | -1.3% | -0.6% | -1.0% | -3.7% |
| 2009-11 | -0.8% | -1.1% | -0.4% | -0.4% | -3.7% |
| 2009-12 | +4.1% | +3.7% | +4.4% | +4.6% | +1.1% |
| 2010-01 | +9.0% | +8.6% | +9.3% | +9.7% | +4.6% |
| 2010-02 | +10.1% | +9.9% | +10.9% | +10.9% | +4.9% |
| 2010-03 | +8.2% | +8.8% | +9.1% | +8.9% | +2.2% |
| 2010-04 | +8.1% | +9.0% | +8.9% | +8.6% | +2.7% |
| 2010-05 | +6.8% | +8.1% | +7.6% | +7.2% | +2.0% |
| 2010-06 | +6.8% | +8.1% | +7.6% | +7.2% | +2.0% |
| 2010-07 | +5.0% | +6.7% | +5.8% | +5.3% | +0.4% |
| 2010-08 | +3.2% | +4.8% | +4.2% | +3.2% | -1.1% |
| 2010-09 | +2.8% | +4.9% | +3.8% | +2.8% | -1.1% |
| 2010-10 | +2.2% | +4.2% | +3.1% | +2.2% | -1.1% |
| 2010-11 | +3.0% | +5.2% | +3.9% | +2.7% | +0.2% |
| 2010-12 | +0.9% | +3.7% | +1.9% | +0.4% | -1.4% |
| 2011-01 | -1.6% | +1.1% | -0.6% | -2.3% | -2.7% |
| 2011-02 | -1.1% | +1.6% | -0.7% | -1.8% | -1.7% |
| 2011-03 | -2.5% | 0.0% | -2.2% | -3.0% | -2.9% |
| 2011-04 | -3.1% | -0.3% | -2.8% | -3.4% | -3.9% |
| 2011-05 | -3.1% | -0.7% | -2.8% | -3.5% | -4.0% |
| 2011-06 | -2.6% | -0.8% | -2.3% | -3.1% | -2.7% |
| 2011-07 | -1.8% | -0.7% | -1.4% | -2.2% | -1.2% |
| 2011-08 | -2.3% | -1.5% | -2.0% | -2.7% | -2.0% |
| 2011-09 | -2.4% | -1.8% | -2.2% | -2.6% | -2.4% |
| 2011-10 | -3.6% | -2.8% | -3.2% | -3.9% | -4.1% |
| 2011-11 | -3.2% | -2.6% | -2.8% | -3.5% | -3.3% |
| 2011-12 | -3.1% | -2.5% | -2.6% | -3.4% | -3.1% |
| 2012-01 | -1.5% | -1.6% | -1.0% | -1.7% | -1.7% |
| 2012-02 | -1.6% | -2.1% | -1.0% | -1.5% | -2.5% |
| 2012-03 | -0.3% | -2.2% | +0.2% | 0.0% | -1.1% |
| 2012-04 | +0.4% | -1.5% | +0.8% | +0.7% | -0.1% |
| 2012-05 | -0.3% | -2.0% | 0.0% | 0.0% | -0.8% |
| 2012-06 | -0.1% | -1.0% | 0.0% | +0.3% | -1.2% |
| 2012-07 | +0.5% | -0.3% | +0.5% | +1.1% | -1.1% |
| 2012-08 | +1.3% | +0.2% | +1.0% | +2.0% | -0.2% |
| 2012-09 | +1.7% | +0.5% | +1.4% | +2.3% | +0.5% |
| 2012-10 | +2.4% | +1.0% | +2.0% | +3.0% | +1.8% |
| 2012-11 | +1.4% | +0.2% | +1.1% | +2.0% | +0.5% |
| 2012-12 | +2.6% | +1.8% | +2.3% | +3.3% | +1.3% |
| 2013-01 | +2.3% | +1.9% | +2.1% | +2.8% | +0.5% |
| 2013-02 | +2.9% | +2.8% | +3.0% | +3.3% | +1.6% |
| 2013-03 | +2.5% | +3.1% | +2.7% | +2.5% | +1.0% |
| 2013-04 | +4.2% | +4.9% | +4.4% | +4.3% | +2.5% |
| 2013-05 | +4.8% | +5.6% | +5.1% | +4.8% | +3.0% |
| 2013-06 | +4.8% | +5.1% | +5.2% | +4.8% | +3.3% |
| 2013-07 | +3.2% | +3.5% | +3.6% | +3.1% | +2.2% |
| 2013-08 | +4.3% | +4.7% | +4.8% | +4.1% | +3.7% |
| 2013-09 | +5.1% | +5.7% | +5.6% | +4.8% | +4.4% |
| 2013-10 | +5.7% | +6.8% | +6.3% | +5.4% | +4.7% |
| 2013-11 | +6.8% | +7.8% | +7.4% | +6.5% | +5.4% |
| 2013-12 | +5.5% | +5.9% | +6.2% | +5.3% | +4.5% |
| 2014-01 | +5.9% | +6.0% | +6.2% | +5.7% | +5.6% |
| 2014-02 | +4.5% | +4.7% | +4.8% | +4.3% | +4.4% |
| 2014-03 | +5.9% | +6.0% | +6.1% | +5.8% | +5.7% |
| 2014-04 | +4.0% | +3.8% | +4.4% | +4.0% | +3.7% |
| 2014-05 | +5.2% | +4.7% | +5.4% | +5.2% | +4.8% |
| 2014-06 | +5.0% | +5.0% | +5.2% | +5.0% | +4.4% |
| 2014-07 | +6.9% | +7.2% | +7.3% | +6.8% | +6.1% |
| 2014-08 | +6.2% | +6.6% | +6.6% | +6.0% | +5.3% |
| 2014-09 | +6.0% | +5.8% | +6.3% | +6.0% | +5.4% |
| 2014-10 | +5.8% | +5.2% | +6.0% | +6.0% | +5.6% |
| 2014-11 | +6.2% | +5.5% | +6.4% | +6.3% | +6.1% |
| 2014-12 | +7.9% | +7.9% | +8.0% | +7.9% | +7.8% |
| 2015-01 | +7.7% | +8.0% | +7.9% | +7.6% | +7.3% |
| 2015-02 | +8.0% | +8.2% | +8.2% | +7.7% | +8.3% |
| 2015-03 | +6.0% | +6.5% | +6.4% | +5.6% | +6.4% |
| 2015-04 | +6.1% | +6.9% | +6.4% | +5.8% | +6.5% |
| 2015-05 | +6.6% | +7.5% | +7.0% | +6.1% | +6.5% |
| 2015-06 | +6.8% | +7.4% | +7.2% | +6.6% | +6.4% |
| 2015-07 | +6.6% | +7.0% | +7.1% | +6.4% | +6.3% |
| 2015-08 | +6.3% | +6.8% | +6.7% | +6.1% | +6.1% |
| 2015-09 | +6.0% | +7.0% | +6.4% | +5.6% | +5.8% |
| 2015-10 | +7.2% | +8.3% | +7.5% | +6.9% | +6.6% |
| 2015-11 | +7.0% | +8.1% | +7.3% | +6.7% | +6.2% |
| 2015-12 | +7.2% | +8.1% | +7.7% | +7.1% | +6.0% |
| 2016-01 | +6.3% | +6.9% | +6.8% | +6.1% | +5.1% |
| 2016-02 | +7.0% | +7.4% | +7.6% | +7.0% | +5.3% |
| 2016-03 | +7.9% | +7.8% | +8.2% | +8.0% | +6.7% |
| 2016-04 | +9.2% | +9.1% | +9.5% | +9.4% | +7.9% |
| 2016-05 | +9.5% | +9.3% | +9.5% | +9.7% | +8.7% |
| 2016-06 | +11.3% | +11.7% | +11.5% | +11.3% | +10.8% |
| 2016-07 | +11.6% | +12.2% | +11.6% | +11.5% | +11.3% |
| 2016-08 | +10.7% | +11.4% | +10.8% | +10.6% | +10.7% |
| 2016-09 | +9.4% | +9.6% | +9.6% | +9.4% | +9.2% |
| 2016-10 | +7.7% | +8.1% | +8.1% | +7.4% | +8.1% |
| 2016-11 | +7.6% | +8.5% | +8.1% | +7.0% | +8.2% |
| 2016-12 | +6.6% | +7.8% | +6.9% | +6.0% | +7.8% |
| 2017-01 | +8.8% | +10.3% | +8.8% | +8.3% | +9.7% |
| 2017-02 | +8.4% | +9.6% | +8.1% | +8.0% | +9.7% |
| 2017-03 | +8.4% | +10.0% | +8.3% | +7.9% | +9.4% |
| 2017-04 | +6.0% | +7.3% | +5.9% | +5.4% | +7.7% |
| 2017-05 | +6.8% | +8.0% | +7.0% | +6.0% | +8.4% |
| 2017-06 | +6.6% | +7.2% | +6.7% | +5.9% | +8.8% |
| 2017-07 | +7.0% | +7.4% | +7.3% | +6.3% | +9.0% |
| 2017-08 | +7.1% | +7.3% | +7.3% | +6.6% | +8.9% |
| 2017-09 | +8.5% | +9.0% | +8.6% | +7.9% | +10.0% |
| 2017-10 | +8.9% | +9.4% | +9.1% | +8.6% | +9.8% |
| 2017-11 | +9.7% | +9.6% | +9.8% | +9.5% | +10.2% |
| 2017-12 | +9.2% | +8.6% | +9.4% | +9.1% | +9.2% |
| 2018-01 | +10.2% | +9.4% | +10.6% | +10.1% | +10.3% |
| 2018-02 | +10.3% | +10.1% | +10.9% | +10.2% | +9.7% |
| 2018-03 | +10.7% | +10.6% | +11.3% | +10.7% | +9.6% |
| 2018-04 | +10.2% | +10.2% | +10.9% | +10.4% | +7.9% |
| 2018-05 | +7.2% | +7.3% | +7.7% | +7.6% | +4.3% |
| 2018-06 | +6.3% | +6.9% | +7.1% | +6.5% | +3.3% |
| 2018-07 | +5.0% | +6.1% | +5.7% | +5.1% | +2.0% |
| 2018-08 | +6.3% | +7.5% | +7.1% | +6.3% | +3.5% |
| 2018-09 | +5.0% | +6.0% | +5.7% | +5.1% | +2.2% |
| 2018-10 | +5.6% | +6.3% | +6.2% | +5.8% | +3.2% |
| 2018-11 | +5.1% | +5.9% | +5.6% | +5.4% | +2.7% |
| 2018-12 | +5.0% | +5.8% | +5.4% | +5.1% | +2.9% |
| 2019-01 | +3.1% | +4.2% | +3.7% | +3.2% | +0.9% |
| 2019-02 | +2.8% | +3.7% | +3.4% | +2.7% | +1.1% |
| 2019-03 | +1.8% | +2.7% | +2.5% | +1.7% | -0.1% |
| 2019-04 | +2.9% | +3.6% | +3.6% | +2.7% | +1.6% |
| 2019-05 | +3.1% | +3.7% | +3.7% | +3.1% | +1.5% |
| 2019-06 | +2.1% | +2.5% | +2.5% | +2.2% | +0.9% |
| 2019-07 | +1.6% | +1.7% | +1.8% | +1.8% | +0.5% |
| 2019-08 | +1.0% | +1.1% | +1.2% | +1.1% | -0.1% |
| 2019-09 | +1.9% | +1.8% | +1.9% | +2.1% | +1.1% |
| 2019-10 | +0.5% | +0.4% | +0.9% | +0.8% | -0.8% |
| 2019-11 | -0.8% | -1.1% | -0.4% | -0.6% | -2.2% |
| 2019-12 | -0.6% | -0.7% | 0.0% | -0.2% | -2.9% |
| 2020-01 | +0.7% | +0.5% | +1.1% | +1.1% | -1.8% |
| 2020-02 | +0.6% | +0.4% | +0.9% | +1.3% | -2.3% |
| 2020-03 | +1.7% | +1.3% | +1.9% | +2.3% | -0.6% |
| 2020-04 | +0.1% | +0.3% | +0.4% | +0.7% | -3.0% |
| 2020-05 | +0.8% | +1.4% | +1.3% | +1.0% | -1.6% |
| 2020-06 | +1.0% | +1.8% | +1.7% | +1.3% | -2.0% |
| 2020-07 | +1.4% | +1.9% | +2.0% | +1.7% | -1.2% |
| 2020-08 | +1.0% | +1.4% | +1.6% | +1.4% | -2.1% |
| 2020-09 | +0.3% | +0.9% | +1.1% | +0.6% | -3.1% |
| 2020-10 | +2.0% | +2.9% | +2.4% | +2.5% | -1.5% |
| 2020-11 | +3.9% | +4.7% | +3.9% | +4.7% | +0.7% |
| 2020-12 | +4.6% | +5.1% | +4.1% | +5.4% | +2.0% |
| 2021-01 | +4.2% | +3.7% | +3.4% | +5.0% | +3.0% |
| 2021-02 | +5.6% | +4.1% | +4.5% | +6.5% | +5.8% |
| 2021-03 | +6.2% | +3.7% | +4.7% | +7.2% | +7.9% |
| 2021-04 | +7.6% | +4.8% | +5.9% | +8.5% | +10.7% |
| 2021-05 | +7.1% | +4.4% | +5.2% | +8.2% | +10.0% |
| 2021-06 | +7.8% | +4.9% | +5.5% | +8.9% | +10.9% |
| 2021-07 | +8.2% | +6.1% | +6.4% | +9.3% | +10.5% |
| 2021-08 | +7.8% | +6.0% | +6.3% | +8.5% | +9.9% |
| 2021-09 | +8.2% | +6.6% | +7.0% | +8.7% | +10.4% |
| 2021-10 | +7.8% | +6.6% | +6.8% | +8.1% | +9.9% |
| 2021-11 | +7.5% | +6.6% | +6.8% | +7.5% | +9.5% |
| 2021-12 | +7.0% | +6.8% | +6.8% | +6.7% | +8.5% |
| 2022-01 | +7.2% | +7.3% | +7.3% | +7.0% | +7.3% |
| 2022-02 | +8.1% | +8.9% | +8.5% | +7.9% | +7.2% |
| 2022-03 | +7.4% | +9.3% | +8.4% | +7.2% | +4.9% |
| 2022-04 | +7.6% | +9.4% | +8.6% | +7.5% | +4.6% |
| 2022-05 | +7.4% | +8.8% | +8.5% | +7.4% | +4.0% |
| 2022-06 | +6.8% | +8.2% | +8.0% | +6.8% | +3.5% |
| 2022-07 | +8.3% | +9.0% | +9.3% | +8.6% | +4.8% |
| 2022-08 | +10.2% | +10.4% | +10.8% | +10.7% | +6.7% |
| 2022-09 | +11.5% | +11.3% | +11.9% | +12.3% | +7.9% |
| 2022-10 | +10.9% | +10.3% | +11.1% | +11.6% | +7.9% |
| 2022-11 | +10.0% | +9.5% | +10.3% | +10.7% | +7.2% |
| 2022-12 | +9.3% | +8.0% | +9.3% | +10.1% | +7.3% |
| 2023-01 | +7.2% | +6.7% | +7.3% | +7.7% | +5.4% |
| 2023-02 | +5.3% | +5.3% | +5.5% | +5.5% | +3.6% |
| 2023-03 | +3.3% | +3.9% | +3.6% | +3.2% | +1.8% |
| 2023-04 | +2.1% | +3.1% | +2.7% | +1.8% | +0.6% |
| 2023-05 | +0.9% | +1.8% | +1.5% | +0.6% | -0.1% |
| 2023-06 | +0.2% | +1.2% | +0.8% | -0.1% | -0.9% |
| 2023-07 | +0.1% | +0.9% | +0.6% | -0.2% | -0.9% |
| 2023-08 | -1.5% | -0.6% | -0.9% | -1.8% | -2.3% |
| 2023-09 | -2.2% | -1.5% | -1.8% | -2.5% | -3.0% |
| 2023-10 | -3.8% | -3.5% | -3.6% | -4.0% | -4.2% |
| 2023-11 | -4.2% | -3.9% | -3.8% | -4.5% | -4.4% |
| 2023-12 | -3.6% | -3.3% | -3.1% | -4.1% | -3.7% |
| 2024-01 | -1.8% | -1.4% | -1.4% | -2.0% | -2.0% |
| 2024-02 | -1.8% | -2.2% | -1.6% | -1.7% | -2.3% |
| 2024-03 | -0.4% | -1.4% | -0.5% | 0.0% | -0.7% |
| 2024-04 | -1.5% | -3.2% | -1.7% | -1.0% | -1.5% |
| 2024-05 | +0.3% | -1.5% | -0.2% | +0.8% | +0.7% |
| 2024-06 | +0.3% | -1.5% | -0.1% | +0.9% | +0.8% |
| 2024-07 | +0.4% | -1.1% | -0.1% | +0.9% | +0.5% |
| 2024-08 | +0.9% | -0.6% | +0.4% | +1.5% | +0.9% |
| 2024-09 | +1.7% | +0.7% | +1.4% | +2.2% | +1.5% |
| 2024-10 | +3.5% | +2.9% | +3.2% | +3.9% | +3.2% |
| 2024-11 | +4.0% | +3.4% | +3.7% | +4.5% | +3.3% |
| 2024-12 | +3.4% | +3.1% | +3.0% | +4.0% | +2.3% |
| 2025-01 | +1.7% | +1.5% | +1.6% | +2.2% | +0.2% |
| 2025-02 | +2.6% | +2.8% | +2.4% | +3.0% | +0.9% |
| 2025-03 | +3.2% | +2.3% | +2.7% | +3.9% | +2.1% |
| 2025-04 | +4.2% | +4.4% | +4.1% | +4.6% | +2.5% |
| 2025-05 | +3.1% | +3.8% | +3.3% | +3.4% | +0.5% |
| 2025-06 | +2.3% | +4.4% | +3.2% | +2.2% | -1.3% |
| 2025-07 | +2.5% | +3.7% | +3.2% | +2.7% | -0.7% |
| 2025-08 | +1.9% | +3.0% | +2.8% | +1.9% | -1.0% |
| 2025-09 | +0.6% | +1.4% | +1.4% | +0.8% | -2.2% |
| 2025-10 | +0.2% | +0.9% | +1.2% | +0.3% | -3.0% |
| 2025-11 | +0.6% | +1.0% | +1.3% | +0.8% | -2.5% |
| 2025-12 | +2.3% | +2.1% | +2.9% | +2.6% | -0.5% |
| 2026-01 | +2.5% | +1.8% | +3.0% | +3.1% | -0.1% |
| 2026-02 | +1.7% | +1.1% | +2.3% | +2.1% | -1.2% |
| 2026-03 | -0.4% | +0.4% | +0.7% | -0.1% | -4.8% |
Sold House Prices in Coventry
The average sold price across all property types in Coventry is £219,765, which is 24.2% below the England average of £289,946 as of March 2026. The discount runs across every property type but widens sharply at the lower end. Detached homes sit 15.2% under England, while flats are 41.6% cheaper, and that spread tells you where the rental value concentrates.
| Property Type | Coventry Average | England Average | Difference |
|---|---|---|---|
| Detached houses | £399,146 | £470,492 | -15.2% |
| Semi-detached houses | £258,694 | £288,185 | -10.2% |
| Terraced houses | £203,986 | £243,788 | -16.3% |
| Flats and maisonettes | £125,361 | £214,563 | -41.6% |
| All property types | £219,765 | £289,946 | -24.2% |
Detached houses at £399,146 carry the smallest discount at 15.2% below England's £470,492. The detached stock sits mostly in the outer postcodes such as CV7 and CV8, where Coventry shades into Warwickshire and competes with commuter-belt buyers rather than the city's own income base. Annual growth of 0.4% shows a market that is holding rather than moving.
Semi-detached houses at £258,694 sit 10.2% below England's £288,185, the narrowest gap of any type. The semi is the everyday family home across CV2, CV4 and CV6, and it forms the backbone of the city's owner-occupier and family-let market. Annual growth of 0.7% is the firmest of the four types.
Terraced houses at £203,986 offer a 16.3% discount to England's £243,788. The terraced stock concentrates in the central postcodes, particularly CV1 and CV6, where rows of pre-war and Victorian houses feed straight into the buy-to-let and student-share market. Annual change of -0.1% is essentially flat over the year.
Flats and maisonettes at £125,361 show the deepest discount at 41.6% below England's £214,563. Coventry has a sizeable purpose-built flat market in CV1, built around the city centre and the universities, but without the institutional investor weight that lifts flat values in Birmingham or Manchester, prices reflect local demand only. Annual change of -4.8% confirms a soft year for the type.

Price Per Square Foot in Coventry
£183 per square foot separates Coventry's cheapest postcode from its dearest, with CV1 at £209 and CV8 at £392. Working in price per square foot strips out how big the homes are and shows what the location itself commands. CV8, the Kenilworth-facing southern edge, tops the table by some distance, while the central CV1 sits at the bottom on the strength of its smaller, cheaper city-centre stock.
| Rank | Area | Price Per Sq Ft |
|---|---|---|
| 1 | CV1 (City Centre) | £209 |
| 2 | CV2 (Walsgrave, Wyken) | £246 |
| 3 | CV6 (Foleshill, Holbrooks) | £247 |
| 4 | CV4 (Canley, Tile Hill) | £272 |
| 5 | CV3 (Cheylesmore, Binley) | £273 |
| 6 | CV5 (Earlsdon, Allesley) | £278 |
| 7 | CV7 (Keresley, Balsall Common) | £302 |
| 8 | CV8 (Kenilworth fringe) | £392 |
CV1 at £209 per square foot is the cheapest space in the city, drawn from 272 transactions analysed. The city-centre and university stock here is smaller and more affordable per unit of floor area, which is exactly what a buy-to-let investor letting by the room or to students is looking for. CV2 and CV6 follow close behind at £246 and £247, the next rungs of value.
CV8 at £392 per square foot tops the table, sitting 88% above CV1. The premium reflects the larger, more expensive houses on Coventry's south-western edge towards Kenilworth, where buyers pay for space and setting. From 690 transactions analysed, CV8's per-square-foot figure is consistently the highest of the eight postcodes.
For Sale Asking Prices in Coventry
CV1 at £163,893 and CV8 at £437,918 sit 167.2% apart, the widest asking-price gap across Coventry's eight postcodes. That spread mirrors the sold-price hierarchy but stretches it further, and the mean asking price across all eight postcodes is £293,448. At the very top of that hierarchy, our sold-price ranking of the most expensive streets in Coventry finds the CV7 village belt and the CV4 edge supplying eight of the ten dearest streets.
| Rank | Area | Asking Price |
|---|---|---|
| 1 | CV1 (City Centre) | £163,893 |
| 2 | CV6 (Foleshill, Holbrooks) | £220,663 |
| 3 | CV2 (Walsgrave, Wyken) | £226,049 |
| 4 | CV5 (Earlsdon, Allesley) | £283,391 |
| 5 | CV3 (Cheylesmore, Binley) | £294,630 |
| 6 | CV4 (Canley, Tile Hill) | £314,806 |
| 7 | CV7 (Keresley, Balsall Common) | £406,232 |
| 8 | CV8 (Kenilworth fringe) | £437,918 |
CV1 at £163,893 is the lowest entry point by a clear margin, more than £56,000 below the next postcode. That is the city-centre and university quarter, where smaller flats and terraces keep the average down. For an investor with a fixed budget, CV1 buys the most doors for the money and the lowest barrier to entry of any Coventry postcode.
At the top, CV7 and CV8 at £406,232 and £437,918 are outer postcodes where Coventry runs into the Warwickshire green belt. These are owner-occupier and family-home territory, priced well above the city-wide mean of £293,448, and the rental yield data further down confirms they earn their keep on capital rather than income. The cluster of CV6, CV2, CV5 and CV3 between £220,000 and £295,000 is where most of the city's everyday buy-to-let stock sits.
House Price Growth in Coventry
CV2 leads Coventry on five-year growth at 23.1%, more than three times the 7.4% posted by CV1 over the same window. Seven of the eight postcodes delivered positive five-year returns, with CV7 the lone exception at -6.2%. The one-year and three-year columns are more mixed, with several postcodes down over the shorter windows after the recent easing.
| Area | 1 Year | 3 Years | 5 Years |
|---|---|---|---|
| CV2 (Walsgrave, Wyken) | 4.2% | 6.8% | 23.1% |
| CV6 (Foleshill, Holbrooks) | -2.2% | -0.3% | 15.6% |
| CV5 (Earlsdon, Allesley) | 3.7% | 3.1% | 11.8% |
| CV3 (Cheylesmore, Binley) | -6.8% | -0.3% | 11.5% |
| CV8 (Kenilworth fringe) | 0.0% | 2.5% | 7.5% |
| CV1 (City Centre) | 8.5% | -5.1% | 7.4% |
| CV4 (Canley, Tile Hill) | -2.7% | -1.8% | 5.2% |
| CV7 (Keresley, Balsall Common) | -2.2% | -0.5% | -6.2% |
CV2 at 23.1% over five years is the strongest performer in the city, and it is the only postcode positive across all three timeframes. Walsgrave and Wyken combine affordable family stock with hospital and motorway employment on the city's eastern side, and that steady demand has translated into the most consistent growth record of the eight.
CV1 shows the sharpest split in the table: the strongest one-year reading at 8.5% sits on top of a -5.1% three-year figure. The city-centre market fell back after the pandemic peak and is now rebounding, but its five-year return of 7.4% is among the lowest, so the recent jump is a recovery rather than sustained outperformance. CV7 is the only postcode negative over five years at -6.2%, with its outer, higher-priced stock the slowest to recover.
Monthly Property Sales in Coventry
Monthly sales run from 12 transactions in CV1 to 66 in CV6, the busiest postcode in the city. Turnover, monthly sales as a share of the homes advertised for sale, tells the clearer story: it ranges from 7% in CV1 up to 19% in CV6, a wide spread that signals very different selling conditions across the eight postcodes.
| Area | Sales Per Month | Turnover | Asking Price |
|---|---|---|---|
| CV6 (Foleshill, Holbrooks) | 66 | 19% | £220,663 |
| CV3 (Cheylesmore, Binley) | 50 | 12% | £294,630 |
| CV2 (Walsgrave, Wyken) | 49 | 18% | £226,049 |
| CV5 (Earlsdon, Allesley) | 45 | 13% | £283,391 |
| CV7 (Keresley, Balsall Common) | 30 | 10% | £406,232 |
| CV8 (Kenilworth fringe) | 30 | 11% | £437,918 |
| CV4 (Canley, Tile Hill) | 24 | 10% | £314,806 |
| CV1 (City Centre) | 12 | 7% | £163,893 |
CV6 records both the most sales at 66 a month and the highest turnover at 19%, a sign of an active, liquid market in the affordable Foleshill and Holbrooks stock. CV2 is close behind on turnover at 18%, so the two cheaper northern and eastern postcodes are where homes change hands most readily. For a buy-to-let investor, a busy market means an easier exit when the time comes to sell.
CV1 sits at the other end with just 12 sales a month and 7% turnover, the lowest in the city despite being the cheapest postcode. The city-centre market is dominated by flats that sell more slowly, so the low asking price comes paired with a thinner, slower resale market, a trade-off worth weighing alongside its headline yield.
How Long Properties Take to Sell in Coventry
The selling-speed gap across Coventry is stark: CV6 finds a buyer in around 160 days while CV1 sits on the market for roughly 507 days. Days on market is how long a typical home is listed before it sells, and the months of unsold stock measures how much for-sale supply is queued at the current rate of sales. A postcode that takes three times as long to sell is carrying a real holding cost that a yield figure never shows.
| Area | Avg Days to Sell | Months of Unsold Stock | Market |
|---|---|---|---|
| CV6 (Foleshill, Holbrooks) | 160 | 5.3 | Seller's market |
| CV2 (Walsgrave, Wyken) | 190 | 6.3 | Balanced market |
| CV5 (Earlsdon, Allesley) | 234 | 7.7 | Balanced market |
| CV3 (Cheylesmore, Binley) | 254 | 8.3 | Balanced market |
| CV8 (Kenilworth fringe) | 277 | 9.1 | Balanced market |
| CV4 (Canley, Tile Hill) | 304 | 10.0 | Balanced market |
| CV7 (Keresley, Balsall Common) | 304 | 10.0 | Balanced market |
| CV1 (City Centre) | 507 | 16.7 | Buyer's market |
CV6 is the only postcode the data reads as a seller's market, clearing in about 160 days with 5.3 months of unsold stock behind it. CV1 is the opposite end, the one buyer's market in the city, where 16.7 months of stock means a property can sit for the best part of two years before it sells. So the postcode with the highest headline yield also has the slowest exit, and an investor in CV1 is trading liquidity for income in a way the rest of the city is not.
What Type of Property Can You Buy in Coventry?
The housing mix flips completely across the city: CV1 is 38% terraced and 37% flats, while CV8 is 46% detached with under 7% flats. That contrast shapes which strategies fit where, and the figures below are drawn from 2021 Census records for each postcode.
| Area | Detached | Semi-detached | Terraced | Flats |
|---|---|---|---|---|
| CV1 (City Centre) | 5.8% | 19.0% | 37.8% | 37.4% |
| CV2 (Walsgrave, Wyken) | 32.4% | 31.4% | 27.0% | 8.7% |
| CV3 (Cheylesmore, Binley) | 19.1% | 34.1% | 28.0% | 18.8% |
| CV4 (Canley, Tile Hill) | 34.1% | 35.2% | 16.8% | 13.8% |
| CV5 (Earlsdon, Allesley) | 35.8% | 26.1% | 21.8% | 11.9% |
| CV6 (Foleshill, Holbrooks) | 15.7% | 31.1% | 40.8% | 12.2% |
| CV7 (Keresley, Balsall Common) | 43.9% | 30.3% | 15.8% | 7.3% |
| CV8 (Kenilworth fringe) | 46.4% | 31.4% | 13.7% | 6.8% |
CV1 holds by far the largest share of flats at 37.4% and terraces at 37.8%, the smaller-unit stock that drives the buy-to-let market. That mix lines up with CV1 carrying the lowest asking price and the highest yield in the city. City-centre flats suit single lets and student sharers, while the terraces feed lower-cost family and shared lets close to the universities.
At the other end, CV8 and CV7 are detached-dominated at 46.4% and 43.9%, with flats down at 6.8% and 7.3%. Detached and semi-detached homes together account for more than three-quarters of the stock in both, which matches their premium prices and their position at the bottom of the yield table. CV6 stands out among the affordable postcodes for its 40.8% terraced share, the highest in the city.
Flats here combine purpose-built blocks and converted units. A small share of mobile and temporary dwellings is left out, so rows may not add up to exactly 100%.
Coventry Rental Market Analysis
Monthly rents in Coventry run from £945 in CV1 to £1,214 in CV7, with gross yields from 3.1% to 6.9% across the eight postcodes. For investors asking whether rental property is a worthwhile investment in Coventry, the sections below break down rents, yields and tenant affordability postcode by postcode. If you are looking at how to build a property portfolio uk in the West Midlands, Coventry's two-university tenant base and central below-average prices give it a different demand profile from its higher-priced neighbours. Browse current buy-to-let property for sale across the region.

Average Rent & Gross Rental Yields in Coventry
Gross rental yields in Coventry range from 3.1% in CV8 to 6.9% in CV1, the widest yield spread of any city in this guide. The pattern is clean: the cheaper the postcode, the higher the yield. CV1 delivers the top 6.9% on the lowest rent in the city, £945 a month, purely because its £163,893 asking price is so far below the rest.
| Area | Average Monthly Rent | Asking Price | Gross Yield |
|---|---|---|---|
| CV1 (City Centre) | £945 | £163,893 | 6.9% |
| CV6 (Foleshill, Holbrooks) | £1,073 | £220,663 | 5.8% |
| CV2 (Walsgrave, Wyken) | £1,013 | £226,049 | 5.4% |
| CV5 (Earlsdon, Allesley) | £1,082 | £283,391 | 4.6% |
| CV3 (Cheylesmore, Binley) | £1,114 | £294,630 | 4.5% |
| CV4 (Canley, Tile Hill) | £1,124 | £314,806 | 4.3% |
| CV7 (Keresley, Balsall Common) | £1,214 | £406,232 | 3.6% |
| CV8 (Kenilworth fringe) | £1,113 | £437,918 | 3.1% |
CV1 at 6.9% leads on yield with the lowest rent and the lowest price in the city. A 30% deposit of £49,168 puts an investor into the highest-yielding postcode in Coventry, and the central location and university demand sit behind that figure. The tenant base here is a mix of students and young professionals drawn to the city centre.
CV6 and CV2 at 5.8% and 5.4% are the next tier, where mid-range prices around £220,000 to £226,000 still pair with rents above £1,000 to keep yields strong. At the bottom, CV8 at 3.1% charges a £1,113 rent that looks healthy until you set it against the £437,918 price, where the premium does far more for the capital value than the income return.
Is Coventry Rent High?
Monthly rents in Coventry take between 30.0% and 38.6% of the local median gross monthly salary. The widely cited threshold for rent affordability is 30% of gross income, and every Coventry postcode sits at or above that line. The pressure is sharpest in the outer postcodes, where higher rents meet the same city-wide median wage.
The median gross weekly salary in Coventry is £726.10, which equates to £3,147 per month or £37,759 per year. This is below the Great Britain median of £752.40 per week and broadly in line with the wider West Midlands. Data from the Nomis Labour Market Profile (ASHE 2025).
| Rank | Area | Rent as % of Income |
|---|---|---|
| 1 | CV7 (Keresley, Balsall Common) | 38.6% |
| 2 | CV4 (Canley, Tile Hill) | 35.7% |
| 3 | CV3 (Cheylesmore, Binley) | 35.4% |
| 4 | CV8 (Kenilworth fringe) | 35.4% |
| 5 | CV5 (Earlsdon, Allesley) | 34.4% |
| 6 | CV6 (Foleshill, Holbrooks) | 34.1% |
| 7 | CV2 (Walsgrave, Wyken) | 32.2% |
| 8 | CV1 (City Centre) | 30.0% |
CV1 at 30.0% sits right on the affordability line and is the most manageable for tenants in the city. A £945 rent against a £3,147 monthly salary leaves a little headroom, which matters for landlords because tenants who are not stretched tend to stay longer and fall into arrears less often. The student share of CV1 demand also spreads that affordability across household types rather than single earners.
CV7 at 38.6% is the least affordable on the median wage, but the context is that its £1,214 rent is paid by households in the outer, more expensive suburbs rather than median earners. Across the city the spread is narrow, with every postcode clustered between 30% and 39%, a sign of rents that track the local wage fairly closely.
How Big Is Coventry's Private Rented Sector?
The private rented sector is deepest in CV1, where it accounts for 41.6% of households, more than three times the 12.4% share in CV8. The proportion of homes already let privately is a read on the size and depth of the established tenant pool. The table below shows household tenure by postcode.
| Area | Owned Outright | Owned with Mortgage | Private Rented | Social Rented |
|---|---|---|---|---|
| CV1 (City Centre) | 16.1% | 16.0% | 41.6% | 25.5% |
| CV6 (Foleshill, Holbrooks) | 29.3% | 31.6% | 23.6% | 14.4% |
| CV3 (Cheylesmore, Binley) | 36.3% | 31.1% | 18.8% | 13.2% |
| CV7 (Keresley, Balsall Common) | 44.0% | 30.5% | 17.3% | 7.4% |
| CV2 (Walsgrave, Wyken) | 38.9% | 31.9% | 16.7% | 11.2% |
| CV5 (Earlsdon, Allesley) | 45.3% | 31.3% | 16.1% | 6.7% |
| CV4 (Canley, Tile Hill) | 39.9% | 31.0% | 15.1% | 12.5% |
| CV8 (Kenilworth fringe) | 45.3% | 33.5% | 12.4% | 7.6% |
CV1 has the largest private rented sector in Coventry by a wide margin, with 41.6% of homes let privately and owner-occupation down at around 32%. A rented share that high points to a deep, proven lettings market rather than an untested one, and it pairs with CV1's top yield and its concentration of flats and terraces. The central postcode is where the city's rental demand is most established.
CV6 follows at 23.6%, and the outer postcodes thin out from there, with CV8 the lowest at 12.4% private rented against 45.3% outright ownership. The pattern is consistent: the cheaper, more central postcodes carry the deeper tenant pools, while the affluent fringe is owner-occupier country. CV3 also runs a 13.2% social rented share, worth noting for landlords reading local demand.
On the rental-demand side, the central postcodes let quickly. CV3 sees homes let in around 51 days and CV6 in about 52, both reading as landlord's markets where tenant demand outstrips the supply of available lets. CV1 is the slower exception at roughly 107 days, where a larger pool of around 330 listings keeps the balance even between landlords and tenants.
Local Housing Allowance Rates in Coventry
Most of Coventry falls within the Coventry Broad Rental Market Area, where Local Housing Allowance runs from £99.50 a week for a shared room to £230.14 a week for a four-bedroom home. Local Housing Allowance is the most a tenant on housing support can claim towards rent, so rent above that level comes out of the tenant's own income. Unusually for a single city, Coventry's postcodes span two market areas: CV1 to CV7 sit in the Coventry area, while CV8 falls into the higher Warwickshire South area. To check the current rate for a specific address, you can use the government's official Local Housing Allowance calculator.
| Property Size | Weekly LHA Rate | Monthly Equivalent |
|---|---|---|
| Shared accommodation | £99.50 | £431 |
| 1 bedroom | £132.33 | £573 |
| 2 bedrooms | £155.34 | £673 |
| 3 bedrooms | £178.36 | £773 |
| 4 bedrooms | £230.14 | £997 |
The two-bedroom Coventry rate of £155.34 a week works out at around £673 a month, below the £945 to £1,214 open-market rents recorded across the city. A benefit-backed tenancy at the LHA rate therefore sits under Coventry's market rents, and the stock that fits within these rates clusters in CV1, CV2 and CV6, where both asking prices and rents are lowest. CV8, in the Warwickshire South area, carries higher rates, with the two-bed at £195.62 a week, reflecting the more expensive south of the city. The rates update each April, so a landlord pricing a benefit-funded let should check the live figure before committing.
Buy-to-Let Considerations
Are House Prices High in Coventry? Price-to-Earnings Ratios
Buying a property in Coventry takes between 4.3 and 11.6 times the median annual salary. This is based on the Nomis Labour Market Profile for Coventry showing the median gross annual income for Coventry residents is £37,759.
The national benchmark for price-to-earnings is 7.4x (England's average sold price of £289,946 divided by the Great Britain median annual salary of £39,125). Three of Coventry's eight postcodes sit below that benchmark, meaning they are more affordable relative to local incomes than the England average is relative to national incomes.
| Rank | Area | Price-to-Earnings Ratio |
|---|---|---|
| 1 | CV1 (City Centre) | 4.3x |
| 2 | CV6 (Foleshill, Holbrooks) | 5.8x |
| 3 | CV2 (Walsgrave, Wyken) | 6.0x |
| 4 | CV5 (Earlsdon, Allesley) | 7.5x |
| 5 | CV3 (Cheylesmore, Binley) | 7.8x |
| 6 | CV4 (Canley, Tile Hill) | 8.3x |
| 7 | CV7 (Keresley, Balsall Common) | 10.8x |
| 8 | CV8 (Kenilworth fringe) | 11.6x |
CV1 at 4.3x is well below the national benchmark of 7.4x and the most affordable entry point in the city against local earnings. At a little over four times the median salary, CV1 is one of the cheapest postcodes relative to income anywhere in the West Midlands, which is what underpins its standing as the city's yield leader.
CV8 at 11.6x sits well above the benchmark. At more than eleven times the local median wage, the Kenilworth-facing postcode is firmly in premium territory, bought by dual-income households and out-of-city buyers rather than median earners. For an investor, that ratio compresses the yield to 3.1% and pushes the income payback out a long way.
Deposit Requirements in Coventry
A 30% deposit on a Coventry buy-to-let runs from £49,168 in CV1 to £131,375 in CV8. The £82,207 gap between the cheapest and dearest deposit is enough to cover a second full deposit in CV1 with room to spare. These figures sit below much of the South but above the cheapest West Midlands postcodes.
Beyond the deposit, the buy to let stamp duty calculator and other buy to let expenses add to the total capital required.
| Rank | Area | 30% Deposit Required |
|---|---|---|
| 1 | CV1 (City Centre) | £49,168 |
| 2 | CV6 (Foleshill, Holbrooks) | £66,199 |
| 3 | CV2 (Walsgrave, Wyken) | £67,815 |
| 4 | CV5 (Earlsdon, Allesley) | £85,017 |
| 5 | CV3 (Cheylesmore, Binley) | £88,389 |
| 6 | CV4 (Canley, Tile Hill) | £94,442 |
| 7 | CV7 (Keresley, Balsall Common) | £121,870 |
| 8 | CV8 (Kenilworth fringe) | £131,375 |
CV1 is the cheapest way into Coventry at a £49,168 deposit, and that single figure does a lot of the work behind the postcode's appeal. The same money would leave an investor a long way short of a deposit in CV7 or CV8, where 30% lands at over £120,000. Stepping up from CV1 to CV6 costs roughly £17,000 more and buys a busier, more liquid market in exchange for a slightly lower 5.8% yield.
At the top, CV7 and CV8 sit £9,505 apart on the deposit but they are different investments. CV8 brings a marginally higher price but the south-edge setting near Kenilworth, while CV7 has the higher rent at £1,214 a month against CV8's £1,113. Both demand a six-figure deposit and return yields of 3.6% and 3.1%, so they are capital-led holdings rather than income plays.

What the Coventry Data Tells Buy-to-Let Investors
In Coventry the cheapest postcode is also the highest-yielding by a clear margin. CV1 carries the top yield at 6.9%, the lowest asking price for buying an investment property at £163,893, and the most affordable prices against local earnings at 4.3 times income. A 30% deposit there is £49,168, the lowest in the city, on a home renting at £945 a month, and the 41.6% private rented share confirms the tenant demand is already there.
CV2 is where income and growth come closest to meeting. It pairs a 5.4% yield with the city's strongest five-year growth at 23.1%, and it is the only postcode positive across one, three and five years. CV6 sits alongside it on the affordable tier, with a higher 5.8% yield, the busiest resale market in the city at 19% turnover, and the fastest selling times. The mid-tier postcodes around it, CV3, CV4 and CV5, run yields in the 4.3% to 4.6% band on prices closer to the city mean.
The outer postcodes tell the opposite story. CV7 and CV8 demand six-figure deposits for yields of 3.6% and 3.1%, and CV7 is the only postcode down over five years at -6.2%. These are capital-and-setting holdings rather than income plays. CV1's headline yield also comes with a catch worth naming: at 507 days on market and 16.7 months of unsold stock it is the slowest postcode to sell, so the income leader is also the hardest to exit. Buyers chasing a sharper asking price often work the off market property route before stock reaches the portals.
Coventry has no city-wide selective licence for private landlords, though that can change at ward level, so check the current position before buying. With two universities, a city-centre regeneration programme under way and prices a quarter below the England average, Coventry reads as a yield-and-affordability market with a deep central tenant base, rather than one resting on high local wages.
How Coventry Compares
Coventry's mean asking price of £293,448 sits in the middle of its West Midlands neighbours, but its 6.9% top yield is bettered only by Leicester among the five. The comparison below places Coventry alongside four nearby locations, each with a different investor profile. The mean asking price and mean monthly rent are simple averages across all postcodes with data, and the top gross yield is the single highest postcode yield in each location.
| Location | Mean Asking Price | Mean Monthly Rent | Mean Gross Yield | Top Yield (postcode) |
|---|---|---|---|---|
| Wolverhampton | £255,437 | £986 | 4.6% | 5.5% (WV1) |
| Birmingham | £274,029 | £1,111 | 4.9% | 7.2% (B18) |
| Coventry | £293,448 | £1,085 | 4.4% | 6.9% (CV1) |
| Leicester | £300,970 | £1,058 | 4.2% | 7.3% (LE1) |
| Solihull | £503,452 | £1,285 | 3.1% | 5.6% (B37) |
Coventry sits mid-table on price at £293,448 mean asking, dearer than Wolverhampton at £255,437 and Birmingham at £274,029, but well below Solihull at £503,452. Its 6.9% top yield, driven by CV1, lands close to Birmingham's 7.2% and Leicester's 7.3% and clears Wolverhampton and Solihull, which both top out in the mid-5% range.
For investors weighing income against price point, Birmingham and Leicester are the closest peers, with similar mean prices and slightly higher top yields drawn from larger postcode counts. Solihull is the premium outlier, where a much higher price point trades yield for an affluent commuter-belt tenant base. Coventry's distinction within the group is the two-university demand and the city-centre regeneration behind a price a quarter below the England average. For a data-driven comparison across every UK location, see our best buy-to-let areas guide.
Frequently Asked Questions
What are buy-to-let prices, yields and growth in Coventry?
The average sold price is £219,765, around 24.2% below the England average of £289,946, while the city-centre CV1 postcode records the city's highest gross yield at 6.9%. Coventry's sold-price index increased 13.6% over the five years to March 2026. Two universities and a £450 million city-centre regeneration programme provide wider market context rather than proof of demand for an individual property.
Local wages are slightly below the national median and unemployment is higher. CV1, CV2 and CV6 record the strongest gross yields in the postcode table, while the historic growth figures vary by postcode and period.
What are the best areas in Coventry for property investment?
It splits cleanly by what you are after. CV1 (City Centre) is the cheapest entry at £163,893 and the highest-yielding at 6.9%, so it leans hard towards income, with a 41.6% private rented share to match. CV2 (Walsgrave, Wyken) is the growth pick, the only postcode positive across one, three and five years, with 23.1% five-year growth on a 5.4% yield.
CV6 (Foleshill, Holbrooks) sits between the two, a 5.8% yield in the city's busiest, fastest-selling market. At the top end, CV7 and CV8 are the premium, low-yield postcodes towards the Warwickshire edge. If income leads, CV1 tops the yield table; if you want growth that has shown up consistently, CV2 has the cleanest record.
How does Coventry compare to Birmingham for buy-to-let?
They are close peers with a few differences. Birmingham's mean asking price is £274,029 against Coventry's £293,448, and its top yield of 7.2% edges Coventry's 6.9%. Birmingham also gives you far more choice, with 44 postcodes carrying price data against Coventry's eight, and a larger, more varied rental market.
Coventry's pull is its two-university tenant base concentrated in a smaller area, and the City Centre South regeneration adding nearly 1,000 homes to the centre. Birmingham offers scale and slightly higher headline yields; Coventry offers a tighter, student-anchored market at a similar price point. Both sit on the same fast rail line, around 20 minutes apart.
Is there demand for student accommodation in Coventry?
Yes, and it is one of the city's defining features. The University of Warwick and Coventry University between them bring tens of thousands of students to the city, and much of that demand lands in CV1 and the central postcodes, where flats and terraces suit shared lets. CV1's 41.6% private rented share is the deepest in the city and reflects that student weight.
Student lets come with summer voids and more hands-on management than a standard tenancy, so factor that in. On the shared-house side, a sample of current CV1 adverts puts an ensuite double room at around £133 a week and a double with a shared bathroom at about £114. For the purpose-built end of the market, see our guide to purpose built student accommodation, and for shared houses our complete guide to investing in HMOs.
Can I find buy-to-let property under £200,000 in Coventry?
Yes, more readily than in most cities this size. CV1 (City Centre) averages £163,893, comfortably below £200,000, and it is also the highest-yielding postcode at 6.9%. CV6 and CV2 sit just above at £220,663 and £226,049, so the affordable, higher-yield stock clusters in the central and northern postcodes.
By property type the entry point drops further: flats across Coventry average £125,361 on the Land Registry index, and terraces £203,986. If sub-£200,000 is the target, CV1 flats and terraces are where to look, or explore BMV properties for sale to come in under asking.
When will the City Centre South development affect Coventry property prices?
It is a medium-term story rather than an immediate one. Demolition on the £450 million scheme started in June 2025 and the first of up to 1,575 new homes are targeted for late 2027, so the residential impact builds from 2027 onwards rather than now. The scheme adds 991 homes in Phase 1 alone, 200 of them affordable, to the heart of the city.
A large new central population tends to support demand for nearby rental stock and local services over time. The fact that demolition is under way and £110 million of West Midlands Combined Authority funding is committed gives the scheme more credibility than a planning-stage proposal, but anyone pricing it in today is looking at a multi-year horizon.
What are average house prices in Coventry?
The average sold price in Coventry is £219,765 on the Land Registry index, about 24.2% below the England average of £289,946 as of March 2026. Asking prices by postcode run from £163,893 in CV1 (City Centre) up to £437,918 in CV8 on the Kenilworth fringe, with a city-wide mean of £293,448. By type, detached homes average £399,146, semi-detached £258,694, terraced £203,986 and flats £125,361.
Through a buy-to-let lens, CV1 is the cheapest entry and the highest-yielding at 6.9%, while CV8 is the dearest and lowest-yielding at 3.1%.
What type of property is most common in Coventry?
It varies sharply by postcode. Across the city as a whole, semi-detached and terraced houses make up the bulk of the stock, but the central CV1 postcode is unusual: 37.4% of its homes are flats and 37.8% terraces, the smaller-unit stock that suits buy-to-let. CV6 has the highest terraced share at 40.8%.
At the outer edge the picture flips. CV8 is 46.4% detached and CV7 43.9%, both with flats down under 8%, which is why those postcodes price higher and yield less. So if you are after the affordable, higher-yield stock, the flats and terraces of CV1, CV2 and CV6 are where it concentrates.
How do I buy an investment property in Coventry?
Decide first whether you are buying for income or for growth, because in Coventry the two point you to different postcodes. CV1 (City Centre) is the cheapest entry at £163,893 and the top yield at 6.9%, while CV2 (Walsgrave, Wyken) pairs a 5.4% yield with the strongest five-year growth at 23.1%. Plan for a 30% deposit, which runs from £49,168 in CV1 up to £131,375 in CV8.
Beyond what is listed openly, many investors buy below asking through off-market properties and below market value property. To see what is available now, browse investment property for sale in coventry or buy-to-let homes for sale.
Ready to buy property?
Browse investment properties with prices and gross yields shown for each opportunity.
Get property alerts