City of Westminster Property Investment: Best Buy-to-Let Areas
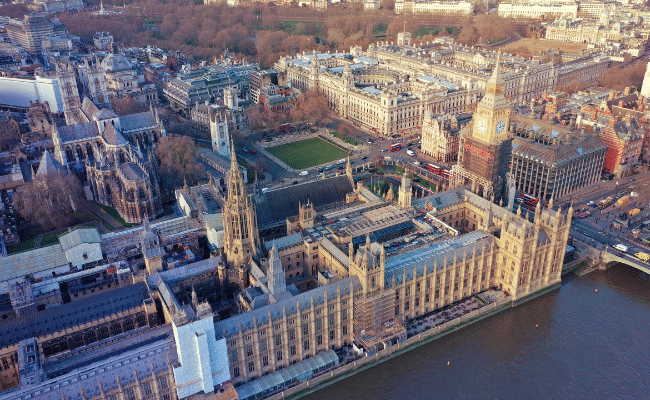
Royal palaces, the heart of democracy and London's premium addresses. Westminster embodies power, prestige, and centuries of British heritage like nowhere else on earth. This is where monarchs are crowned at Westminster Abbey, where Parliament shapes the nation's future, and where the world's most coveted postcodes command respect from Mayfair to Belgravia.
Every corner tells a story of influence and grandeur. Buckingham Palace sits majestically beside Hyde Park's rolling lawns, while the cobbled streets of Covent Garden buzz with the energy that has drawn visitors for generations. Walk these pavements and you're treading the same ground as Churchill, Dickens, and countless figures who've shaped history.
The City of Westminster isn't known as the go-to place in London for high rental yields, yet it's not about that. For investors with substantial resources seeking the ultimate in global recognition, Westminster offers something truly extraordinary: addresses that open doors worldwide, properties that represent not just assets but status and enduring legacy.
Article updated: September 2025
City of Westminster Buy-to-Let Market Overview 2025
Westminster's property market operates at the pinnacle of London's luxury segment, requiring substantial capital and long-term vision rather than traditional buy-to-let fundamentals. The borough serves international and generational wealth preservation over income generation, with NW8 (St Johns Wood) delivering the highest yields at 5.0% while W9 (Maida Vale) provides the most accessible entry point at £800,766 average price.
- Asking price range: £800,766 (W9) to £2,137,004 (W1)
- Rental yields: 2.5% (W1) to 5.0% (NW8) across Westminster postcodes
- Rental income: Weekly rents from £629 to £1,256 (monthly: £2,726 to £5,441)
- Price per sq ft: Premium positioning from £961/sq ft to £1,777/sq ft
- Market activity: Sales ranging from 5 per month (WC2) to 28 per month (W9)
Contents

-
by Robert Jones, Founder of Property Investments UK
With two decades in UK property, Rob has been investing in buy-to-let since 2005, and uses property data to develop tools for property market analysis.
Property Data Sources
Our location guide relies on diverse, authoritative datasets including:
- HM Land Registry UK House Price Index
- Ministry of Housing, Communities and Local Government
- Government Planning and Housing Data
- Propertydata.co.uk
We update our property data quarterly to ensure accuracy. Last update: September 2025. All data is presented as provided by our sources without adjustments or amendments.
Why Invest in the City of Westminster?
Westminster represents the pinnacle of London property investment, offering global recognition and prestige that no other UK location can match. With average sold house prices 84.4% above the London average, Westminster attracts serious investors seeking the ultimate in capital preservation and international status.
When we look at typical buy-to-let fundamentals, Westminster operates by different rules entirely. Traditional metrics like population growth and local employment matter less here than global wealth flows and international demand.
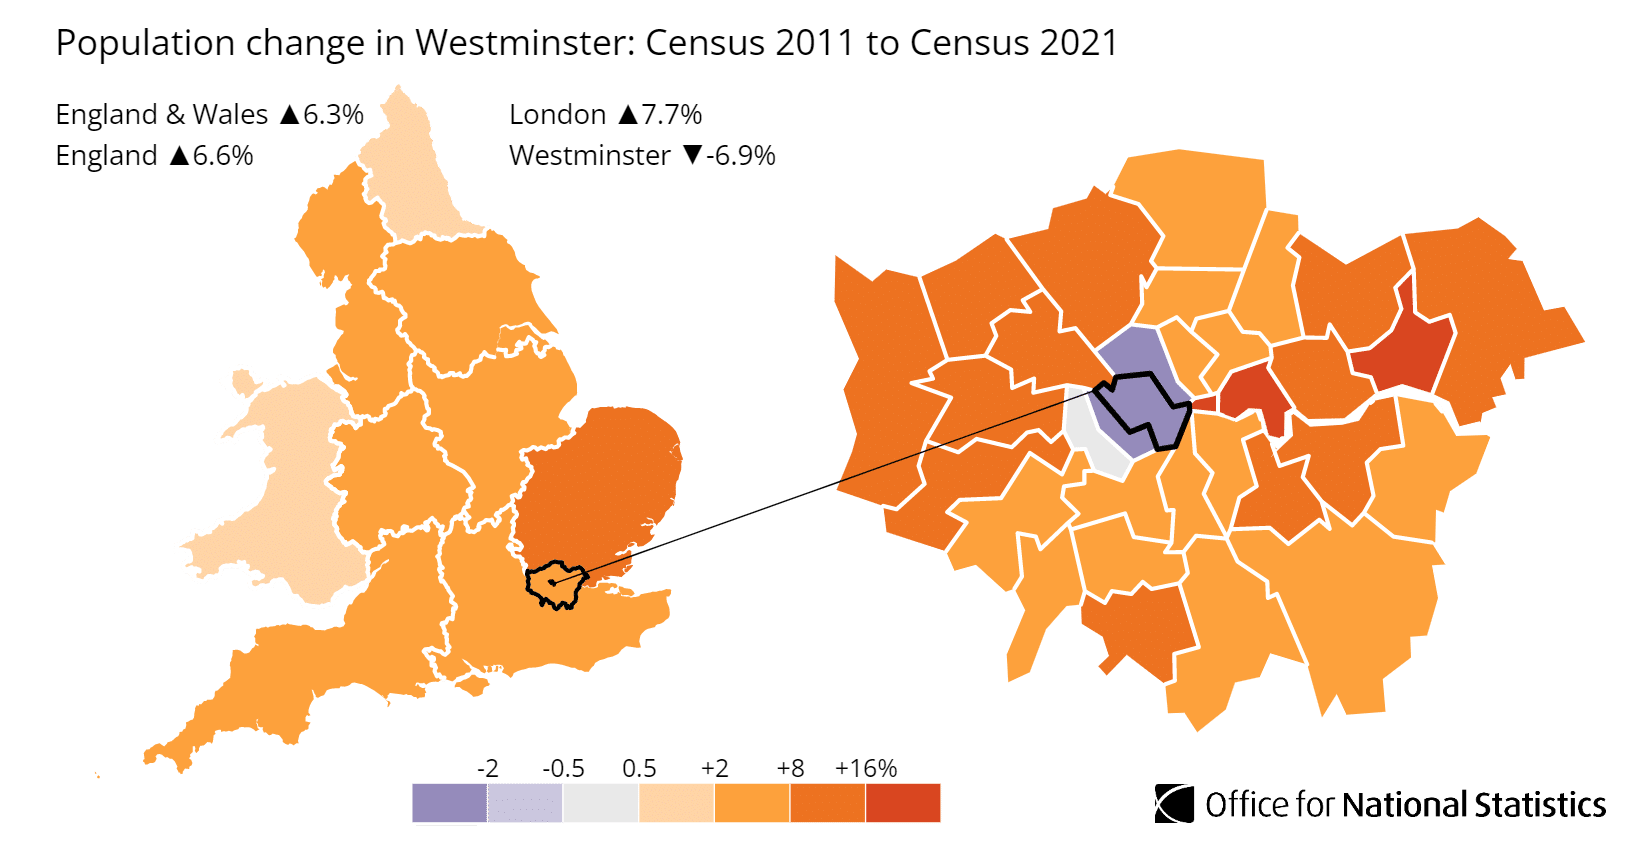
This shows in the population data, with the Westminster population reducing in between the Government Census, as shown in the Greater London population data.
The total population of Westminster was 204,200 (as of the 2021 UK government census) and its population has decreased by 6.9%, declining from 219,400 in 2011.
There are likely many reasons for this, affordability being just one. With high network investors having their pick of locations to live, some may have moved to nearby Kensington and Chelsea in West London, chosen to live overseas, or even moved to a more rural London commuter town.
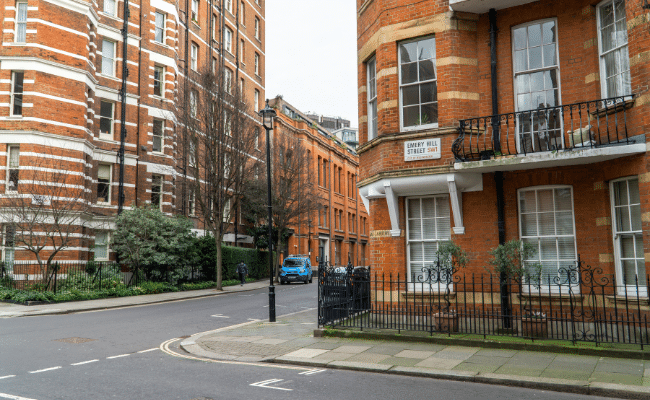
Westminster carries significant prestige and includes world-famous areas such as Mayfair, Belgravia, Marylebone, Covent Garden, Soho, and St. James's, postal addresses that carry global recognition.
The borough is primarily covered by the postcodes: NW8, SW1, W1, W2, W9, WC1, and WC2.
With additional postcodes that cross Westminster and other Central London boroughs including:
- W11 (Notting Hill) crosses Westminster and Kensington & Chelsea
- SW7 (South Kensington) crosses Westminster and Kensington & Chelsea
- N1 (King's Cross) crosses Westminster and Camden
- EC1 (Clerkenwell) crosses Westminster and Camden
What makes Westminster special isn't steady rental yields or growing local populations - it's the unmatched global prestige that attracts international wealth. Royal palaces, Parliament, luxury shopping, and centuries of history create investment appeal that transcends typical property fundamentals.
City of Westminster Property Market Analysis
When Was the Last House Price Crash in the City of Westminster?
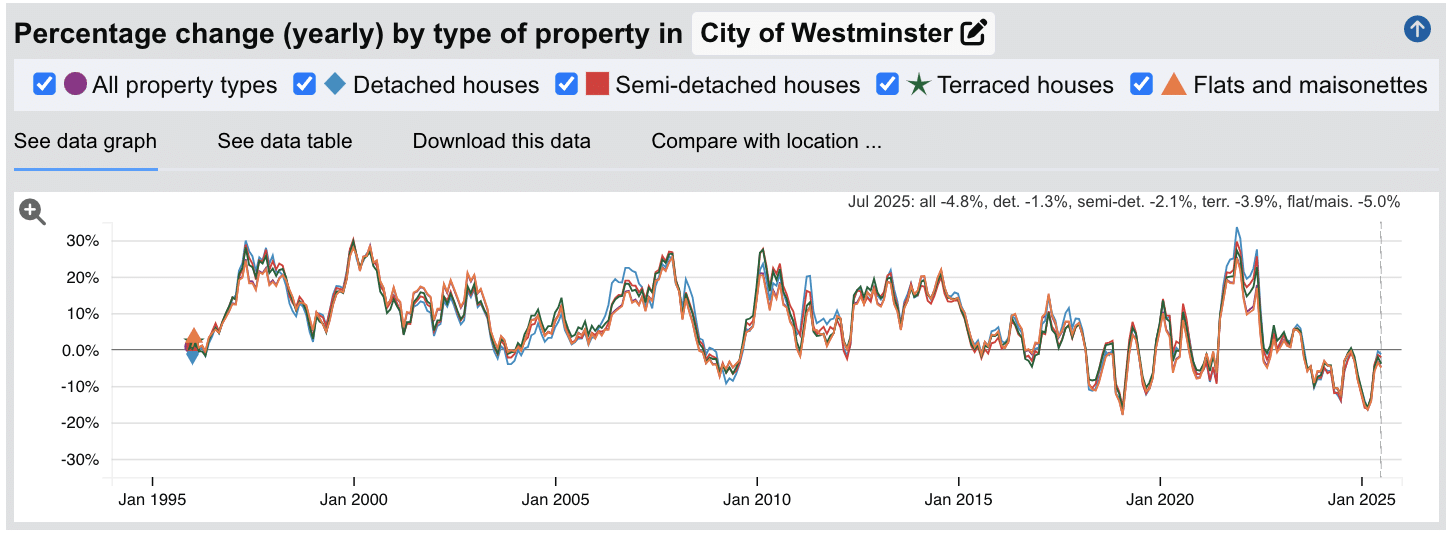
The most recent significant property price crash in Westminster continues, with annual sold house price declines reaching -4.8% by July 2025. The current correction began around 2022, with different property types showing varying degrees of decline. Previous major corrections occurred in 2018-2019 and during the global financial crisis of 2008-2009.
(please note: due to the high prices of properties in Westminster, data can easily swing in percentages if sales transaction volume is low and individual high value trophy assets are sold one year and not the next)
Source: HM Land Registry House Price Index for City of Westminster
Looking at the property data across all types:
- 1996-2000: Explosive growth building from modest beginnings to spectacular annual peaks of 28.5% in June 2000.
- 2000-2003: Continued strong annual growth, maintaining the 28.5% peak from 2000 before gradually moderating through 2003.
- 2003-2004: Brief correction with annual declines reaching -0.8% in late 2003, showing early market vulnerability.
- 2004-2008: Recovery and renewed growth, culminating in 25.4% annual growth by December 2007.
- 2008-2009: Financial crisis impact was relatively modest compared to other areas, with the worst annual decline at -7.3% in February 2009.
- 2010-2017: Strong recovery period with sustained growth, reaching another boom phase by 2017.
- 2018-2019: Severe correction with annual declines reaching -17.9% in February 2019, showing Brexit and luxury market pressures.
- 2020-2022: Pandemic recovery surge, reaching 25.4% annual growth in December 2021.
- 2022-2025: Current ongoing correction, with annual declines continuing through 2025. By July 2025, all property types were down -4.8% annually, with flats and maisonettes showing the steepest decline at -5.0%.
Westminster's luxury market shows extreme sensitivity to economic and political uncertainty. The current correction represents a more measured decline compared to the sharp 2018-2019 Brexit-related crash, but demonstrates the continued volatility in the international luxury property market.
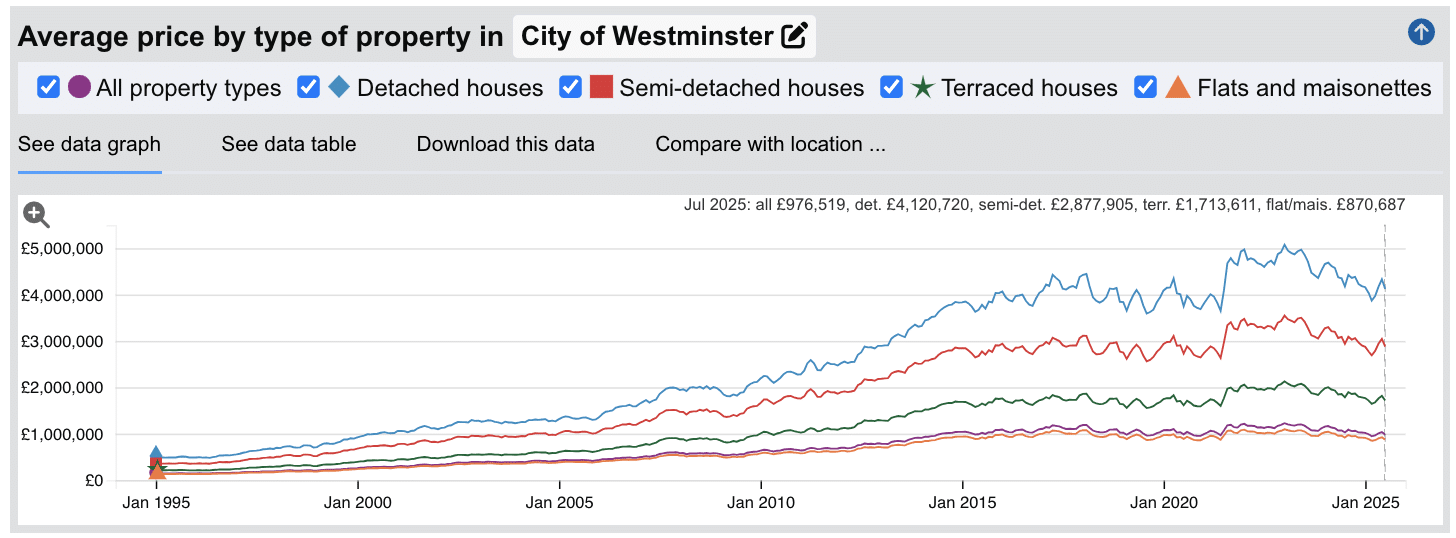
The long-term story remains remarkable despite recent volatility. Properties that cost an average of £141,417 in 1995 are now worth £976,519. That's 6.9 times the original value over 30 years. While Westminster's luxury market experiences dramatic swings, it has delivered substantial wealth creation for those with the capital and patience to ride out the considerable ups and downs.
House Prices in the City of Westminster: Sold (£)
The latest sold house price index by the Land Registry, shows the following average 'sold' house prices across the London Borough of Westminster.
While detached houses in Westminster command extraordinary premiums at 274.1% above the London average, semi-detached houses sit at an even more eye watering 330.5% above typical London prices.
Terraced houses in Westminster represent substantial premiums at 186.2% above London averages, while flats and maisonettes show the smallest (but still significant) premium at 107.9% above typical London prices.
For investors considering Westminster, it is likely their investment property checklist is out of the window and criteria like rental yields simply isn't a deciding factor.
With average detached houses selling at £4,352,503, these properties target ultra-high-net-worth individuals rather than typical UK buyers or investors.
For those considering Westminster investment, the apartment market at £922,296 offers the most accessible entry point. Yet this represents more than most investors would spend on entire portfolios elsewhere. When you combine this with Westminster's low yields, it becomes clear why this market serves capital preservation and prestige rather than cashflow or income generation. There will be some investors, having already benefitted from significant capital growth may now be looking to retire and considering to sell their property portfolio, however this will require a specialist buyer for this specialist high networth property market.
Updated September 2025
| Property Type | Westminster Average Price | London Average | Difference |
|---|---|---|---|
| Detached houses | £4,352,503 | £1,163,469 | +274.1% |
| Semi-detached houses | £3,093,412 | £718,637 | +330.5% |
| Terraced houses | £1,826,552 | £638,278 | +186.2% |
| Flats and maisonettes | £922,296 | £443,692 | +107.9% |
| All property types | £1,035,323 | £561,309 | +84.4% |
Property Data Sources
Our location guide relies on diverse, authoritative datasets including:
- HM Land Registry UK House Price Index
- Ministry of Housing, Communities and Local Government
- Government Planning and Housing Data
- Propertydata.co.uk
We update our property data quarterly to ensure accuracy. Last update: September 2025. All data is presented as provided by our sources without adjustments or amendments.
House Prices in City of Westminster: For Sale Asking Prices (£)
Updated September 2025
The data represents the average asking prices of properties currently listed for sale in Westminster.
| Rank | Area | Average House Price |
|---|---|---|
| 1 | W1 (Mayfair) | £2,137,004 |
| 2 | SW1 (Westminster) | £1,622,358 |
| 3 | WC2 (Covent Garden) | £1,520,555 |
| 4 | NW8 (St Johns Wood) | £1,302,875 |
| 5 | W2 (Bayswater) | £1,064,038 |
| 6 | WC1 (Bloomsbury) | £838,908 |
| 7 | W9 (Maida Vale) | £800,766 |
W1 (Mayfair) leads at over £2.1 million average, while even W9 (Maida Vale) at £800,766 represents serious money by any standard. The £1.3 million gap between the most and least expensive areas shows the dramatic range within the borough of Westminster itself. For property investors, these figures highlight why Westminster operates as a specialist market, often adrift of typical local and national property market fundamentals.
Sold Price Per Square Foot in City of Westminster (£)
Updated September 2025
The data represents the average sold price per square foot of properties actually sold in Westminster over the past 18 months.
| Rank | Area | Price Per Square Foot |
|---|---|---|
| 1 | W1 (Mayfair) | £1,777 |
| 2 | WC2 (Covent Garden) | £1,596 |
| 3 | SW1 (Westminster) | £1,391 |
| 4 | W2 (Bayswater) | £1,225 |
| 5 | WC1 (Bloomsbury) | £1,186 |
| 6 | NW8 (St Johns Wood) | £1,152 |
| 7 | W9 (Maida Vale) | £961 |
These numbers reveal Westminster's luxury property landscape. By far the most expensive addresses in the UK, W1 (Mayfair) commands an extraordinary £1,777 per square foot, reflecting its global status as one of the world's most exclusive postcodes and street addresses. Westminster postcodes feature prominently in London's record-breaking property sales, including several from the top 10 most expensive house in london, with transactions reaching over £100 million in areas like Knightsbridge and Grosvenor Square. What's fascinating is how even Westminster's most accessible area, W9 (Maida Vale) is a staggering £961 per square foot, which exceeds almost all other premium locations in any of the London boroughs. The £816 difference between W1 and W9 represents more than just location, it's the premium for worldwide recognition versus local prestige. For investors, areas like WC1 (Bloomsbury) and NW8 (St Johns Wood) around £1,152-£1,186 per square foot offer the sweet spot of Westminster addresses without the absolute premium of Mayfair or Covent Garden. These figures remind us that in Westminster, you're not just buying property, you're buying into centuries of history and global recognition.
House Price Growth in City of Westminster (%)
Updated September 2025
The data represents the average house price growth over the past five years, calculated using a blended rolling annual comparison of both sold prices and asking prices.
| Rank | Area | 5 Year Growth |
|---|---|---|
| 1 | W9 (Maida Vale) | 7.0% |
| 2 | NW8 (St Johns Wood) | -3.8% |
| 3 | WC1 (Bloomsbury) | -7.7% |
| 4 | W1 (Mayfair) | -12.7% |
| 5 | W2 (Bayswater) | -13.2% |
| 6 | SW1 (Westminster) | -25.0% |
| 7 | WC2 (Covent Garden) | -32.0% |
Westminster's five-year growth figures tell a sobering story about London's premium property market. Only W9 (Maida Vale) shows positive growth at 7.0%, highlighting why this area offers the most balanced investment proposition in Westminster. The rest of the borough has experienced significant corrections, with WC2 (Covent Garden) seeing the steepest decline at -32.0% and SW1 (Westminster) down -25.0%. NW8 (St Johns Wood) shows the most resilient performance among the declining areas at -3.8%. Remember however, the low volume of transactions will significantly skew the figures, asset prices in these areas are significant, and one or two sales can make a massive impact to the 'average' growth figures. Yet the data does show that buyers are considering price again as a key factor when buying in London's luxury segment. Trophy assets will always sell, but in a market where property prices are stagnant, buyers will still try and get the best price across the borough.
Average Monthly Property Sales in City of Westminster
Updated September 2025
The data represents the average number of residential property sales per month across Westminster's postcode districts, based on transactions recorded over the past 3 months.
| Rank | Area | Average Monthly Sales |
|---|---|---|
| 1 | SW1 (Westminster) | 35 |
| 2 | W9 (Maida Vale) | 28 |
| 3 | W2 (Bayswater) | 23 |
| 4 | W1 (Mayfair) | 15 |
| 5 | NW8 (St Johns Wood) | 14 |
| 6 | WC1 (Bloomsbury) | 11 |
| 7 | WC2 (Covent Garden) | 5 |
Westminster's sales figures reflect a more selective market where buyers take time to find the right property. SW1 (Westminster) leads with 35 sales monthly, more than one property changing hands daily in the political heart of London. W9 (Maida Vale) shows strong activity with 28 sales, while W2 (Bayswater) maintains steady demand with 23 sales respectively, suggesting these areas offer the right balance of prestige and active buyer demand. The ultra-premium areas tell a different story - WC2 (Covent Garden) sees a recent average of just 5 sales monthly, while W1 (Mayfair) and NW8 (St Johns Wood) remain selective with 15 and 14 sales. This isn't necessarily weakness; these areas are the top of the market and only a select number of Ultra High Networth buyers are active at any given time, so the limited buyer pool naturally translates to smaller transaction volumes when compared with nearby London Boroughs. Remember that these figures represent the entire market, including different property types and price points, so individual segments may experience faster or slower sales rates.
Planning Applications in City of Westminster
Updated September 2025
The data represents the average number of planning applications submitted per month in each postcode district, along with the percentage of applications that receive approval.
| Rank | Area | Monthly Applications | Success Rate |
|---|---|---|---|
| 1 | W1 (Mayfair) | 241 | 91% |
| 2 | SW1 (Westminster) | 200 | 93% |
| 3 | W2 (Bayswater) | 107 | 87% |
| 4 | WC2 (Covent Garden) | 83 | 91% |
| 5 | W9 (Maida Vale) | 45 | 86% |
| 6 | NW8 (St Johns Wood) | 14 | 82% |
| 7 | WC1 (Bloomsbury) | 11 | 86% |
W1 (Mayfair) leads Westminster's planning activity with 241 applications monthly, this is a really positive sign reflecting the constant renovation and development in London's most exclusive district. SW1 (Westminster) follows with a considerable 200 monthly applications and maintains an impressive 93% success rate. What stands out is Westminster Council's consistently high approval rates, ranging from 82% to 93% across all postcodes. This suggests a planning authority that understands the value of maintaining and improving the borough's prestigious building stock while preserving its heritage character.
Property Data Sources
Our location guide relies on diverse, authoritative datasets including:
- HM Land Registry UK House Price Index
- Ministry of Housing, Communities and Local Government
- Government Planning and Housing Data
- Propertydata.co.uk
We update our property data quarterly to ensure accuracy. Last update: September 2025. All data is presented as provided by our sources without adjustments or amendments.
City of Westminster Rental Market Analysis
For those first-time buyers buying their first rental property, and thinking how much they can charge for rent across the London borough of the City of Westminster.
The rental data below gives you an indication on the rental income per month and the rental yields landlords can aim to achieve for traditional assured shorthold tenants.
Note: The high asset costs and low rental yields mean Westminster is unlikely to be a location of choice for many buy-to-let landlords growing a residential property portfolio.
Rental Prices in City of Westminster (£)
Updated September 2025
The data represents the average monthly rent for long-let AST properties in the City of Westminster. These figures reflect rents across all property types and do not account for differences in property size, number of bedrooms, or short-term lets.
| Rank | Area | Average Weekly Rent | Average Monthly Rent |
|---|---|---|---|
| 1 | NW8 (St Johns Wood) | £1,256 | £5,441 |
| 2 | W1 (Mayfair) | £1,021 | £4,423 |
| 3 | W2 (Bayswater) | £992 | £4,297 |
| 4 | SW1 (Westminster) | £985 | £4,266 |
| 5 | WC2 (Covent Garden) | £877 | £3,799 |
| 6 | WC1 (Bloomsbury) | £698 | £3,026 |
| 7 | W9 (Maida Vale) | £629 | £2,726 |
Westminster's rental market reflects the borough's luxury housing status across every postcode. NW8 (St Johns Wood) commands the highest rents at £1,256 weekly, where tree-lined avenues and Victorian grandeur attract high-earning professionals and international tenants. W1 (Mayfair) follows at £1,021 weekly, reflecting its position as one of the world's most exclusive addresses. The striking difference here is scale, even Westminster's most accessible area, W9 (Maida Vale) at £629 weekly, still exceeds most London boroughs' premium areas. What this creates is a rental market primarily serving corporate relocations, short-term international professionals, and shared accommodation arrangements rather than traditional local tenants. Traditional long-term tenants and families have been priced out of the area long ago. There are certainly some ultra high networth London investors, that like to own many international assets, who are choosing premium locations to live in part of the year and then rent out as short term stays for the rest of the year to give them a high value asset with flexibility, so have specifically looked for airbnb for sale in this borough. For traditional tenants, W2 (Bayswater) and WC1 (Bloomsbury) offer relatively better value within Westminster's context, though rents remain substantial. These figures represent average rents across all property types, from studio apartments to luxury penthouses, and actual achievable rents can vary significantly based on property size, condition, and specific location within each postcode.
Gross Rental Yields in City of Westminster (%)
Updated September 2025
The data represents the average gross rental yields across different postcode districts in the City of Westminster, calculated using a snapshot of current properties for sale and properties for rent. These figures are based on asking prices.
| Rank | Area | Gross Rental Yield |
|---|---|---|
| 1 | NW8 (St Johns Wood) | 5.0% |
| 2 | W2 (Bayswater) | 4.8% |
| 3 | WC1 (Bloomsbury) | 4.3% |
| 4 | W9 (Maida Vale) | 4.1% |
| 5 | SW1 (Westminster) | 3.2% |
| 6 | WC2 (Covent Garden) | 3.0% |
| 7 | W1 (Mayfair) | 2.5% |
Westminster's yields reflect its premium positioning in the London market. NW8 (St Johns Wood) leads with 5.0%, while W2 (Bayswater) delivers 4.8% - both offering the strongest returns in this prestigious borough. What's notable is that WC1 (Bloomsbury) at 4.3% and W9 (Maida Vale) at 4.1% still provide decent yields for such exclusive locations. The central districts of SW1, WC2, and W1 deliver significantly lower yields of 2.5-3.2% due to the exceptionally high house prices. To understand what is a good rental yield, these Westminster figures would be considered low by typical buy-to-let standards, making this unlikely to be a location for any buy-to-let landlord and instead remain as premium addresses for corporate owners, homeowners with significant equity and international investors that aren't put off by low yields and are instead aiming for long term ownership and growth with premium addresses. Interestingly, in the past 12 months rental yields have increased in the area, as rents have gone up and asset prices have stayed static or dropped slightly for some property types and Westminster postcodes. Remember that these figures represent gross rental yields before accounting for costs such as maintenance, void periods, and management fees.
Access our selection of exclusive, high-yielding, residential investment property deals and a personal consultant to guide you through your options.
Is City of Westminster Rent High?
Yes, Westminster's rental costs create extraordinary financial pressure for local residents, despite the borough's higher-than-average earnings.
Average rent in Westminster consumes between 45.63% to 91.08% of local earnings based on the borough's mean annual income of £71,684. Staggering.
The pressure is most extreme in NW8 (St Johns Wood) where rents reach £1,256 per week. For a household relying on one local income, tenants need to dedicate 91.08% of their earnings to rent alone - making it extremely challenging even for high earners.
W1 (Mayfair) and W2 (Bayswater) present similar challenges, with rental costs consuming 74.04% and 71.93% of mean income respectively. These levels put genuine strain on even well-paid professionals and people living here are likely earning way in excess of average earnings and/or come from generational wealth where housing budgets are no issue.
Even Westminster's most accessible areas remain financially demanding. W9 (Maida Vale) at 45.63% of income represents the borough's most manageable option, yet still requires nearly half of local earnings just for housing.
Here's what residents face across Westminster for rental costs as a percentage of incomes:
- NW8 (St Johns Wood) - 91.08% of local income
- W1 (Mayfair) - 74.04% of local income
- W2 (Bayswater) - 71.93% of local income
- SW1 (Westminster) - 71.41% of local income
- WC2 (Covent Garden) - 63.60% of local income
- WC1 (Bloomsbury) - 50.66% of local income
- W9 (Maida Vale) - 45.63% of local income
This reveals Westminster's true housing reality. It is an ultra luxury market and only high net work individuals live here or invest here.
Buy-to-Let Considerations
Are the City of Westminster House Prices High?
Yes, Westminster represents London's premium property market with prices significantly above both UK and London averages, reflecting its status as the capital's most prestigious address.
The borough's average 'sold' property price of £1,035,323 sits substantially above UK and London averages. This positions Westminster firmly in London's luxury tier, attracting investors seeking prestige locations with global recognition.
Average asking prices across Westminster postcodes range from the most expensive W1 (Mayfair) at £2,137,004 to the most accessible W9 (Maida Vale) at £800,766.
Looking at property types, Westminster's premium extends across all categories yet shows interesting variation.
Westminster shows detached homes averaging £4,352,503, semi-detached houses at £3,093,412, terraced properties at £1,826,552, and flats at £922,296.
These premium prices reflect Westminster's unique position as home to Parliament, Buckingham Palace, and world-class shopping districts, attracting international investors and high-net-worth residents.
Median annual earnings in Westminster are £48,011 (with 3.2% annual growth).
Mean annual earnings in Westminster are £71,684 (with 9.4% annual increase).
Despite Westminster's high property prices, local earnings are significantly above UK averages, reflecting the concentration of financial services, government, and professional sectors.
Salary to house price ratios
To afford an average priced house in Westminster, residents' affordability ratios are:
- W1 (Mayfair) - 29.8 times mean annual salary
- WC2 (Covent Garden) - 21.2 times mean annual salary
- SW1 (Westminster) - 22.6 times mean annual salary
- NW8 (St. Johns Wood) - 18.2 times mean annual salary
- W2 (Bayswater) - 14.8 times mean annual salary
- WC1 (Bloomsbury) - 11.7 times mean annual salary
- W9 (Maida Vale) - 11.2 times mean annual salary
For local buyers on mean earnings, even Westminster's most accessible area, W9 (including Maida Vale), requires 11.2 times annual salary. This compares to London's overall challenging affordability ratios.
This reveals Westminster's true market position: while local earnings are higher than most London boroughs, the premium property prices create affordability ratios that exceed even London's challenging norms. Westminster remains primarily an investment and international buyer market rather than a local residential choice.
How Much Deposit to Buy a House in the City of Westminster?
Assuming a 30% deposit for buy-to-let investments, here's an overview of deposit requirements across different City of Westminster postcodes and areas like Maida Vale, St. Johns Wood, Mayfair and Bloomsbury:
North Westminster
- NW8 (including St. Johns Wood): Investors considering properties in this prestigious area (typical value £1,302,875) would need to have a 30% deposit of £390,863 available.
- W9 (including Maida Vale): Properties in this canal-side location require a 30% down payment of £240,230 based on property values of £800,766.
Central Westminster
- W1 (including Mayfair): Purchasing in this world-renowned location requires a 30% down payment of £641,101 based on average property values of £2,137,004.
- W2 (including Bayswater): Property buyers looking to purchase in Bayswater need to allocate £319,211 for a 30% deposit on home prices averaging £1,064,038.
- WC1 (including Bloomsbury): Investors looking at Bloomsbury and WC1 addresses should be prepared to have a 30% deposit of £251,672 for properties with average prices of £838,908.
South Westminster
- SW1 (including Westminster): Buy-to-let landlords buying a property in Westminster's political heart should budget for a 30% deposit of £486,707 on properties typically priced around £1,622,358.
- WC2 (including Covent Garden): This popular entertainment district requires a 30% deposit of £456,166 on properties typically valued at £1,520,555.
If you're new to property, or just starting out in a property training course, W9 (including Maida Vale) offers the most accessible entry price point with the lowest deposit requirements across the City of Westminster. Rental yields are 4.1%, and it provides a balanced option for investors seeking their first Westminster property with both reasonable entry costs and decent returns for the borough.
How to Invest in Buy-to-Let in the City of Westminster
For properties to buy in the City of Westminster, including:
- Finding off-market properties
- Buy-to-lets
- Buying a Holiday let or investing in serviced accommodation
- HMOs (houses of multiple occupation)
- PBSA (purpose-built student accommodation)
- and other high-yielding opportunities
We have partnered with the best property investment agents we can find for 8+ years.
Here you can get access to the latest investment property opportunities from our network.
For more information about specific areas:
- If you're interested in the highest rental returns in Westminster, consider NW8 (St Johns Wood) with yields of 5.0% and W2 (Bayswater) at 4.8%, both offering even stronger rental returns than other parts of London.
- For an alternative look at the local London housing market, with affordable entry prices, check out our guide to the cheapest areas to live in London.
- For different opportunities further afield, without the price tag but with a historic feel, consider exploring buy-to-let in Surrey or buy-to-let in Oxford.
