Where to Buy Property Investments in Oldham: Yields of 5.1%
Gross rental yields in Oldham reach 5.1% in OL7 (Ashton-under-Lyne) and OL9 (Chadderton, Westwood), with average sold prices sitting 26.9% below the England average. The borough's population grew 7.6% between the 2011 and 2021 censuses, reaching 242,088 residents, and the median annual salary stands at £34,042.
Oldham's average sold price of £213,245 (December 2025) places it £78,620 below England's £291,865 and broadly level with the North West regional average of £217,428. That pricing gap translates to 30% deposits starting from £65,690 in OL1 (Town Centre, Chadderton). This guide analyses 11 postcodes covering the full borough, from M24 (Middleton) and M35 (Failsworth) in the south to OL3 (Saddleworth, Uppermill) in the east and SK15 (Stalybridge) to the south-east.
Oldham is a metropolitan borough in Greater Manchester, identified by ONS code E08000004. It borders Rochdale to the north, Tameside to the south, and Manchester to the west. Several postcodes overlap neighbouring boroughs. M24 and M35 are shared with Rochdale and Manchester respectively, OL7 falls primarily within Tameside, and SK15 sits on the Tameside border. All are included in this guide because PropertyData assigns them to the Oldham postcode set. For more on North West investment locations, see our regional guides.
Article updated: March 2026
Oldham Buy-to-Let Market Overview 2026
Oldham offers entry-level pricing within Greater Manchester, with sold prices 26.9% below the England average and gross yields reaching 5.1% in two postcodes.
- Average sold price: £213,245 (26.9% below England's £291,865)
- Asking price range: £218,967 (OL1) to £440,530 (OL3) across 11 postcodes
- Rental yields: 3.3% (OL3) to 5.1% (OL7, OL9) across 7 postcodes with rental data
- Rental income: Monthly rents from £911 (OL2) to £1,198 (OL3)
- Price per sq ft: House prices from £205/sq ft (OL8) to £327/sq ft (OL3)
- Market activity: Sales ranging from 8 per month (OL7) to 40 per month (M24)
- Deposit requirements: 30% deposits range from £65,690 (OL1) to £132,159 (OL3)
- Affordability ratios: Property prices from 6.4 to 12.9 times Oldham's median annual salary of £34,042
Contents

-
by Robert Jones, Founder of Property Investments UK
With two decades in UK property, Rob has been investing in buy-to-let since 2005, and uses property data to develop tools for property market analysis.

Property Data Sources
Our location guide relies on diverse, authoritative datasets including:
- HM Land Registry UK House Price Index
- Ministry of Housing, Communities and Local Government
- Ordnance Survey Data Hub
- Propertydata.co.uk
We update our property data quarterly to ensure accuracy. Last update: March 2026. All data is presented as provided by our sources without adjustments or amendments.
Why Invest in Oldham?
Oldham's population reached 242,088 in the 2021 Census, a 7.6% increase from 224,897 in 2011. That growth rate is ahead of England's 6.6% average and reflects the borough's expanding housing demand. Oldham sits within the Greater Manchester city-region, connected to Manchester city centre by Metrolink tram, road, and rail.
The median gross annual salary for Oldham residents is £34,042, equivalent to £654.70 per week. This is below the North West regional median of £720.10 per week and the Great Britain median of £752.40 per week. The employment rate is 64.4%, which is below both the North West (73.5%) and Great Britain (75.4%) averages. The unemployment rate is suppressed for Oldham due to small sample sizes in the Annual Population Survey.
Oldham's economy is anchored by manufacturing, health and social care, retail, and education. The borough's proximity to Manchester city centre creates a commuter belt dynamic. Residents earning Manchester wages but paying Oldham prices is a pattern that supports both rental demand and long-term capital growth.
Oldham Economic Summary
- Population: 242,088 (2021 Census). Growth of 7.6% from 2011.
- Median annual salary: £34,042 (local), £37,445 (North West), £39,125 (Great Britain)
- Employment rate: 64.4% (local), 73.5% (North West), 75.4% (Great Britain)
- Unemployment rate: Not available (sample size too small), 4.3% (North West), 4.0% (Great Britain)
- Key employment sectors: Manufacturing, health and social care, retail, education
Source: ONS Census 2021, Nomis Labour Market Profile (ASHE 2025, Employment Oct 2024-Sep 2025)
Regeneration and Investment in Oldham
More than £100 million in committed investment is reshaping Oldham's town centre and eastern fringe. Three projects backed by Greater Manchester Combined Authority funding and private sector capital are creating new homes, sports facilities, and cultural amenity.
- Oldham Town Centre Living (Under construction, part of £31.5m GMCA Good Growth Fund): A 15-year programme to create thousands of new homes in the town centre, led by the Princes Gate development delivering 331 homes plus a separate 120-apartment building replacing the former Riley's Snooker parlour. GMCA institutional funding gives this programme delivery confidence that speculative schemes lack. Updates at Oldham Council.
- SportsTown (Planning, £70 million): A multi-discipline sports and community complex developed with Oldham Athletic and Oldham RLFC, creating a new sporting quarter with modern facilities and a potential 3,000-seat arena. Eastern Oldham postcodes closest to the development stand to benefit from matchday and event-driven demand. Updates at The Oldham Times.
- Spindles Transformation and Coliseum Theatre (Under construction, opening 2026): The Spindles shopping centre is being converted into a new indoor market hall and entertainment space, while the historic Coliseum Theatre is being restored. Both projects completing in 2026 create cultural anchors that drive footfall and support adjacent residential values. Updates at The Oldham Times.

Oldham Property Market Analysis
When was the last house price crash in Oldham?
Oldham is a metropolitan borough in Greater Manchester, so all sold property prices from HM Land Registry are available at the local authority level. The data covers January 1995 to December 2025.
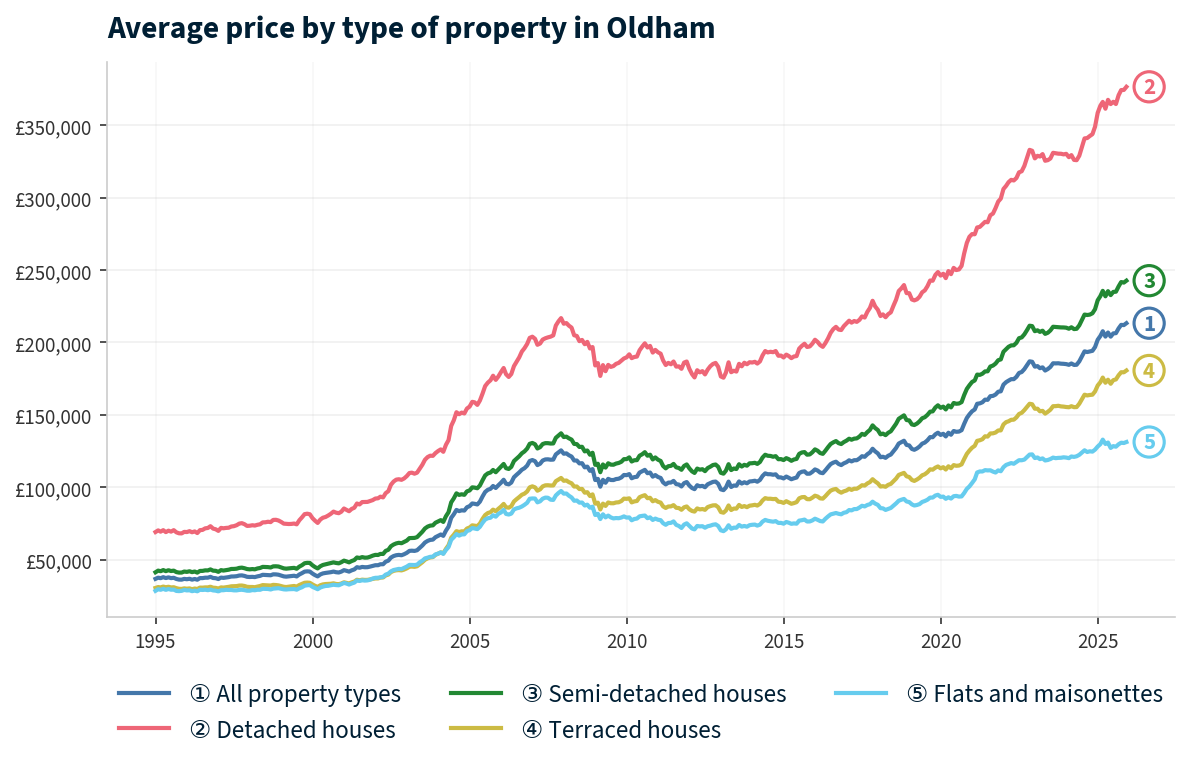
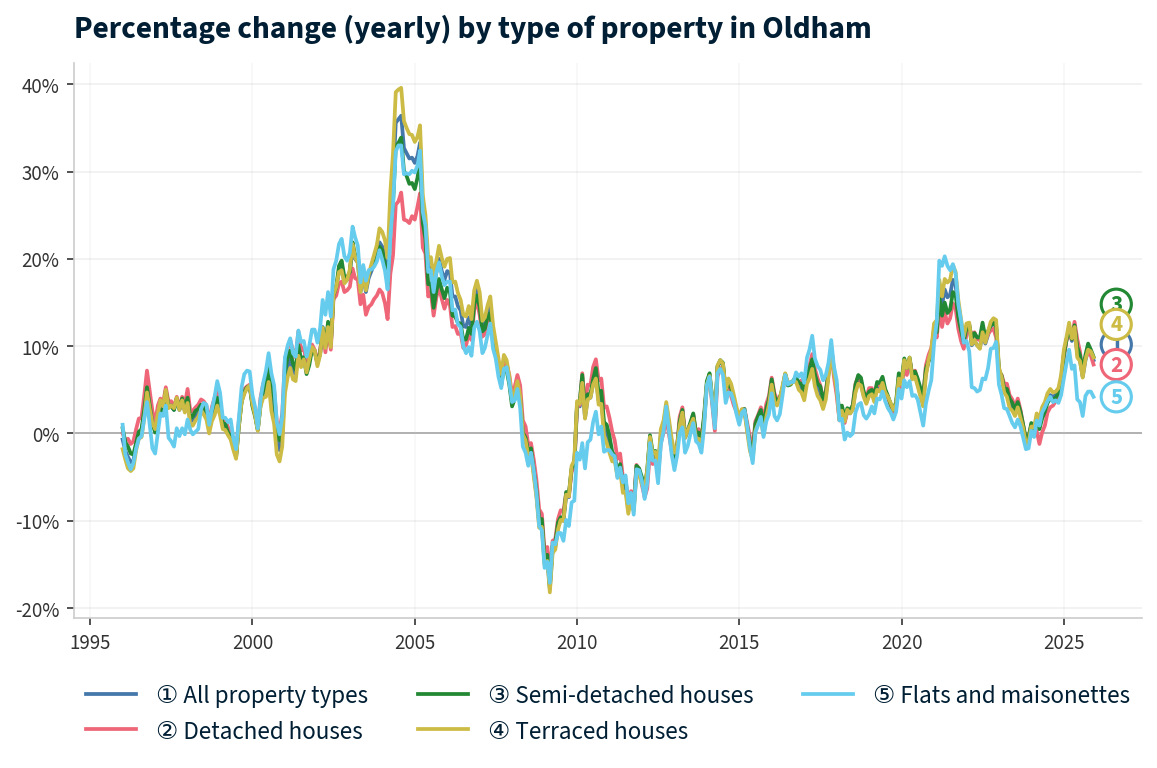
Oldham's average property price has grown from £36,706 in January 1995 to £213,245 in December 2025, an increase of 481%. That headline figure masks two significant downturns and a long recovery period.
- 1995-2007 (The Boom): Prices rose from £36,706 to £125,437 over 13 years, a 242% increase. Growth was particularly strong in the early 2000s, with annual increases exceeding 30% in January 2005. This period reflected national house price inflation fuelled by low interest rates and loose lending.
- 2008-2009 (The Financial Crisis): Oldham peaked at £125,437 in December 2007 and fell to a trough of £97,961 by February 2013. The sharpest annual decline was -17.8% in March 2009. That 21.9% peak-to-trough fall was deeper than England's 18.2% decline and the North West's 18.3% decline over the same period.
- 2010-2013 (Stagnation): Prices bounced briefly in 2010 (reaching £108,330 by January) before drifting lower again. The market did not stabilise until early 2013. February 2013 marked the absolute bottom at £97,961.
From peak to trough, Oldham lost 21.9% of its value over five years. That was deeper than England (18.2%) and the North West (18.3%). The full recovery took until November 2017.
- 2014-2016 (Turning Point): Recovery began slowly. By January 2016, prices had climbed to £112,282. The recovery was driven by improving mortgage availability and growing investor interest in Greater Manchester's lower-priced boroughs.
- 2017 (Full Recovery): Oldham prices finally passed the pre-crash peak in November 2017, reaching £126,560. That recovery took almost exactly 10 years from peak to peak.
- 2018-2019 (Pre-Pandemic Growth): Steady growth continued, with prices reaching £137,635 by December 2019. Annual growth ran at 4-7% through this period.
- 2020-2022 (Pandemic Surge): The combination of the stamp duty holiday and a shift in buyer preferences towards space drove prices sharply higher. Oldham reached £186,609 by December 2022, a 35.6% increase from December 2019. Annual growth hit 15.6% in June 2021.
- 2023 (Rate Shock): Rising interest rates cooled the market. Annual change turned negative briefly, hitting -0.8% in December 2023. Prices dipped from £186,609 (December 2022) to £185,200 (December 2023).
- 2024-2025 (Current): Growth resumed through 2024 and accelerated into 2025. The latest reading of £213,245 in December 2025 shows annual growth of 8.4%, outpacing both England's 1.7% and the North West's 4.5%.
Long-term growth summary:
- 5 years (2020-2025): 41.9% growth (£150,287 to £213,245)
- 10 years (2015-2025): 92.8% growth (£110,591 to £213,245)
- 15 years (2010-2025): 96.8% growth (£108,381 to £213,245)
- 20 years (2005-2025): 110.5% growth (£101,306 to £213,245)
- 30 years (1995-2025): 481.0% growth (£36,706 to £213,245)
The 10-year recovery from peak to peak is a useful reference point for anyone buying in Oldham today. Investors who bought at the 2007 peak and held through the downturn saw positive returns within a decade. The 2023 rate shock produced a brief pause rather than a sustained correction, and the current 8.4% annual growth rate is the strongest in Greater Manchester outside the city centre.
Source: HM Land Registry House Price Index for Oldham, January 1995 to December 2025.
Thinking of Buying?
We have off-market investment properties averaging 8%+ annual yield.
View Property DealsSold House Prices in Oldham
The average sold price across all property types in Oldham is £213,245, sitting £78,620 below England's £291,865. That 26.9% discount applies unevenly across property types. Flats carry the steepest discount at 40.2%, while semi-detached houses show the narrowest gap at 16.1%.
| Property Type | Oldham Average | England Average | Difference |
|---|---|---|---|
| Detached houses | £376,481 | £471,667 | -20.2% |
| Semi-detached houses | £242,614 | £289,135 | -16.1% |
| Terraced houses | £180,588 | £244,830 | -26.2% |
| Flats and maisonettes | £131,199 | £219,340 | -40.2% |
| All property types | £213,245 | £291,865 | -26.9% |
Detached houses in Oldham average £376,481, a 20.2% discount against England's £471,667. The detached market is concentrated in OL3 (Saddleworth, Uppermill), where asking prices average £440,530 and the housing stock skews heavily towards larger properties. This is a different market from the rest of the borough.
Semi-detached houses at £242,614 show the smallest discount of any property type at 16.1%. Semi-detached properties make up a significant share of Oldham's housing stock, particularly in OL2 (Royton, Shaw), OL4 (Lees, Springhead), and M24 (Middleton). Strong demand from owner-occupiers keeps this segment priced closer to the national average.
Terraced houses at £180,588 sit 26.2% below England's £244,830. Terraces dominate the older parts of the borough, particularly OL1 (Town Centre, Chadderton), OL8 (Werneth, Hollinwood), and OL9 (Chadderton, Westwood). This is the property type most commonly purchased by buy-to-let investors in Oldham.
Flats and maisonettes carry the deepest discount at 40.2%, with Oldham's average of £131,199 against England's £219,340. The flat market in Oldham is small. Low transaction volumes mean this figure is more volatile than the other property types. The town centre regeneration programme, with its 331 homes at Princes Gate and 120 apartments on the former Riley's site, will add significant new flat stock over the next decade.
Property Data Sources
Our location guide relies on diverse, authoritative datasets including:
- HM Land Registry UK House Price Index
- Ministry of Housing, Communities and Local Government
- Ordnance Survey Data Hub
- Propertydata.co.uk
We update our property data quarterly to ensure accuracy. Last update: March 2026. All data is presented as provided by our sources without adjustments or amendments.
Price Per Square Foot in Oldham
Sold prices per square foot in Oldham range from £205 in OL8 (Werneth, Hollinwood) to £327 in OL3 (Saddleworth, Uppermill). Price per square foot strips out the effect of property size and reveals where the land itself commands a premium. OL3 stands apart from the rest of the borough at £327/sq ft, reflecting its rural Pennine setting and larger, higher-specification housing stock.
| Rank | Area | Price Per Sq Ft |
|---|---|---|
| 1 | OL8 (Werneth, Hollinwood) | £205 |
| 2 | OL1 (Town Centre, Chadderton) | £206 |
| 3 | OL7 (Ashton-under-Lyne) | £216 |
| 4 | OL4 (Lees, Springhead) | £228 |
| 5 | OL9 (Chadderton, Westwood) | £230 |
| 6 | OL2 (Royton, Shaw) | £244 |
| 7 | M24 (Middleton) | £246 |
| 8 | M35 (Failsworth) | £248 |
| 9 | SK15 (Stalybridge) | £248 |
| 10 | OL5 (Mossley) | £252 |
| 11 | OL3 (Saddleworth, Uppermill) | £327 |
The gap between OL3 at £327/sq ft and the rest of the borough is substantial. Strip out OL3, and the remaining 10 postcodes cluster between £205 and £252. For investors, the lower end of that range represents the most efficient entry point per square foot. OL8 and OL1, where terraced housing dominates, deliver the most floor space per pound.
For Sale Asking Prices in Oldham
Asking prices across Oldham's 11 postcodes show a clear split between the borough's eastern Pennine fringe and its urban core. The mean asking price across all 11 postcodes is £268,665, but this is pulled upward by OL3 (Saddleworth, Uppermill) at £440,530. Ten of the 11 postcodes sit below £300,000.
| Rank | Area | Asking Price |
|---|---|---|
| 1 | OL1 (Town Centre, Chadderton) | £218,967 |
| 2 | OL5 (Mossley) | £230,649 |
| 3 | OL8 (Werneth, Hollinwood) | £232,468 |
| 4 | OL7 (Ashton-under-Lyne) | £243,063 |
| 5 | OL4 (Lees, Springhead) | £244,155 |
| 6 | OL9 (Chadderton, Westwood) | £253,701 |
| 7 | M24 (Middleton) | £263,983 |
| 8 | M35 (Failsworth) | £265,398 |
| 9 | OL2 (Royton, Shaw) | £270,341 |
| 10 | SK15 (Stalybridge) | £292,057 |
| 11 | OL3 (Saddleworth, Uppermill) | £440,530 |
OL1 (Town Centre, Chadderton) offers the lowest entry point at £218,967. This is the postcode at the heart of the town centre regeneration, where the Princes Gate development and Spindles transformation are creating new housing and amenity. OL7 and OL8 sit close behind, both under £245,000.
OL3 at £440,530 is an outlier. Saddleworth and Uppermill are affluent, semi-rural villages on the western edge of the Pennines. Properties here are predominantly detached and owner-occupied. The area attracts a different buyer profile from the rest of the borough, and its rental market is limited (yield of 3.3%).

House Price Growth in Oldham
Which Oldham postcodes have delivered the strongest returns? Five-year growth ranges from 11.8% in OL5 (Mossley) to 60.1% in OL8 (Werneth, Hollinwood). The pattern is clear: the postcodes that started from the lowest base have grown fastest. OL8, OL1, and OL7 all sat below £180,000 five years ago.
| Area | 1 Year | 3 Years | 5 Years |
|---|---|---|---|
| OL8 (Werneth, Hollinwood) | 9.3% | 26.0% | 60.1% |
| OL1 (Town Centre, Chadderton) | 7.2% | 16.6% | 46.8% |
| OL7 (Ashton-under-Lyne) | 6.0% | 9.5% | 34.2% |
| OL2 (Royton, Shaw) | 0.1% | 12.2% | 31.8% |
| M35 (Failsworth) | 10.4% | 17.4% | 28.6% |
| OL9 (Chadderton, Westwood) | 3.3% | 5.8% | 27.5% |
| M24 (Middleton) | 3.4% | 9.2% | 27.4% |
| OL4 (Lees, Springhead) | 4.7% | 14.3% | 26.1% |
| OL3 (Saddleworth, Uppermill) | -6.2% | 5.0% | 14.6% |
| SK15 (Stalybridge) | -3.6% | -3.0% | 14.1% |
| OL5 (Mossley) | -0.3% | 1.0% | 11.8% |
OL8 (Werneth, Hollinwood) leads on five-year growth at 60.1%, with the second-highest one-year figure at 9.3% behind M35 (10.4%). An investor who bought at the average asking price five years ago would have seen approximately £87,000 in capital appreciation. OL1 follows at 46.8%, reflecting the regeneration-driven uplift in the town centre.
Three postcodes show negative one-year growth: OL3 (-6.2%), SK15 (-3.6%), and OL5 (-0.3%). These are the borough's higher-priced, lower-density postcodes where the rate shock of 2023 had a more lasting effect. SK15 also shows negative three-year growth at -3.0%, a pattern not seen in any of the lower-priced postcodes.
Monthly Property Sales in Oldham
In neighbouring Bolton, the busiest postcodes see 50+ sales per month. Oldham's volumes are lower. Monthly sales range from 8 in OL7 (Ashton-under-Lyne) to 40 in M24 (Middleton). But the turnover rates tell a different story. SK15 turns over 54% of its stock, and OL7 turns over 46%, suggesting properties that do come to market sell fast.
| Area | Sales Per Month | Turnover | Asking Price |
|---|---|---|---|
| M24 (Middleton) | 40 | 20% | £263,983 |
| OL2 (Royton, Shaw) | 38 | 16% | £270,341 |
| OL4 (Lees, Springhead) | 27 | 20% | £244,155 |
| OL9 (Chadderton, Westwood) | 26 | 21% | £253,701 |
| SK15 (Stalybridge) | 24 | 54% | £292,057 |
| OL8 (Werneth, Hollinwood) | 18 | 26% | £232,468 |
| M35 (Failsworth) | 17 | 16% | £265,398 |
| OL1 (Town Centre, Chadderton) | 16 | 34% | £218,967 |
| OL5 (Mossley) | 14 | 33% | £230,649 |
| OL3 (Saddleworth, Uppermill) | 13 | 13% | £440,530 |
| OL7 (Ashton-under-Lyne) | 8 | 46% | £243,063 |
M24 (Middleton) and OL2 (Royton, Shaw) account for the highest volumes at 40 and 38 sales per month respectively. Both are established residential areas with large housing stocks and a steady flow of owner-occupier and investor activity.
OL7 records just 8 sales per month but a 46% turnover rate. This means properties in OL7 that do come to market sell quickly relative to the total stock available. For investors, high turnover with low volume signals a tight market where demand outstrips supply.
Property Data Sources
Our location guide relies on diverse, authoritative datasets including:
- HM Land Registry UK House Price Index
- Ministry of Housing, Communities and Local Government
- Ordnance Survey Data Hub
- Propertydata.co.uk
We update our property data quarterly to ensure accuracy. Last update: March 2026. All data is presented as provided by our sources without adjustments or amendments.

Oldham Rental Market Analysis
For investors weighing up whether rental property is a worthwhile investment in Oldham, the data below breaks down average monthly rents and gross rental yields across the borough's postcodes.
Seven of Oldham's 11 postcodes have sufficient rental data, with monthly rents ranging from £911 (OL2) to £1,198 (OL3) and yields from 3.3% to 5.1%. If you are looking to build a property portfolio in the North West, Oldham's combination of sub-£250,000 entry prices and yields above 4% in multiple postcodes makes it a competitive buy-to-let property market within Greater Manchester.
Average Rent and Gross Rental Yields in Oldham
With asking prices under £255,000 and monthly rents above £1,000, Oldham's core postcodes deliver yields that compete with more established buy-to-let markets across Greater Manchester. Gross rental yields reach 5.1% in two postcodes: OL7 (Ashton-under-Lyne) and OL9 (Chadderton, Westwood). Four postcodes lack sufficient rental data. The remaining 7 form a yield range from 3.3% to 5.1%.
| Area | Average Monthly Rent | Asking Price | Gross Yield |
|---|---|---|---|
| OL7 (Ashton-under-Lyne) | £1,024 | £243,063 | 5.1% |
| OL9 (Chadderton, Westwood) | £1,075 | £253,701 | 5.1% |
| M24 (Middleton) | £1,039 | £263,983 | 4.7% |
| OL4 (Lees, Springhead) | £923 | £244,155 | 4.5% |
| OL2 (Royton, Shaw) | £911 | £270,341 | 4.0% |
| SK15 (Stalybridge) | £915 | £292,057 | 3.8% |
| OL3 (Saddleworth, Uppermill) | £1,198 | £440,530 | 3.3% |
| M35 (Failsworth) | Not enough data | £265,398 | Not enough data |
| OL1 (Town Centre, Chadderton) | Not enough data | £218,967 | Not enough data |
| OL5 (Mossley) | Not enough data | £230,649 | Not enough data |
| OL8 (Werneth, Hollinwood) | Not enough data | £232,468 | Not enough data |
OL7 and OL9 both deliver 5.1% gross yields, but from different positions. OL7 has the second-highest turnover rate in the borough at 46% (behind SK15's 54%) with just 8 sales per month, pointing to a tight market where lettable stock is scarce. OL9 offers higher absolute rent (£1,075 vs £1,024) with stronger sales volume (26 per month), making it easier to acquire stock.
OL3 commands the highest rent at £1,198 per month but delivers the lowest yield at 3.3%. The mismatch between rent and yield is driven by the high purchase price. OL3 is not a yield play. It is a capital growth and lifestyle-driven market.
Is Oldham Rent High?
Monthly rents in Oldham range from 32.1% to 42.2% of the local median gross monthly income. This measures affordability from the tenant's perspective. Higher percentages indicate greater rental demand pressure, which tends to support low void periods for landlords.
The median gross weekly salary in Oldham is £654.70, which equates to £2,837 per month or £34,042 per year. This is below the North West regional median of £720.10 per week and the Great Britain median of £752.40 per week. Data from the Nomis Labour Market Profile (ASHE 2025).
| Rank | Area | Rent as % of Income |
|---|---|---|
| 1 | OL3 (Saddleworth, Uppermill) | 42.2% |
| 2 | OL9 (Chadderton, Westwood) | 37.9% |
| 3 | M24 (Middleton) | 36.6% |
| 4 | OL7 (Ashton-under-Lyne) | 36.1% |
| 5 | OL4 (Lees, Springhead) | 32.5% |
| 6 | SK15 (Stalybridge) | 32.3% |
| 7 | OL2 (Royton, Shaw) | 32.1% |
| 8 | M35 (Failsworth) | Not enough data |
| 9 | OL1 (Town Centre, Chadderton) | Not enough data |
| 10 | OL5 (Mossley) | Not enough data |
| 11 | OL8 (Werneth, Hollinwood) | Not enough data |
OL3 tops the table at 42.2% of income, driven by the highest rents in the borough (£1,198/month) against a borough-wide salary base. Tenants in OL3 are likely earning above the Oldham median, given the area's profile, which means this figure overstates the affordability strain for actual OL3 renters. The calculation uses the borough-wide Oldham median salary, not an OL3-specific figure.
The five postcodes between 32% and 37% of income represent the core rental market. These are areas where tenants on Oldham salaries can afford the rent without exceeding conventional affordability thresholds. For landlords, this balance between achievable rents and tenant affordability supports stable occupancy.
Thinking of Buying?
We have off-market investment properties averaging 8%+ annual yield.
View Property DealsBuy-to-Let Considerations
Are House Prices High? Price-to-Earnings Ratios
Purchasing a property in Oldham requires between 6.4 and 12.9 times the median annual salary. This is based on the Nomis Labour Market Profile for Oldham showing the median gross annual income for Oldham residents is £34,042.
For context, the national benchmark is 7.5x (England's average sold price of £291,865 divided by the Great Britain median salary of £39,125). Six of Oldham's 11 postcodes sit below that national benchmark, with M24, M35, OL2, SK15, and OL3 at or above it.
| Rank | Area | Price-to-Earnings Ratio |
|---|---|---|
| 1 | OL1 (Town Centre, Chadderton) | 6.4x |
| 2 | OL5 (Mossley) | 6.8x |
| 3 | OL8 (Werneth, Hollinwood) | 6.8x |
| 4 | OL7 (Ashton-under-Lyne) | 7.1x |
| 5 | OL4 (Lees, Springhead) | 7.2x |
| 6 | OL9 (Chadderton, Westwood) | 7.5x |
| 7 | M24 (Middleton) | 7.8x |
| 8 | M35 (Failsworth) | 7.8x |
| 9 | OL2 (Royton, Shaw) | 7.9x |
| 10 | SK15 (Stalybridge) | 8.6x |
| 11 | OL3 (Saddleworth, Uppermill) | 12.9x |
OL1 offers the most accessible entry at 6.4x earnings. This places it among the most affordable postcodes in Greater Manchester by this measure. The cluster of postcodes between 6.4x and 7.5x covers the core investment areas of the borough.
OL3 at 12.9x is nearly double the next highest postcode. This ratio reflects OL3's premium pricing and its disconnect from Oldham's local salary base. Buyers in OL3 are typically not first-time buyers constrained by local incomes.
Deposit Requirements in Oldham
A 30% deposit in Oldham ranges from £65,690 in OL1 (Town Centre, Chadderton) to £132,159 in OL3 (Saddleworth, Uppermill). That £66,469 spread represents the full range of the borough's property market. Investors looking for below market value properties may find opportunities in OL1 and OL8 where asking prices sit below £235,000. For a breakdown of all the costs involved in purchasing a buy-to-let, see our guide to buy-to-let costs. You can also estimate your stamp duty liability here.
| Rank | Area | 30% Deposit Required |
|---|---|---|
| 1 | OL1 (Town Centre, Chadderton) | £65,690 |
| 2 | OL5 (Mossley) | £69,195 |
| 3 | OL8 (Werneth, Hollinwood) | £69,740 |
| 4 | OL7 (Ashton-under-Lyne) | £72,919 |
| 5 | OL4 (Lees, Springhead) | £73,247 |
| 6 | OL9 (Chadderton, Westwood) | £76,110 |
| 7 | M24 (Middleton) | £79,195 |
| 8 | M35 (Failsworth) | £79,619 |
| 9 | OL2 (Royton, Shaw) | £81,102 |
| 10 | SK15 (Stalybridge) | £87,617 |
| 11 | OL3 (Saddleworth, Uppermill) | £132,159 |
Six postcodes require deposits under £76,500. OL1, OL5, OL8, OL7, OL4, and OL9 form the affordable core of the borough. The jump from OL9 (£76,110) to M24 (£79,195) marks the transition to the mid-range postcodes, and the gap from SK15 (£87,617) to OL3 (£132,159) shows how Saddleworth occupies a different price tier entirely. Browse current investment property for sale near Oldham.

What the Oldham Data Tells Buy-to-Let Investors
OL7 (Ashton-under-Lyne) and OL9 (Chadderton, Westwood) share the top yield at 5.1%, with deposits of £72,919 and £76,110 respectively. OL7 adds the second-highest turnover rate in the borough at 46% (behind SK15's 54%) and 34.2% five-year growth. OL9 offers higher absolute rent (£1,075/month) and stronger sales volume (26/month). Both postcodes sit below the national price-to-earnings benchmark of 7.5x.
The strongest capital growth has come from the borough's lowest-priced postcodes. OL8 (60.1% over five years), OL1 (46.8%), and OL7 (34.2%) all started from sub-£180,000 bases. OL8 does not currently have sufficient rental data, but its 60.1% five-year growth is the highest in the borough and its 9.3% one-year growth is second only to M35's 10.4%. OL1 also lacks rental data, which leaves the two top growth postcodes without yield figures.
Three postcodes show weaker recent performance. OL3 (-6.2% one-year), SK15 (-3.6%), and OL5 (-0.3%) have all seen negative or flat one-year growth. SK15 also shows -3.0% three-year growth. All three are higher-priced postcodes (£230,000+) where the interest rate environment has had a more pronounced effect on transaction values.
Investors seeking entry below published asking prices may find opportunities through off-market property channels, particularly in postcodes like OL1 and OL8 where the lack of rental data means less competition from yield-driven buyers.
Oldham operates a selective licensing scheme in parts of the borough. Landlords letting in designated areas need to check whether their property falls within a licensing zone and factor the licence fee into their cost calculations.
How Oldham Compares
Oldham's mean asking price of £268,665 places it mid-range within its Greater Manchester neighbours. It sits above Wigan (£227,201) and below Stockport (£371,546). The comparison below covers four neighbouring boroughs, all within Greater Manchester, each offering a different balance of price, rent, and yield.
| Location | Mean Asking Price | Mean Monthly Rent | Top Gross Yield |
|---|---|---|---|
| Wigan | £227,201 | £892 | 5.6% |
| Bolton | £248,685 | £936 | 5.1% |
| Rochdale | £255,610 | £956 | 5.1% |
| Oldham | £268,665 | £1,012 | 5.1% |
| Stockport | £371,546 | £1,314 | 6.2% |
Oldham matches Bolton and Rochdale on top yield (all 5.1%) but charges higher asking prices. Wigan offers a lower entry point and higher yield (5.6%). Stockport sits significantly above in price but also delivers the highest top yield at 6.2%, driven by its proximity to Manchester city centre and strong tenant demand.
Where Oldham stands out is on rent. Its mean monthly rent of £1,012 is the second highest in this group, behind only Stockport. For investors who prioritise monthly cash flow over headline yield, Oldham's higher rents partly compensate for its higher purchase prices relative to Wigan and Bolton.
For more detail on these neighbouring markets, see our guides to property investment in Wigan, Bolton, Rochdale, and Stockport. You can also explore all North West locations on our best buy-to-let locations page, or visit Property Investments UK for our full range of guides and resources.
Frequently Asked Questions
Is Oldham a good place to live?
Oldham's population grew 7.6% to 242,088 between 2011 and 2021, and the borough offers a wide range of housing. The urban core around OL1 and OL8 has affordable terraced stock with Metrolink tram links to Manchester city centre. The eastern villages of OL3 (Saddleworth, Uppermill) are semi-rural, set against the Pennines, with detached properties averaging £440,530. The town centre is undergoing significant regeneration, with the Spindles market hall conversion and Coliseum Theatre restoration both completing in 2026. For more on where to invest across the UK, see our guide to the best buy to let locations.
What are the best areas to invest in Oldham?
The data points to OL7 (Ashton-under-Lyne) and OL9 (Chadderton, Westwood) as the postcodes where yield, growth, and turnover metrics converge. Both deliver 5.1% gross yields with deposits under £77,000. OL7 adds 34.2% five-year growth and a 46% turnover rate. OL8 (Werneth, Hollinwood) leads on five-year capital growth at 60.1%, though rental data is currently unavailable for that postcode. OL1 (Town Centre, Chadderton) offers the lowest entry point at £218,967 and sits at the centre of the regeneration programme.
How does Oldham compare to Rochdale for buy-to-let?
Both boroughs deliver the same top gross yield of 5.1%, but Oldham commands higher rents (£1,012 vs £956 per month). Mean asking prices are close: Oldham at £268,665 versus Rochdale at £255,610. Rochdale offers a marginally lower entry point, while Oldham delivers higher absolute monthly income for landlords. Both border each other in Greater Manchester and share similar tenant demographics. For the full Rochdale data, see our Rochdale buy-to-let guide.
What is the average house price in Oldham?
The average sold price in Oldham is £213,245 as of December 2025, according to HM Land Registry. This is 26.9% below England's average of £291,865 and broadly level with the North West regional average of £217,428. Asking prices across the 11 postcodes range from £218,967 (OL1) to £440,530 (OL3). Year-on-year growth stands at 8.4%, the strongest annual increase since the pandemic surge of 2021-2022.
What is the average rent in Oldham?
Average monthly rents across Oldham's 7 postcodes with data range from £911 in OL2 (Royton, Shaw) to £1,198 in OL3 (Saddleworth, Uppermill). The borough mean is £1,012 per month. Rents in the core buy-to-let postcodes of OL7, OL9, and M24 sit between £1,024 and £1,075. These rents represent 32-38% of Oldham's median gross monthly income of £2,837, keeping tenant affordability within conventional thresholds.
How does Oldham compare to Manchester for property investment?
Oldham's average sold price of £213,245 is significantly below Manchester city centre pricing, where one-bed apartments regularly exceed £200,000. Gross yields in Oldham reach 5.1%, competitive for a borough connected to Manchester by Metrolink tram. The trade-off is lower tenant demand density and slower rental market data coverage (4 of 11 postcodes lack rental data). For the Manchester comparison, see our Manchester buy-to-let guide.