Where to Buy Property Investments in Tameside: Yields of 5.7%
Tameside sits on Greater Manchester's eastern edge, where average sold prices run 27.5% below the England average and gross rental yields reach 5.7%. Population grew 5.36% between the 2011 and 2021 censuses to 231,071, and the Metrolink tram network gives tenants a direct commute into the city centre job market.
At an average sold price of £211,680 compared to England's £291,865, Tameside is one of the more affordable entry points into the Greater Manchester property market. Asking prices across the borough's 10 postcodes range from £230,649 in OL5 to £292,057 in SK15. Seven postcodes return rental data, with gross yields between 3.8% and 5.7%. That £61,000 spread between the cheapest and most expensive postcodes creates very different investment profiles depending on where in the borough you buy. For investors exploring buy-to-let property in the North West, Tameside's western postcodes near Manchester and its eastern Pennine fringe operate almost like two separate markets.
This guide covers the Metropolitan Borough of Tameside (ONS code E08000008): Ashton-under-Lyne, Denton, Droylsden, Dukinfield, Hyde, Mossley, and Stalybridge. Tameside borders Manchester to the west, Stockport to the south, and Oldham to the north. SK13 extends into the Peak District fringe around Glossop and Hadfield, and M35 covers Failsworth on the Oldham border. PropertyData groups all 10 postcodes under the Tameside market area.
Article updated: March 2026
Tameside Buy-to-Let Market Overview 2026
Tameside offers below-average entry prices with yields strongest in the western postcodes closest to Manchester.
- Average sold price: £211,680 (27.5% below England's £291,865)
- Asking price range: £230,649 (OL5 Mossley) to £292,057 (SK15 Stalybridge)
- Rental yields: 3.8% (SK15) to 5.7% (M43) across 7 postcodes with rental data
- Rental income: Monthly rents from £915 (SK15) to £1,135 (M43)
- Price per sq ft: House prices from £216/sq ft (OL7) to £286/sq ft (SK13)
- Market activity: Sales ranging from 8 per month (OL7) to 44 per month (SK14)
- Deposit requirements: 30% deposits range from £69,195 (OL5) to £87,617 (SK15)
- Affordability ratios: Property prices from 6.79 to 8.60 times Tameside's median annual salary of £33,949
Contents

-
by Robert Jones, Founder of Property Investments UK
With two decades in UK property, Rob has been investing in buy-to-let since 2005, and uses property data to develop tools for property market analysis.

Property Data Sources
Our location guide relies on diverse, authoritative datasets including:
- HM Land Registry UK House Price Index
- Ministry of Housing, Communities and Local Government
- Ordnance Survey Data Hub
- Propertydata.co.uk
We update our property data quarterly to ensure accuracy. Last update: March 2026. All data is presented as provided by our sources without adjustments or amendments.
Why Invest in Tameside?
Population grew from 219,324 to 231,071 between the 2011 and 2021 censuses, a 5.36% increase. Tameside is connected to central Manchester by the Metrolink tram network and the M60 and M67 motorways. Ashton-under-Lyne, the borough's largest town, has its own Metrolink terminus.
The median gross weekly salary for Tameside residents is £652.90, equivalent to £33,949 per year. That sits below both the North West regional median of £720.10 per week and the Great Britain median of £752.40 per week. Employment rate: 76.1%. Lower local salaries are part of why property here costs less than in neighbouring Manchester or Stockport. The numbers are connected.
Tameside Economic Summary
- Population: 231,071 (2021 Census). Growth of 5.36% from 2011.
- Median annual salary: £33,949 (local), £37,445 (North West), £39,125 (Great Britain)
- Employment rate: 76.1% (Tameside)
- Unemployment rate: Data suppressed (Tameside)
- Key employment sectors: Health and social care, manufacturing, retail and wholesale, construction
Source: ONS Census 2021, Nomis Labour Market Profile (ASHE 2025)
Regeneration and Investment in Tameside
Over £50 million in government-backed regeneration funding is flowing into Tameside across multiple programmes. Three projects stand out.
- Ashton-under-Lyne Town Centre (£19.87m Levelling Up Fund, Under Construction): The funding is delivering a market square rebuild with covered canopy, Ashton Town Hall facade restoration, and mixed-use redevelopment of the former interchange site to attract private investment for housing and commercial space. Updates at Tameside Council.
- Stalybridge Town Centre (£19.9m Towns Fund, Under Construction): Part of the wider Tameside Towns Investment Programme, the works include Civic Hall and Astley Cheetham Art Gallery renovations, public realm improvements to Armentieres Square, and a new bridge over the River Tame connecting to Market Street. Updates at Tameside Correspondent.
- Hattersley Pride in Place (£20m, Announced): £20 million over 10 years for neighbourhood improvements administered by a local community board, covering facilities, public spaces, sports clubs, youth services, and small business support. Updates at Jonathan Reynolds MP.

Tameside Property Market Analysis
When was the last house price crash in Tameside?
All sold property price data from HM Land Registry is available at the Tameside metropolitan borough level, covering the full local authority area.
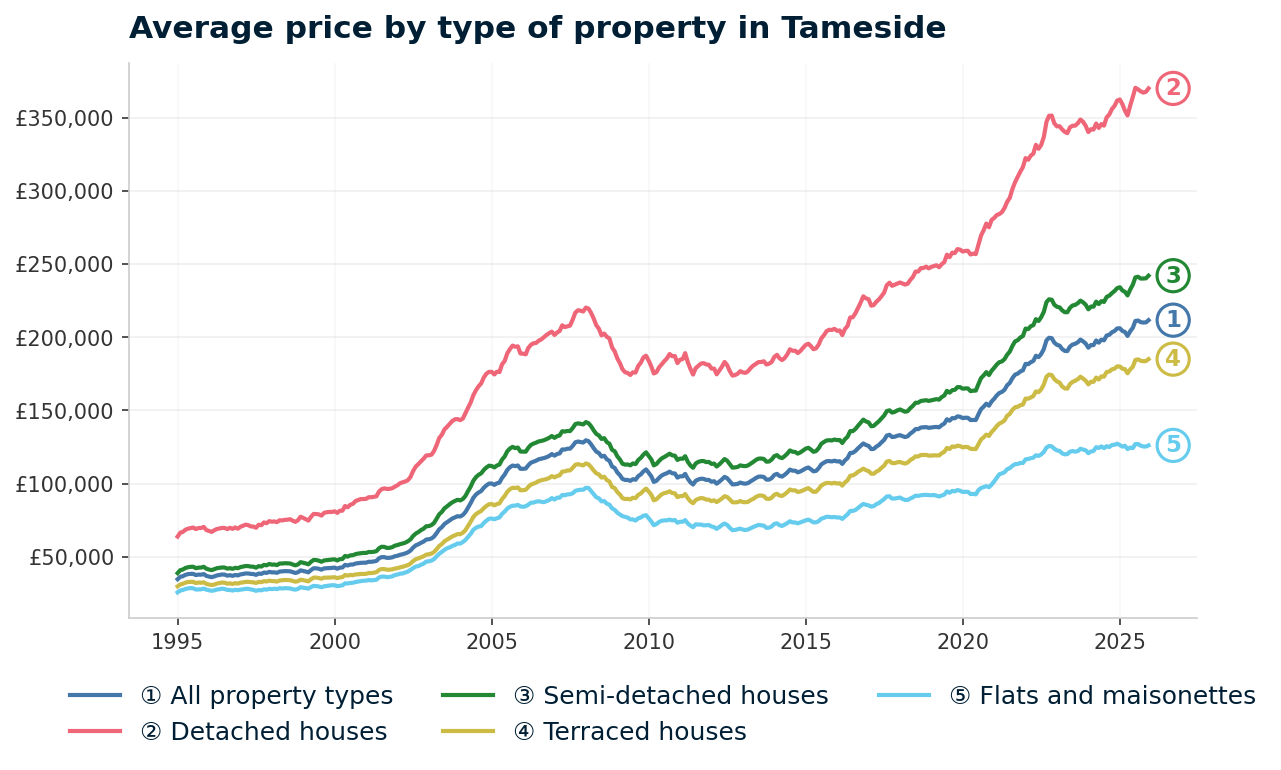
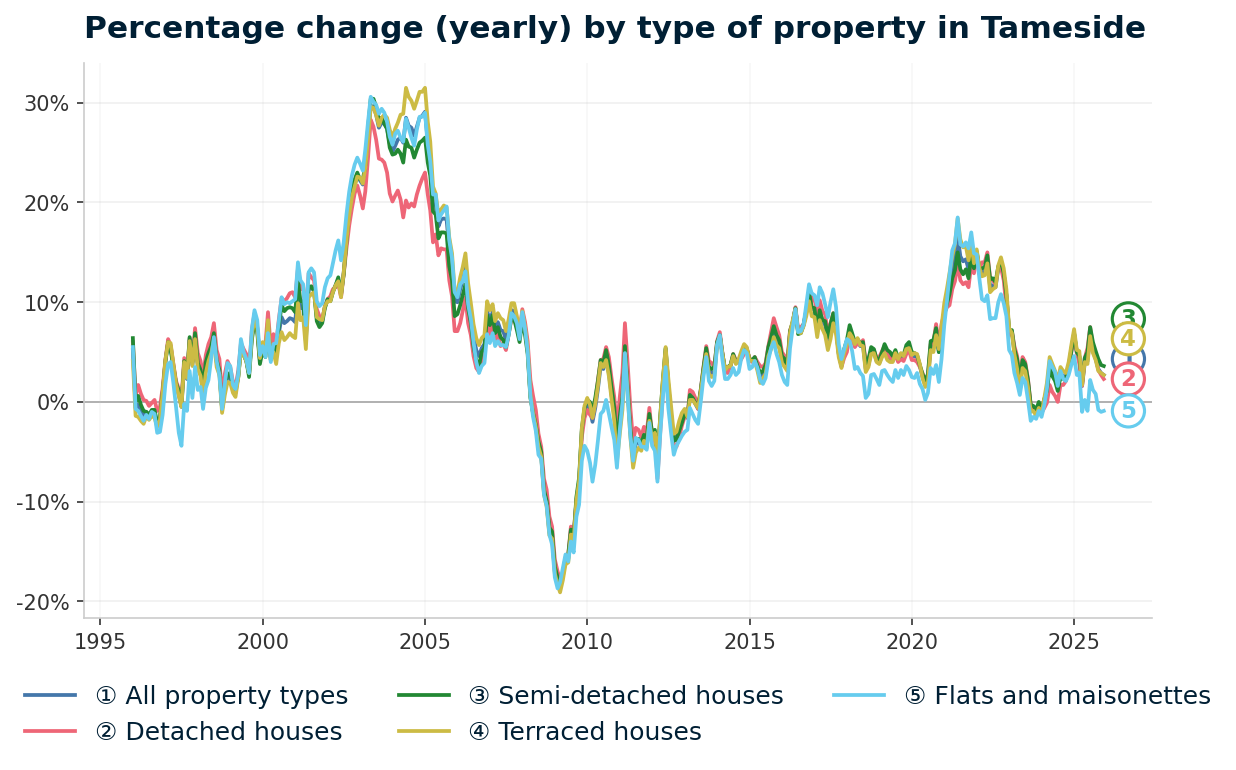
Tameside's average sold price fell 23.3% from its pre-crash peak of £129,592 in January 2008 to a trough of £99,376 in June 2011. That is a steeper decline than both the North West region (18.3%) and England (18.2%). It took more than nine years for prices to recover to their January 2008 level, finally passing it in July 2017.
Here is the full cycle-by-cycle breakdown:
- 1995-2007 (The Boom): Average sold prices started at £34,669 in January 1995, reaching £45,938 by December 2000. Growth accelerated sharply in the early 2000s, with annual increases hitting 28.7% in December 2004. By December 2006, prices had reached £120,168. Peak: £129,592 in January 2008.
- 2008-2009 (The Financial Crisis): Annual changes turned negative by June 2008 (-2.4%). By December 2008: £110,700, down 13.5% year-on-year. Worst reading: March 2009 at -18.7%, price £103,210. For context, England fell 18.2% peak to trough (£183,883 in September 2007 to £150,438 in March 2009). The North West fell 18.3% (£141,847 in December 2007 to £115,931 in January 2013). Tameside's 23.3% decline was deeper than both.
- 2010-2013 (Stagnation): Prices went sideways between £99,000 and £105,000. Absolute trough: June 2011 at £99,376. By December 2013, prices had barely moved at £103,759. Four years of dead money.
- 2014-2016 (Turning Point): Growth returned. December 2014: £109,315. December 2015: £115,649. Then acceleration through 2016, ending at £126,371 with 9.3% annual growth.
- 2017-2019 (Recovery and Growth): July 2017: prices finally passed the pre-crash peak, hitting £129,876. Nine years to get back to even. Steady 4-5.5% annual growth followed, reaching £145,703 by December 2019.
- 2020-2022 (Pandemic Surge): Brief dip to £143,459 in June 2020, then prices surged. December 2020: £156,054 (+7.1%). The stamp duty holiday and demand shifts pushed annual growth to 16.6% by June 2021. December 2022: £196,347, still running at +10.7%.
- 2023 (Rate Shock): Growth slowed sharply. June 2023: +3.8%. December 2023: -0.3% at £195,694. A brief wobble, not a correction.
- 2024-2025 (Current): Growth resumed. December 2024: £206,023 (+5.3%). Latest reading: £211,680 in December 2025 at +2.7% annual change.
Long-term growth summary:
- 30 years (1995-2025): +510.6% growth (£34,669 to £211,680)
- 20 years (2005-2025): +92.3% growth (£110,105 to £211,680)
- 15 years (2010-2025): +103.3% growth (£104,100 to £211,680)
- 10 years (2015-2025): +83.0% growth (£115,649 to £211,680)
- 5 years (2020-2025): +35.6% growth (£156,054 to £211,680)
Tameside's crash was deeper than both the national and regional averages, but the recovery since 2014 has been strong. Prices have more than doubled from the 2011 trough. The 2023 rate shock barely registered. At £211,680, the current average sits 63.3% above the pre-crash peak of £129,592.
Source: HM Land Registry House Price Index for Tameside, January 1995 to December 2025.
Thinking of Buying?
We have off-market investment properties averaging 8%+ annual yield.
View Property DealsSold House Prices in Tameside
The average sold price in Tameside is £211,680, which is 27.5% below the England average of £291,865. Every property type trades at a discount, but the size of the gap varies. Flats show the steepest discount. Semi-detached houses show the narrowest. Most of the borough's transaction volume is terraced and semi-detached stock.
| Property Type | Tameside Average | England Average | Difference |
|---|---|---|---|
| Detached houses | £370,054 | £471,667 | -21.5% |
| Semi-detached houses | £242,084 | £289,135 | -16.3% |
| Terraced houses | £185,052 | £244,830 | -24.4% |
| Flats and maisonettes | £126,100 | £219,340 | -42.5% |
| All property types | £211,680 | £291,865 | -27.5% |
Detached houses average £370,054, a 21.5% discount to England's £471,667. Detached stock is scarce in Tameside and clusters in the eastern postcodes SK13 and SK15 where plots are larger.
Semi-detached at £242,084 sit 16.3% below England's £289,135. Narrowest discount and the highest transaction volume property type in the borough. Semis dominate across M34, SK14, and SK16.
Terraced houses at £185,052 trade 24.4% below England's £244,830. This is the core buy-to-let stock. Low entry prices plus steady tenant demand in the western postcodes make terraced properties the most common investment purchase here.
Flats show the steepest discount at 42.5%: Tameside £126,100 against England's £219,340. Flat stock concentrates in Ashton-under-Lyne and Hyde town centres. Outside central Manchester, demand for flatted accommodation drops off and there is limited new-build supply.
Tameside also sits 2.6% below the North West regional average of £217,428.
Property Data Sources
Our location guide relies on diverse, authoritative datasets including:
- HM Land Registry UK House Price Index
- Ministry of Housing, Communities and Local Government
- Ordnance Survey Data Hub
- Propertydata.co.uk
We update our property data quarterly to ensure accuracy. Last update: March 2026. All data is presented as provided by our sources without adjustments or amendments.
Price Per Square Foot in Tameside
In Tameside, transaction-based prices per square foot range from £216 in OL7 to £286 in SK13. That £70 spread tells a geographic story: the two Ashton postcodes (OL6 and OL7) offer the cheapest space in the borough, while SK13 on the Peak District fringe commands a clear premium.
| Rank | Area | Price per sq ft |
|---|---|---|
| 1 | OL7 (Ashton-under-Lyne West) | £216 |
| 2 | OL6 (Ashton-under-Lyne) | £228 |
| 3 | M35 (Failsworth) | £248 |
| 3 | SK15 (Stalybridge) | £248 |
| 5 | SK14 (Hyde) | £249 |
| 5 | SK16 (Dukinfield) | £249 |
| 7 | OL5 (Mossley) | £252 |
| 8 | M43 (Droylsden) | £259 |
| 9 | M34 (Denton) | £262 |
| 10 | SK13 (Glossop, Hadfield) | £286 |
OL7 and OL6 are the cheapest by cost per square foot at £216 and £228. These same two postcodes return some of the borough's strongest yields. More floor area per pound spent, and the rental income keeps up.
SK13 sits well clear at £286 per square foot. Glossop and Hadfield attract a different buyer profile. Peak District proximity and semi-rural character push per-square-foot values above the borough norm. Six postcodes in the middle sit tightly bunched between £248 and £259, which points to relatively uniform housing quality across the central towns.
For Sale Asking Prices in Tameside
The cheapest postcode is OL5 Mossley at £230,649 and the most expensive is SK15 Stalybridge at £292,057. Mean asking price across all 10 Tameside postcodes: £255,481. Five sit below that average, five above. It is a clean geographic split between the borough's more affordable western towns and its pricier eastern edges.
| Rank | Area | Asking Price |
|---|---|---|
| 1 | OL5 (Mossley) | £230,649 |
| 2 | OL6 (Ashton-under-Lyne) | £235,206 |
| 3 | M43 (Droylsden) | £237,121 |
| 4 | OL7 (Ashton-under-Lyne West) | £243,063 |
| 5 | SK16 (Dukinfield) | £249,739 |
| 6 | SK14 (Hyde) | £259,186 |
| 7 | M34 (Denton) | £259,882 |
| 8 | M35 (Failsworth) | £265,398 |
| 9 | SK13 (Glossop, Hadfield) | £282,508 |
| 10 | SK15 (Stalybridge) | £292,057 |
The four cheapest postcodes (OL5, OL6, M43, OL7) all sit below £245,000. Three of those four also return the highest gross yields. Cheaper entry prices, comparable rents, stronger percentage returns.
SK15 and SK13 carry the highest asking prices at £292,057 and £282,508. SK15 covers Stalybridge, where larger properties and lower turnover push averages up. SK13 takes in Glossop and Hadfield on the Derbyshire border with a Peak District landscape premium. In practical terms, that £61,408 gap between OL5 and SK15 translates to £18,422 extra on a 30% deposit.
House Price Growth in Tameside
OL6 Ashton-under-Lyne leads five-year growth at 46.6%, more than 11 percentage points clear of the next postcode. Sharp divide here: the three postcodes with the strongest five-year growth are the same three that lead on yields. Western corridor outperforms the eastern and southern edges on both metrics.
| Area | 1 Year | 3 Years | 5 Years |
|---|---|---|---|
| OL6 (Ashton-under-Lyne) | 1.1% | 6.3% | 46.6% |
| M43 (Droylsden) | 0.0% | 1.2% | 35.4% |
| OL7 (Ashton-under-Lyne West) | 6.0% | 9.5% | 34.2% |
| SK16 (Dukinfield) | -1.9% | 6.8% | 32.2% |
| M35 (Failsworth) | 10.4% | 17.4% | 28.6% |
| SK13 (Glossop, Hadfield) | -0.3% | 10.8% | 28.2% |
| SK14 (Hyde) | -1.5% | 10.5% | 28.0% |
| M34 (Denton) | -5.9% | 2.0% | 21.8% |
| SK15 (Stalybridge) | -3.6% | -3.0% | 14.1% |
| OL5 (Mossley) | -0.3% | 1.0% | 11.8% |
Six of the 10 postcodes show negative one-year growth. M34 Denton is weakest at -5.9%, followed by SK15 at -3.6%. Only three are growing over one year: M35 at 10.4%, OL7 at 6.0%, and OL6 at 1.1%. Short term, much of the borough is flat or falling.
The five-year column tells a different story. OL6's 46.6% stands out. A £160,000 purchase in OL6 five years ago would be sitting on roughly £74,560 in capital growth. M43 and OL7 follow at 35.4% and 34.2%. Same western corridor, same pattern: yield and growth converge. SK15 and OL5 trail at 14.1% and 11.8%.
Monthly Property Sales in Tameside
SK14 Hyde leads with 44 sales per month but a turnover of just 20%: a large housing stock that trades relatively slowly. At the other end, OL7 records only 8 sales per month but 46% turnover. Smaller market, but when properties come up they move.
| Area | Sales per Month | Turnover | Asking Price |
|---|---|---|---|
| SK14 (Hyde) | 44 | 20% | £259,186 |
| M34 (Denton) | 35 | 42% | £259,882 |
| SK13 (Glossop, Hadfield) | 34 | 52% | £282,508 |
| SK15 (Stalybridge) | 24 | 54% | £292,057 |
| M35 (Failsworth) | 17 | 16% | £265,398 |
| OL6 (Ashton-under-Lyne) | 17 | 20% | £235,206 |
| M43 (Droylsden) | 15 | 18% | £237,121 |
| SK16 (Dukinfield) | 15 | 25% | £249,739 |
| OL5 (Mossley) | 14 | 33% | £230,649 |
| OL7 (Ashton-under-Lyne West) | 8 | 46% | £243,063 |
SK15 and SK13 have the highest turnover at 54% and 52%. Both are among the pricier postcodes. Active owner-occupier markets where properties change hands regularly. M35 and M43 sit at the bottom with 16% and 18% turnover.
M43 Droylsden records 15 sales per month with 18% turnover. Low volume, low turnover. Fewer properties come to market, which tends to support prices when demand holds. OL6 and OL7 follow the same pattern: moderate volumes in smaller markets where listed stock is limited.
Property Data Sources
Our location guide relies on diverse, authoritative datasets including:
- HM Land Registry UK House Price Index
- Ministry of Housing, Communities and Local Government
- Ordnance Survey Data Hub
- Propertydata.co.uk
We update our property data quarterly to ensure accuracy. Last update: March 2026. All data is presented as provided by our sources without adjustments or amendments.
Tameside Rental Market Analysis
Seven of 10 postcodes return rental data, with monthly rents from £915 to £1,135 and gross yields from 3.8% to 5.7%. For investors weighing up whether rental property is a worthwhile investment in this part of Greater Manchester, the data breaks down by postcode below.
If you are looking to build a property portfolio in the North West, Tameside's affordable entry prices and Metrolink commuter links into central Manchester create a distinct rental corridor on the eastern side of the conurbation.
Average Rent & Gross Rental Yields in Tameside
M43 Droylsden returns the highest gross yield in Tameside at 5.7%, driven by monthly rents of £1,135 on an asking price of £237,121. The top three yielding postcodes (M43, OL7, OL6) all sit in the western half of the borough, where cheaper prices and solid rents combine to produce the strongest percentage returns. Three postcodes (M35, OL5, SK16) have insufficient rental data.
| Area | Average Rent | Asking Price | Gross Yield |
|---|---|---|---|
| M43 (Droylsden) | £1,135 | £237,121 | 5.7% |
| OL7 (Ashton-under-Lyne West) | £1,024 | £243,063 | 5.1% |
| OL6 (Ashton-under-Lyne) | £970 | £235,206 | 5.0% |
| SK14 (Hyde) | £1,020 | £259,186 | 4.7% |
| M34 (Denton) | £998 | £259,882 | 4.6% |
| SK13 (Glossop, Hadfield) | £955 | £282,508 | 4.1% |
| SK15 (Stalybridge) | £915 | £292,057 | 3.8% |
| M35 (Failsworth) | Not enough data | £265,398 | Not enough data |
| OL5 (Mossley) | Not enough data | £230,649 | Not enough data |
| SK16 (Dukinfield) | Not enough data | £249,739 | Not enough data |
The yield spread between top and bottom is 1.9 percentage points: 5.7% in M43 versus 3.8% in SK15. That gap is driven by entry price, not rent. M43's monthly rent of £1,135 is actually £220 higher than SK15's £915. But SK15's asking price is £54,936 more, and the higher entry cost dilutes the return.
SK14 Hyde returns 4.7% on rents of £1,020 per month. Mid-table on yield, but SK14 leads the borough on transaction volume with 44 sales per month. More exit options than the lower-volume postcodes at the top of the yield table.
Is Tameside Rent High?
Across the seven postcodes with rental data, rent ranges from 32.4% to 40.1% of the median gross monthly income in Tameside. Every postcode exceeds the 30% threshold. That tells you something about both the strength of rental demand here and the pressure on tenant budgets.
The median gross weekly salary in Tameside is £652.90, which equates to £2,829 per month or £33,949 per year. This is below the North West regional median of £720.10 per week and the Great Britain median of £752.40 per week. Data from the Nomis Labour Market Profile (ASHE 2025).
| Rank | Area | Rent as % of Income |
|---|---|---|
| 1 | M43 (Droylsden) | 40.1% |
| 2 | OL7 (Ashton-under-Lyne West) | 36.2% |
| 3 | SK14 (Hyde) | 36.1% |
| 4 | M34 (Denton) | 35.3% |
| 5 | OL6 (Ashton-under-Lyne) | 34.3% |
| 6 | SK13 (Glossop, Hadfield) | 33.8% |
| 7 | SK15 (Stalybridge) | 32.4% |
| — | M35 (Failsworth) | Not enough data |
| — | OL5 (Mossley) | Not enough data |
| — | SK16 (Dukinfield) | Not enough data |
M43 Droylsden sits at the top at 40.1%, the highest rent-to-income ratio in the borough. Higher absolute rents (£1,135 per month) combined with Tameside's below-average local salaries push this figure up. Tenants in M43 are committing a substantial share of income to housing. For landlords, that level of commitment tends to support rental income stability.
SK15 and SK13 have the lowest ratios at 32.4% and 33.8%. Also the lowest-yielding postcodes. Lower rents, higher property prices, less return per pound for the landlord, less pressure on tenant budgets.
Thinking of Buying?
We have off-market investment properties averaging 8%+ annual yield.
View Property DealsBuy-to-Let Considerations
Are House Prices High? Price-to-Earnings Ratios
Purchasing a property in Tameside requires between 6.79 and 8.60 times the median annual salary. This is based on the Nomis Labour Market Profile for Tameside showing the median gross annual income for Tameside residents is £33,949.
| Rank | Area | Price-to-Earnings Ratio |
|---|---|---|
| 1 | OL5 (Mossley) | 6.79 |
| 2 | OL6 (Ashton-under-Lyne) | 6.93 |
| 3 | M43 (Droylsden) | 6.98 |
| 4 | OL7 (Ashton-under-Lyne West) | 7.16 |
| 5 | SK16 (Dukinfield) | 7.36 |
| 6 | SK14 (Hyde) | 7.63 |
| 7 | M34 (Denton) | 7.66 |
| 8 | M35 (Failsworth) | 7.82 |
| 9 | SK13 (Glossop, Hadfield) | 8.32 |
| 10 | SK15 (Stalybridge) | 8.60 |
National benchmark: England's average sold price of £291,865 divided by the Great Britain median salary of £39,125 gives a ratio of 7.46. Five Tameside postcodes sit below this: OL5 (6.79), OL6 (6.93), M43 (6.98), OL7 (7.16), and SK16 (7.36). The remaining five exceed it, SK15 highest at 8.60.
All five postcodes below the national benchmark sit in the borough's western and central towns. OL5, OL6, and M43 fall below 7.0. Property costing less than seven times the local annual salary. These are the same postcodes delivering the strongest yields. The data keeps pointing to the same western corridor. SK15's 8.60 ratio reflects higher prices compounded by Tameside's below-average salaries.
Deposit Requirements in Tameside
All deposits below are calculated at 30% of the current asking price. Entry-level 30% deposit in Tameside starts at £69,195 in OL5, rising to £87,617 in SK15. That £18,422 gap is real money. Four postcodes require sub-£75,000 deposits, which is competitive for Greater Manchester. Investors comparing Tameside with below market value properties elsewhere will find this entry point works.
| Rank | Area | 30% Deposit Required |
|---|---|---|
| 1 | OL5 (Mossley) | £69,195 |
| 2 | OL6 (Ashton-under-Lyne) | £70,562 |
| 3 | M43 (Droylsden) | £71,136 |
| 4 | OL7 (Ashton-under-Lyne West) | £72,919 |
| 5 | SK16 (Dukinfield) | £74,922 |
| 6 | SK14 (Hyde) | £77,756 |
| 7 | M34 (Denton) | £77,965 |
| 8 | M35 (Failsworth) | £79,619 |
| 9 | SK13 (Glossop, Hadfield) | £84,752 |
| 10 | SK15 (Stalybridge) | £87,617 |
Four postcodes require deposits below £75,000: OL5 (£69,195), OL6 (£70,562), M43 (£71,136), and OL7 (£72,919). Same postcodes that deliver the strongest yields. Choosing M43 over SK15 saves £16,481 on the deposit and gains 1.9 percentage points of gross yield. The numbers stack up differently depending on which end of the borough you buy.
Beyond the deposit, investors need to budget for stamp duty and ongoing buy-to-let costs including mortgage payments, insurance, maintenance, and any licensing fees.
What the Tameside Data Tells Buy-to-Let Investors
M43 Droylsden tops the yield table at 5.7%, followed by OL7 at 5.1% and OL6 at 5.0%. All three sit west of the borough's central axis with asking prices between £235,000 and £243,000 and 30% deposits from £70,562 to £72,919. Rents in this corridor run from £970 to £1,135, supported by commuter demand into central Manchester via the Metrolink and M60.
OL6 Ashton-under-Lyne records the strongest five-year growth in the borough at 46.6%. M43 and OL7 follow at 35.4% and 34.2%. The highest-yielding postcodes are also the fastest-growing. That overlap matters. For investors looking at investment property, income and capital growth point to the same three postcodes.
On the other side of the table, SK15 Stalybridge returned -3.0% over three years with the lowest yield at 3.8%. Three postcodes (M35, OL5, SK16) lack sufficient rental data entirely. OL5 Mossley, the cheapest postcode at £230,649, returned just 11.8% over five years on only 14 sales per month. Lower rental market liquidity and smaller transaction volumes.
Some Greater Manchester boroughs operate selective licensing schemes that affect landlord costs and compliance requirements. Off-market property listings exist in postcodes where on-market stock is limited.
How Tameside Compares
Tameside's mean asking price of £255,481 is the lowest of the five Greater Manchester boroughs compared here. Rochdale is nearly identical at £255,610. Stockport sits £116,065 higher at £371,546. On yields, Tameside's top 5.7% sits behind Manchester's 7.8% and Stockport's 6.2%.
| Location | Mean Asking Price | Mean Monthly Rent | Top Gross Yield |
|---|---|---|---|
| Tameside | £255,481 | £1,002 | 5.7% |
| Manchester | £266,893 | £1,308 | 7.8% |
| Oldham | £268,665 | £1,012 | 5.1% |
| Rochdale | £255,610 | £956 | 5.1% |
| Stockport | £371,546 | £1,314 | 6.2% |
Tameside and Rochdale sit at near-identical asking prices, but Tameside's top yield of 5.7% gives it a 0.6 percentage point edge. Manchester leads on both rents and yields, reflecting its city centre premium and student population. Stockport's mean asking price of £371,546 puts it in a different bracket entirely, though its 6.2% top yield partly compensates.
Oldham and Rochdale both return 5.1% top yields at higher or equivalent prices. Lowest mean asking price and third-highest top yield: that is where Tameside sits in this group. For a wider view of how these boroughs rank nationally, see our guide to the best buy-to-let areas in the UK.
Frequently Asked Questions
How does Tameside compare to Manchester for buy-to-let?
Manchester's top yield of 7.8% beats Tameside's 5.7%, and Manchester's mean rent of £1,308 exceeds Tameside's £1,002. City centre postcodes with professional and student tenants drive that gap. Where Tameside comes in is entry cost: mean asking price of £255,481 versus Manchester's £266,893, a £11,412 saving. Different price point, different profile. The numbers work differently depending on budget and whether you prioritise yield or capital outlay.
What regeneration is happening in Tameside?
Over £50 million in government funding is going into Tameside's town centres. Ashton-under-Lyne: £19.87m (Levelling Up Fund) for market square and Town Hall. Stalybridge: £19.9m for civic hall and public realm. Hattersley: £20m over 10 years (Pride in Place). Ashton and Stalybridge works are under construction. Regeneration typically takes 3 to 5 years to show up in property prices and rental demand data for surrounding postcodes.
Can I find buy-to-let property under £250,000 in Tameside?
Five of 10 postcodes average below £250,000: OL5 Mossley (£230,649), OL6 Ashton-under-Lyne (£235,206), M43 Droylsden (£237,121), OL7 Ashton-under-Lyne West (£243,063), and SK16 Dukinfield (£249,739). These are averages. Individual properties will sit above and below. Terraced houses at a borough average of £185,052 offer the most consistent route to sub-£250,000 stock.
Is there much demand for rental property in Tameside?
Rent-to-income ratios range from 32.4% to 40.1% across the seven postcodes with data. All seven exceed 30%. Tameside's position on the Metrolink network and proximity to Manchester's job market sustain commuter demand. M43, the postcode closest to Manchester, records the highest rent-to-income ratio at 40.1% and the highest absolute rent at £1,135 per month. Tenants are paying for the commute advantage.
Which Tameside postcodes offer the best combination of yield and growth?
M43 Droylsden delivers the strongest combined return: 5.7% gross yield (highest in the borough) and 35.4% five-year growth (second only to OL6's 46.6%). OL7 follows at 5.1% yield with 34.2% growth. OL6 returns 5.0% yield with the borough's strongest growth at 46.6%. All three sit in the western half with asking prices between £235,000 and £243,000. The eastern postcodes (SK13, SK15) have higher values but lower yields and weaker short-term growth. Two different markets within one borough.