

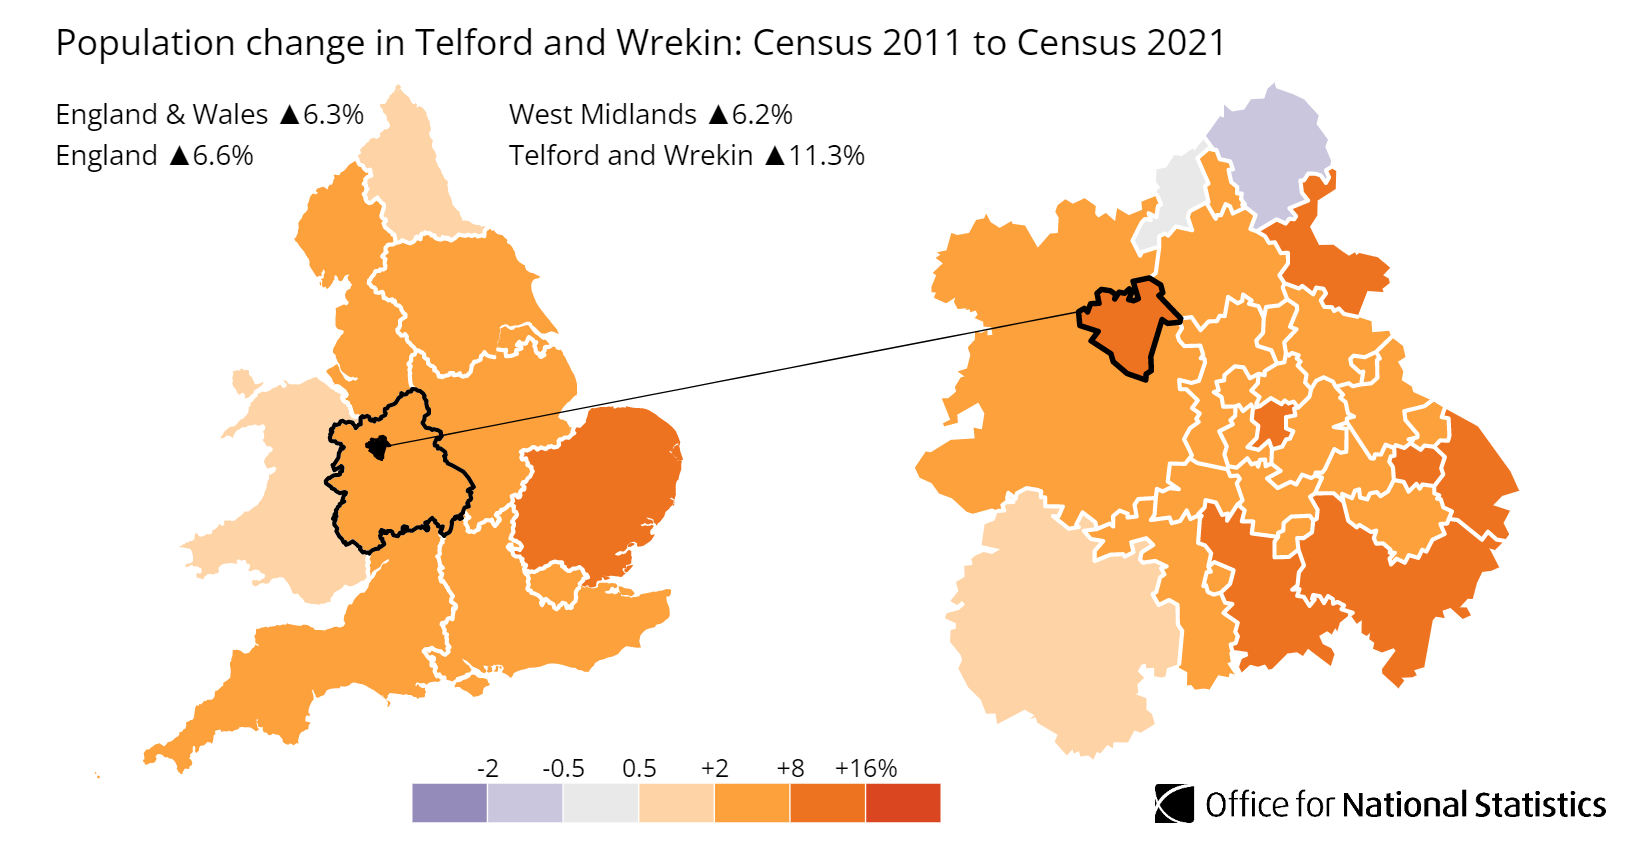
Telford is a new town in Shropshire, in the West Midlands. Average sold prices across Telford and Wrekin sit at £223,330 on the HM Land Registry House Price Index, 23.0% below England's £289,946 and 4.1% under the wider West Midlands average of £232,897. Telford is one of the West Midlands' planned new towns, built in the 1960s around a cluster of older Shropshire settlements, and that history shows up in the price data: a market of affordable, purpose-built family housing rather than the period stock that commands a premium elsewhere in the region. The local authority's population grew 11.34% between the 2011 and 2021 censuses, from 166,641 to 185,541 residents.
Telford's affordability is reinforced by earnings that sit below both the regional and national averages. The median gross weekly salary across Telford and Wrekin is £693.20, compared with £712.50 across the West Midlands and £752.40 for Great Britain. Lower wages keep the price-to-earnings ratio in the cheaper postcodes manageable, and the buy-to-let picture is concentrated in the urban core. The spread between TF3 at a £217,508 asking price and TF6 at £453,675 creates a two-tier market within a single borough, where the higher yields sit with the cheaper, denser postcodes rather than the rural fringe.
This guide covers the unitary authority of Telford and Wrekin (ONS code E06000020) across ten postcodes from TF1 to TF11. Telford sits in Shropshire, on the M54 corridor between the West Midlands conurbation and the Welsh border, around 30 miles north-west of Birmingham. Investors weighing nearby options in the region can also look at Wolverhampton buy-to-let and Stoke-on-Trent buy-to-let.
Article updated: July 2026
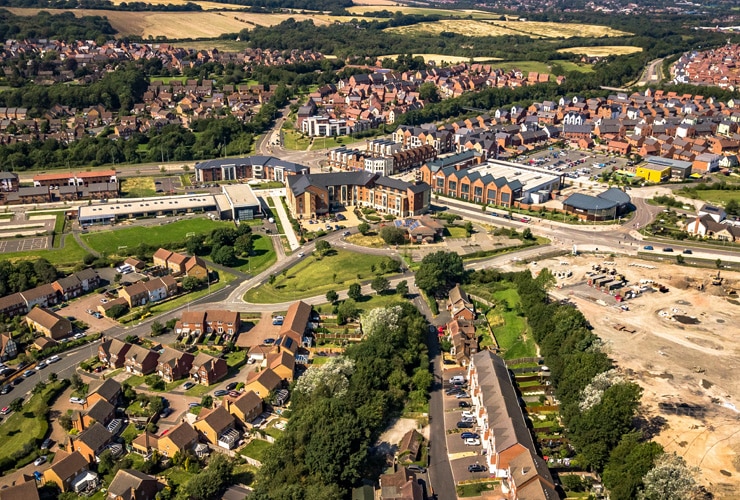
Why Invest in Telford?
Telford and Wrekin, the local authority Telford sits within, grew its population 11.34% between the 2011 and 2021 censuses, from 166,641 to 185,541 residents. That growth rate is close to double the England and Wales average of 6.3%, and it is one of the faster-growing local authorities in the West Midlands. New housing on the western edge of the town, in areas such as Lawley (TF4) and Priorslee (TF2), has drawn in young families and first-time buyers, feeding both the population rise and the demand for rented homes.
The local economy leans on making and moving things. Telford and Wrekin has 15.4% of its employee jobs in manufacturing, more than double the Great Britain figure of 7.3% and well ahead of the West Midlands at 9.6%. Wholesale and retail is the single largest sector at 16.5%, with health and social work and administrative services each on 11.0%. The town's position on the M54, with direct motorway access to Birmingham and the wider conurbation, has long made it a magnet for distribution and advanced engineering, and that employment base anchors tenant demand across the urban postcodes.
Median gross annual earnings across Telford and Wrekin are £36,044, which is below both the West Midlands and the Great Britain medians. Lower local wages are part of what keeps Telford affordable, and they also mean the rental market here is more sensitive to price than in higher-earning Cheshire or commuter-belt locations. The flip side is that the cheaper postcodes still clear the 30% rent affordability mark on local incomes, which the rental sections below break down postcode by postcode.
Telford Economic Summary
- Population (Telford and Wrekin): 185,541 (2021 Census). Growth of 11.34% from 2011.
- Median annual salary: £36,044 (local), £37,050 (West Midlands), £39,125 (Great Britain)
- Employment rate: 76.1% (local), 73.6% (West Midlands), 75.5% (Great Britain)
- Unemployment rate: 4.6% (local)
- Key employment sectors: Wholesale and retail, manufacturing, health and social work, administrative services, education
Source: ONS Census 2021, Nomis Labour Market Profile (ASHE 2025, Employment Oct 2024-Sep 2025)
Regeneration and Investment in Telford
Telford and Wrekin Council is partway through a £300 million regeneration programme spread across three town centres, a significant level of public investment for a borough of 185,000 people. The spending is concentrated in the older urban centres of Telford town centre, Wellington and Oakengates, the same postcodes where most of the rental market sits.
- Station Quarter, Telford Town Centre (Under construction, £45.7 million): A mixed-use scheme delivering 189 new homes, 117 of them through Nuplace, the council's own housing company, alongside 72 affordable homes and a new sixth-form college facility relocating A-Level provision into the town centre. Town-centre living at this scale is a new market segment for Telford, landing directly in the TF3 postcode. Updates at Telford & Wrekin Council Newsroom.
- Wellington Town Centre (Under construction, completing 2026): The former YMCA on Walker Street has been converted into apartments above ground-floor retail, and a further Nuplace scheme at Duke Street and Crown Street is due to complete in autumn 2026, adding homes and commercial units to the high street. The work targets the TF1 postcode and is part of the same council-led programme. Updates at Telford & Wrekin Council Newsroom.
- Investing in Telford and Wrekin Programme (Multiple stages, by 2027): The wider £300 million programme ties Station Quarter, the Wellington works and the Oakengates precinct redevelopment together, funded roughly half by the council and half through external grants from the West Midlands Combined Authority, the Towns Fund and the UK Shared Prosperity Fund. Spreading the money across three centres rather than one gives investors more than a single regeneration story to follow. Updates at Telford & Wrekin Council Newsroom.
Source: Office for National Statistics - Population for Telford and Wrekin
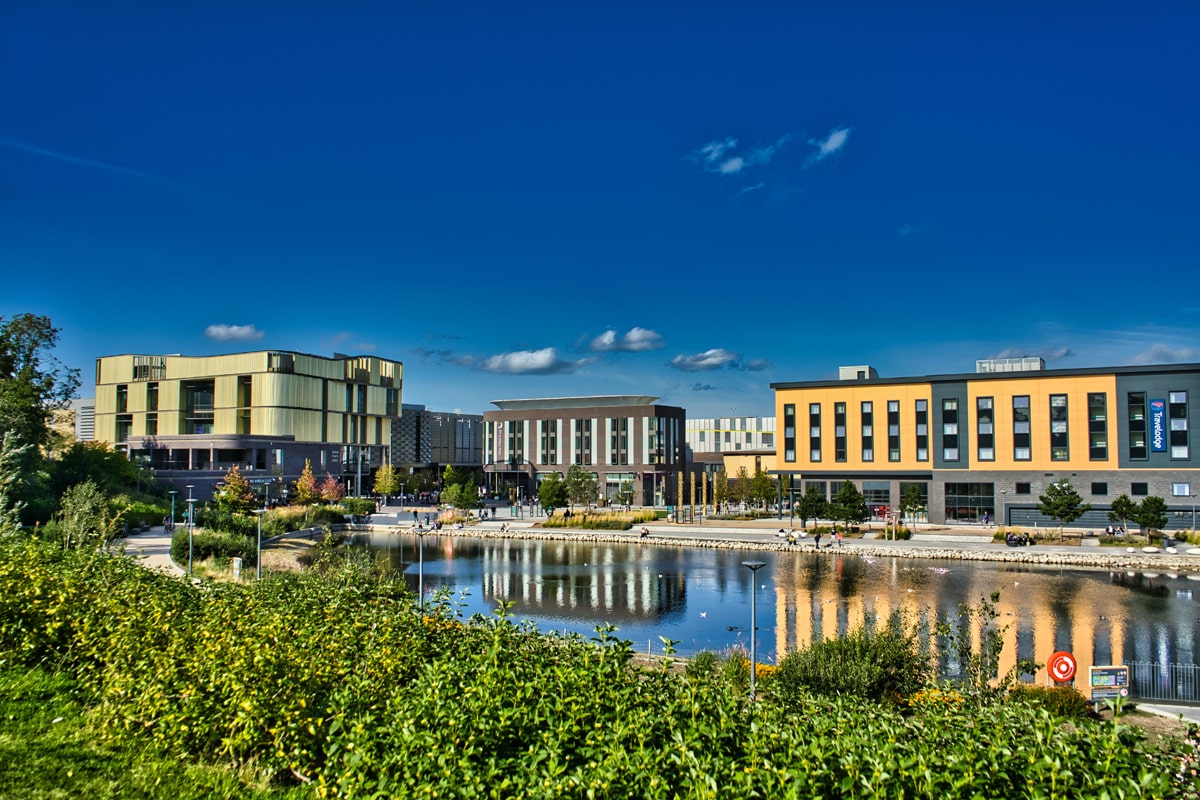
Telford Property Market Analysis
Average property prices in Telford and Wrekin have risen 446.2% since January 1995, from £40,891 to £223,330. The sections below trace that journey cycle by cycle, then drill into postcode-level data for sold prices, price per square foot, asking prices, growth trends and monthly transaction volumes.
When was the last house price crash in Telford?
Telford sits within the unitary authority of Telford and Wrekin, so all sold property prices from HM Land Registry are recorded at this level. The Land Registry House Price Index tracks average prices from January 1995 to March 2026, covering 31 years of market cycles.
The 1995 to 2008 boom: Telford and Wrekin started at £40,891 in January 1995. By December 2000, prices had reached £57,182, a 39.8% increase in six years as low interest rates and easier mortgage lending fuelled the market. Growth then accelerated sharply, with prices more than doubling to £128,906 by December 2005. The market kept climbing to a pre-crash peak of £148,790 in June 2008.
2008 to 2009, the financial crisis: Prices fell from the June 2008 peak of £148,790 to a trough of £123,357 in March 2013, but the steepest drop came early. The worst year-on-year reading was -16.5% in May 2009. Telford's eventual decline of 17.1% from peak to trough was shallower than the England fall of 18.2% (from £183,883 in September 2007 to £150,438 in March 2009) but deeper than the West Midlands fall of 16.9% (from £143,623 in October 2007 to £119,403 in June 2009). Telford's lower-value, post-war housing stock left it more exposed than the regional average.
The 2010 to 2013 stagnation: Prices found no floor for years after the initial crash. After a brief bounce, the average drifted back down, and the true low of £123,357 was not reached until March 2013, nearly five years after the peak. Telford spent the early 2010s as one of the slower West Midlands markets to stabilise.
Recovery, 2014 to 2017: Growth returned with prices rising from £138,797 in December 2014 to £150,372 by February 2017. That February 2017 reading was the first time prices surpassed the June 2008 pre-crash peak of £148,790. The recovery took eight and a half years, longer than England's, reflecting the deeper and longer stagnation phase.
The 2017 to 2019 pre-pandemic growth: Steady single-digit growth continued. Prices moved from £150,372 in February 2017 to £165,491 by December 2019, with annual growth running between 4% and 6% through most of the period.
2020 to 2022, the pandemic surge: The stamp duty holiday and a rush for affordable family housing with more space turbocharged Telford. Prices rose from £159,303 in June 2020 to £173,280 by December 2020 (4.7% annual growth), then ran hard through 2021 to £194,100 by December 2021 (12.0% annual). By December 2022 the average reached £216,830, an 11.7% annual jump.
The 2023 rate shock: Higher mortgage rates cooled the market. Prices eased to £210,778 by December 2023, recording -2.8% annual growth. Telford's affordable price point meant the correction was modest in cash terms compared with higher-value markets.
2024 to present: Prices recovered to £217,687 by December 2024 (3.3% annual growth) and reached £223,330 by the latest reading in March 2026, the highest figure on record for the borough. The current price is 50.1% above the pre-crash peak of £148,790.
Long-term growth summary:
- 5 years (March 2021 to March 2026): 24.3% growth (£179,604 to £223,330)
- 10 years (March 2016 to March 2026): 58.8% growth (£140,612 to £223,330)
- 15 years (March 2011 to March 2026): 71.2% growth (£130,428 to £223,330)
- 20 years (March 2006 to March 2026): 70.6% growth (£130,930 to £223,330)
- 30 years (January 1995 to March 2026): 446.2% growth (£40,891 to £223,330)
Telford's 17.1% crash was deeper than the West Midlands average but its 30-year return of 446.2% outpaces most of the region, helped by the low 1995 starting base. The eight-and-a-half-year recovery was among the slower in the West Midlands, a reminder that affordable markets can take longer to climb back after a downturn. An investor who bought at the exact peak in June 2008 would now be sitting on a 50.1% gain on the Land Registry average.
- All property types
- Detached
- Semi-detached
- Terraced
- Flats
- All property types
- Detached
- Semi-detached
- Terraced
- Flats
Sold House Prices in Telford
The average sold price across all property types in Telford and Wrekin is £223,330, which is 23.0% below the England average of £289,946 as of March 2026. That discount runs across every property type, but it is deepest among flats. Flats sit 54.2% below the England figure, while detached houses are 25.7% below. The pattern reflects a borough built around houses, where the small flat market is thin and pulls a much lower average than the apartment stock in bigger cities.
| Property Type | Telford and Wrekin Average | England Average | Difference |
|---|---|---|---|
| Detached houses | £349,558 | £470,492 | -25.7% |
| Semi-detached houses | £205,929 | £288,185 | -28.5% |
| Terraced houses | £174,757 | £243,788 | -28.3% |
| Flats and maisonettes | £98,354 | £214,563 | -54.2% |
| All property types | £223,330 | £289,946 | -23.0% |
Detached houses at £349,558 carry a 25.7% discount to England's £470,492. Telford's detached stock is concentrated in the greener outer postcodes such as TF6 (Admaston, Wrockwardine) and TF5 (Wellington rural), where larger purpose-built and village-style homes draw family buyers. Annual growth of 3.2% points to steady rather than speculative demand.
Semi-detached houses at £205,929 sit 28.5% below England's £288,185 and just under the borough-wide average. This is the backbone of Telford's housing, the standard new-town family home, and it spreads across almost every postcode. Annual growth of 4.4% is the strongest of any property type here, which fits a market where the affordable mainstream stock is doing the heavy lifting.
Terraced houses at £174,757 offer a 28.3% discount to England's £243,788. The terraced stock concentrates in the denser urban postcodes such as TF3 (Madeley, Brookside) and TF7 (Sutton Hill, Stirchley), the same areas that carry the lowest asking prices and the highest yields. Annual growth of 3.4% keeps terraces broadly in step with the wider market.
Flats and maisonettes at £98,354 show by far the deepest discount at 54.2% below England's £214,563. Telford is not a flat-heavy town. The small volume of apartment stock, much of it older and low-rise, means flat prices reflect purely local demand without the city-centre or investor premium that lifts flat values in Birmingham or Wolverhampton. Annual change of -2.2% confirms a soft corner of the market.
Price Per Square Foot in Telford
£129 per square foot separates Telford's cheapest postcode from its dearest, with TF7 at £173 and TF8 and TF11 both topping out at £302. Measuring by the square foot strips out the size of the homes and gives a cleaner read of what each location itself commands. The urban core postcodes sit at the bottom of the table, while the rural and historic outer areas command the premium space.
| Rank | Area | Price Per Sq Ft |
|---|---|---|
| 1 | TF7 (Sutton Hill, Stirchley) | £173 |
| 2 | TF3 (Madeley, Brookside) | £214 |
| 3 | TF1 (Wellington, Hadley) | £241 |
| 4 | TF4 (Lawley, Dawley) | £245 |
| 5 | TF2 (Donnington, Priorslee) | £249 |
| 6 | TF6 (Admaston, Wrockwardine) | £276 |
| 7 | TF5 (Wellington rural) | £285 |
| 8 | TF10 (Newport) | £290 |
| 9 | TF11 (Shifnal) | £302 |
| 10 | TF8 (Ironbridge, Coalbrookdale) | £302 |
TF7 at £173 per square foot is the cheapest bricks-and-mortar value in Telford, drawn from 276 transactions. Sutton Hill and Stirchley are dense estates of post-war and 1970s housing, the kind of smaller, standardised stock that drives the buy-to-let end of the market and sits at the bottom of every price table here.
TF8 and TF11 share the top of the table at £302 per square foot. TF8 covers Ironbridge and Coalbrookdale, where the World Heritage gorge setting and period cottages command a heritage premium on a thin run of 78 transactions, while TF11 takes in Shifnal, a sought-after commuter village on the Birmingham rail line. In both, paying more per square foot is paying for location rather than for a denser, more rentable type of home.
For Sale Asking Prices in Telford
TF3 at £217,508 and TF6 at £453,675 sit 108.6% apart, the widest asking-price gap across Telford's ten postcodes. That spread mirrors the sold-price hierarchy: the dense urban core at the bottom, the rural and commuter fringe at the top. The mean asking price across all ten postcodes is £327,780.
| Rank | Area | Asking Price |
|---|---|---|
| 1 | TF3 (Madeley, Brookside) | £217,508 |
| 2 | TF7 (Sutton Hill, Stirchley) | £217,664 |
| 3 | TF1 (Wellington, Hadley) | £267,688 |
| 4 | TF4 (Lawley, Dawley) | £271,727 |
| 5 | TF2 (Donnington, Priorslee) | £273,335 |
| 6 | TF10 (Newport) | £360,503 |
| 7 | TF8 (Ironbridge, Coalbrookdale) | £367,999 |
| 8 | TF5 (Wellington rural) | £412,422 |
| 9 | TF11 (Shifnal) | £435,278 |
| 10 | TF6 (Admaston, Wrockwardine) | £453,675 |
TF3 and TF7 are effectively level at the bottom, around £217,500, and they are the only two postcodes where the asking price sits below the borough-wide average. Madeley and Brookside in TF3, and Sutton Hill and Stirchley in TF7, are the dense urban estates at the heart of the new town. For an investor working to a fixed budget, these two postcodes offer the most property for the money and the lowest barrier to entry.
At the top, TF6 at £453,675 and TF11 at £435,278 are rural and commuter-village territory, where larger detached homes and period stock push the average well past £400,000. To put the spread in context, TF6's average asking price is more than double TF3's. These outer postcodes are owner-occupier markets first, and the rental sections below show how that weight of price compresses the yields they can deliver.
House Price Growth in Telford
TF7 (Sutton Hill, Stirchley) leads Telford on five-year growth at 26.1%, the only postcode to clear 25%, while every one of the ten postcodes posted a positive five-year return. The longer-run numbers are uniformly positive, but the one and three-year readings are mixed, with several urban postcodes giving back ground recently after the pandemic surge.
| Area | 1 Year | 3 Years | 5 Years |
|---|---|---|---|
| TF7 (Sutton Hill, Stirchley) | 0.5% | 4.2% | 26.1% |
| TF3 (Madeley, Brookside) | 6.2% | 0.7% | 18.6% |
| TF4 (Lawley, Dawley) | -5.1% | 1.3% | 14.5% |
| TF10 (Newport) | -5.3% | 2.3% | 12.3% |
| TF2 (Donnington, Priorslee) | -7.4% | -3.7% | 10.7% |
| TF8 (Ironbridge, Coalbrookdale) | 4.6% | 8.0% | 10.2% |
| TF1 (Wellington, Hadley) | -5.0% | -4.0% | 9.8% |
| TF11 (Shifnal) | -3.4% | -2.5% | 6.7% |
| TF6 (Admaston, Wrockwardine) | 6.7% | 10.0% | 2.3% |
| TF5 (Wellington rural) | 1.6% | 6.2% | -1.6% |
TF7 at 26.1% over five years is the standout, and it pairs that with a low asking price and the highest yield in the borough. Sutton Hill and Stirchley started from a low base, so the affordable urban stock had the most room to climb through the pandemic years. TF3 follows at 18.6% and adds the strongest one-year reading at 6.2%, so the two cheapest postcodes have also been the two strongest growers over five years.
TF6 and TF5 sit at the bottom of the five-year table at 2.3% and -1.6%, despite TF6 posting the joint-strongest recent figures at 6.7% over one year and 10.0% over three. These are the premium outer postcodes, where higher prices and a smaller, slower-moving market have produced weaker long-run growth even as the most recent year has rebounded.
Monthly Property Sales in Telford
Transaction volumes split Telford sharply, from 37 sales a month in TF1 down to just 3 in TF8, with the urban postcodes doing most of the trading. The busiest postcodes are the affordable, populous ones, while the premium outer areas see only a handful of sales a month. Turnover, the share of stock changing hands each year, stays in a narrower band of 3% to 12%.
| Area | Sales Per Month | Turnover | Asking Price |
|---|---|---|---|
| TF1 (Wellington, Hadley) | 37 | 12% | £267,688 |
| TF2 (Donnington, Priorslee) | 35 | 11% | £273,335 |
| TF4 (Lawley, Dawley) | 22 | 8% | £271,727 |
| TF3 (Madeley, Brookside) | 18 | 12% | £217,508 |
| TF10 (Newport) | 16 | 8% | £360,503 |
| TF7 (Sutton Hill, Stirchley) | 14 | 12% | £217,664 |
| TF11 (Shifnal) | 12 | 12% | £435,278 |
| TF6 (Admaston, Wrockwardine) | 6 | 9% | £453,675 |
| TF5 (Wellington rural) | 4 | 7% | £412,422 |
| TF8 (Ironbridge, Coalbrookdale) | 3 | 3% | £367,999 |
TF1 and TF2 record the most sales at 37 and 35 a month, the two largest postcodes by housing stock and the heart of the Wellington and Donnington urban areas. For a landlord, that depth of trading means a far easier exit when the time comes to sell, with plenty of comparable transactions to price against.
TF8 sees just 3 sales a month at a 3% turnover, the thinnest market in the borough. Ironbridge and Coalbrookdale are a small, premium, heritage market where homes are held for years and rarely change hands. The four cheapest urban postcodes, TF3 and TF7 among them, hold a steady 12% turnover, the highest in Telford, so the affordable end trades more actively than the premium fringe.
How Long Properties Take to Sell in Telford
Selling times in Telford run from about 217 days in TF7 to over 1,000 days in TF8, and the gap is a real holding cost an investor carries at the end. Days on market is the typical time a home is listed before it sells; months of unsold stock measures how much for-sale supply is queued at the current rate of sales.
| Area | Avg Days to Sell | Months of Unsold Stock | Market |
|---|---|---|---|
| TF7 (Sutton Hill, Stirchley) | 217 | 7.1 | Balanced market |
| TF3 (Madeley, Brookside) | 234 | 7.7 | Balanced market |
| TF1 (Wellington, Hadley) | 254 | 8.3 | Balanced market |
| TF11 (Shifnal) | 254 | 8.3 | Balanced market |
| TF2 (Donnington, Priorslee) | 277 | 9.1 | Balanced market |
| TF6 (Admaston, Wrockwardine) | 277 | 9.1 | Balanced market |
| TF10 (Newport) | 380 | 12.5 | Buyer's market |
| TF4 (Lawley, Dawley) | 380 | 12.5 | Buyer's market |
| TF5 (Wellington rural) | 507 | 16.7 | Buyer's market |
| TF8 (Ironbridge, Coalbrookdale) | 1014 | 33.3 | Buyer's market |
The two cheapest urban postcodes, TF7 and TF3, also sell fastest, at roughly 217 and 234 days with under eight months of unsold stock. The premium and rural postcodes are the slow movers: TF5 sits on more than 16 months of stock and TF8's heritage market shows over 1,000 days and 33 months of supply, a figure inflated by how few homes ever come up for sale there. A faster-selling postcode is less time carrying a property you are trying to move on, which is part of why the affordable urban core reads better for a landlord than the headline yields alone suggest.
What Type of Property Can You Buy in Telford?
Semi-detached and detached houses dominate every Telford postcode, while terraced houses and flats cluster in the urban core of TF3, TF7 and TF4. The mix of housing stock shapes which strategies fit each area. The figures below are drawn from 2021 Census records for each postcode.
| Area | Detached | Semi-detached | Terraced | Flats |
|---|---|---|---|---|
| TF1 (Wellington, Hadley) | 42.0% | 36.6% | 13.3% | 7.6% |
| TF2 (Donnington, Priorslee) | 33.9% | 32.1% | 21.1% | 12.3% |
| TF3 (Madeley, Brookside) | 25.5% | 28.8% | 27.9% | 17.8% |
| TF4 (Lawley, Dawley) | 30.5% | 36.7% | 23.5% | 9.3% |
| TF5 (Wellington rural) | 58.8% | 27.1% | 8.8% | 5.2% |
| TF6 (Admaston, Wrockwardine) | 55.2% | 34.0% | 6.7% | 3.2% |
| TF7 (Sutton Hill, Stirchley) | 30.6% | 32.3% | 23.3% | 9.3% |
| TF8 (Ironbridge, Coalbrookdale) | 41.1% | 33.9% | 11.5% | 6.1% |
| TF10 (Newport) | 57.4% | 30.6% | 8.0% | 2.9% |
| TF11 (Shifnal) | 51.5% | 32.4% | 10.8% | 4.6% |
TF3 holds the most rentable mix in Telford, with terraced houses at 27.9% and flats at 17.8%, the highest share of both in the borough. That smaller-unit stock is what typically forms the buy-to-let market, and it lines up with TF3 carrying the joint-lowest asking price and the top gross yield. The terraced and flat estates of Madeley and Brookside suit single lets and sharers on modest budgets.
The rural and commuter postcodes sit at the opposite end. TF6 and TF10 are almost entirely houses, with detached and semi-detached stock together accounting for around 88% to 89%, and flats down at 3% or below. The housing here is weighted towards owner-occupier family homes rather than the smaller units that drive rental income, which is consistent with their higher prices and thinner rental markets.
Flats combine purpose-built blocks and converted units, and a small share of mobile and temporary dwellings is not shown, so rows may not total 100%.

Telford Rental Market Analysis
Monthly rents in Telford range from £870 in TF7 to £1,477 in TF10, with gross rental yields from 4.0% to 5.1% across the six postcodes that carry reliable rental data. For investors asking is buy to let worth it in Telford, the sections below break down rents, yields and tenant affordability postcode by postcode. If you are working out how to build a property portfolio in the West Midlands, Telford's low asking prices and faster-growing population offer a different profile from the higher-priced Cheshire and commuter markets. Browse current buy-to-let homes for sale across the region.
Average Rent & Gross Rental Yields in Telford
Gross rental yields in Telford run from 4.0% in TF1 to 5.1% in TF3. The cheapest postcode delivers the highest yield, and the urban core does the work: TF3 and TF7, the two lowest-priced postcodes, sit at the top of the yield table. TF10 (Newport) charges the highest rent at £1,477 a month yet returns 4.9%, because its £360,503 asking price is well above the urban core.
| Area | Average Monthly Rent | Asking Price | Gross Yield |
|---|---|---|---|
| TF3 (Madeley, Brookside) | £917 | £217,508 | 5.1% |
| TF10 (Newport) | £1,477 | £360,503 | 4.9% |
| TF7 (Sutton Hill, Stirchley) | £870 | £217,664 | 4.8% |
| TF2 (Donnington, Priorslee) | £1,000 | £273,335 | 4.4% |
| TF4 (Lawley, Dawley) | £961 | £271,727 | 4.2% |
| TF1 (Wellington, Hadley) | £899 | £267,688 | 4.0% |
| TF8 (Ironbridge, Coalbrookdale) | Not enough data | £367,999 | Not enough data |
| TF5 (Wellington rural) | Not enough data | £412,422 | Not enough data |
| TF11 (Shifnal) | Not enough data | £435,278 | Not enough data |
| TF6 (Admaston, Wrockwardine) | Not enough data | £453,675 | Not enough data |
TF3 at 5.1% combines the joint-lowest asking price with a £917 monthly rent to top the yield table. A 30% deposit of £65,252 gets an investor into the highest-yielding postcode in the borough, in the same Madeley and Brookside estates that the Station Quarter regeneration sits beside.
TF10 is the outlier near the top: Newport is a market town in its own right, north-east of Telford, with the highest rent in the table at £1,477 a month and a 4.9% yield despite a £360,503 asking price. TF1 sits at the bottom on yield at 4.0%, where a £267,688 price and a £899 rent leave the thinnest income return of the six, even though Wellington is one of the busiest sales markets in the borough.
Gross Rental Yield by Postcode
Is Telford Rent High?
Monthly rents in Telford take between 29.0% and 49.2% of the local median gross monthly salary. The widely cited threshold for rent affordability is 30% of gross income. Three of the six postcodes with rental data sit at or just below that line, while TF10's premium Newport rent pushes well above it. The pattern reflects Telford's low local wages: affordable in the urban core, stretched in the dearer market towns.
The median gross weekly salary in Telford is £693.20, which equates to £3,004 per month or £36,044 per year. This is below the West Midlands regional median of £712.50 per week and the Great Britain median of £752.40 per week. Data from the Nomis Labour Market Profile (ASHE 2025).
| Rank | Area | Rent as % of Income |
|---|---|---|
| 1 | TF10 (Newport) | 49.2% |
| 2 | TF2 (Donnington, Priorslee) | 33.3% |
| 3 | TF4 (Lawley, Dawley) | 32.0% |
| 4 | TF3 (Madeley, Brookside) | 30.5% |
| 5 | TF1 (Wellington, Hadley) | 29.9% |
| 6 | TF7 (Sutton Hill, Stirchley) | 29.0% |
| — | TF8 (Ironbridge, Coalbrookdale) | Not enough data |
| — | TF5 (Wellington rural) | Not enough data |
| — | TF11 (Shifnal) | Not enough data |
| — | TF6 (Admaston, Wrockwardine) | Not enough data |
TF7 at 29.0% is the most affordable for tenants. A £870 monthly rent against a £3,004 monthly salary leaves real headroom, and affordable rents tend to mean lower void periods and fewer arrears, because tenants who are not stretched stay longer. TF1 sits just behind at 29.9%, the other postcode inside the 30% line.
TF10 at 49.2% is the least affordable by a wide margin, but the figure needs context. Newport's £1,477 rent is set against the borough-wide median salary, and tenants paying that rent in a separate market town are typically higher earners than the Telford-wide median, rather than single workers on £36,044.
How Big Is Telford's Private Rented Sector?
The private rented sector is deepest in TF11 and TF3, at 32.1% and 30.7% of households, and shallowest in the rural postcodes TF5 and TF6 at 13.5% and 20.2%. The share of homes already rented privately is a guide to the size of the established tenant pool. The table below shows household tenure by postcode.
| Area | Owned Outright | Owned with Mortgage | Private Rented | Social Rented |
|---|---|---|---|---|
| TF11 (Shifnal) | 30.6% | 29.2% | 32.1% | 7.5% |
| TF3 (Madeley, Brookside) | 23.3% | 25.9% | 30.7% | 19.6% |
| TF2 (Donnington, Priorslee) | 28.4% | 31.0% | 23.0% | 16.7% |
| TF7 (Sutton Hill, Stirchley) | 33.1% | 23.2% | 22.2% | 21.1% |
| TF6 (Admaston, Wrockwardine) | 44.1% | 30.6% | 20.2% | 4.6% |
| TF1 (Wellington, Hadley) | 31.6% | 36.3% | 17.0% | 13.6% |
| TF4 (Lawley, Dawley) | 23.8% | 37.5% | 16.6% | 20.7% |
| TF8 (Ironbridge, Coalbrookdale) | 42.6% | 29.0% | 16.0% | 11.7% |
| TF10 (Newport) | 45.1% | 33.3% | 15.7% | 5.7% |
| TF5 (Wellington rural) | 43.9% | 36.2% | 13.5% | 5.2% |
TF11 (Shifnal) and TF3 have the largest private rented sectors in Telford, around 30% of households apiece, but they reach that point from different directions. Shifnal is a commuter village where renting is the way into an expensive market, while TF3's Madeley and Brookside pair a deep private rented share with the borough's highest social-rented figure at 19.6%, the marks of a dense, mixed-tenure urban area. Either way, a larger rented sector points to an active local lettings market and a wider pool of existing tenants.
Only TF1 and TF2 have enough homes advertised to rent to read the rental market with confidence, and in both the balance currently favours landlords. TF1 had around 63 homes on the rental market taking roughly 39 days to let, and TF2 around 36 homes letting in about 61 days, both pointing to quick lets rather than a glut. The other postcodes carry too few rental listings at any one time to read reliably.
Local Housing Allowance Rates in Telford
Every Telford postcode falls within the Shropshire Broad Rental Market Area, where Local Housing Allowance runs from £85.00 a week for a shared room to £224.38 a week for a four-bedroom home. Local Housing Allowance is the maximum housing support a tenant on benefits can claim, so it acts as an effective rent floor for landlords letting to that part of the market. The rates below apply across the whole of Telford. To check the current rate for a specific address, you can use the government's official Local Housing Allowance calculator.
| Property Size | Weekly LHA Rate | Monthly Equivalent |
|---|---|---|
| Shared accommodation | £85.00 | £368 |
| 1 bedroom | £109.32 | £474 |
| 2 bedrooms | £136.93 | £593 |
| 3 bedrooms | £166.85 | £723 |
| 4 bedrooms | £224.38 | £972 |
The two-bedroom LHA rate of £136.93 a week works out at about £593 a month, below the £870 to £1,477 open-market rents recorded across Telford's postcodes. A benefit-backed tenancy at the LHA rate therefore sits under Telford's market rents, and the stock that fits within these rates concentrates in the cheaper urban postcodes such as TF3 and TF7, where both asking prices and rents are lowest. The rates are identical across the borough because they are set across the whole Shropshire market area.
Buy-to-Let Considerations
Are House Prices High in Telford? Price-to-Earnings Ratios
Buying a property in Telford takes between 6.0 and 12.6 times the median annual salary. This is based on the Nomis Labour Market Profile for Telford showing the median gross annual income for Telford residents is £36,044.
The national benchmark for price-to-earnings is 7.4x (England's average sold price of £289,946 divided by the Great Britain median annual salary of £39,125). Two of Telford's ten postcodes, TF3 and TF7 at 6.0x, sit below that national benchmark, meaning they are more affordable relative to local incomes than the England average is relative to national incomes.
| Rank | Area | Price-to-Earnings Ratio |
|---|---|---|
| 1 | TF3 (Madeley, Brookside) | 6.0x |
| 2 | TF7 (Sutton Hill, Stirchley) | 6.0x |
| 3 | TF1 (Wellington, Hadley) | 7.4x |
| 4 | TF4 (Lawley, Dawley) | 7.5x |
| 5 | TF2 (Donnington, Priorslee) | 7.6x |
| 6 | TF10 (Newport) | 10.0x |
| 7 | TF8 (Ironbridge, Coalbrookdale) | 10.2x |
| 8 | TF5 (Wellington rural) | 11.4x |
| 9 | TF11 (Shifnal) | 12.1x |
| 10 | TF6 (Admaston, Wrockwardine) | 12.6x |
TF3 and TF7 at 6.0x are the most affordable entry points in Telford, both below the 7.4x national benchmark. At six times local earnings, these postcodes are competitive with the West Midlands' higher-yielding markets, and they pair that affordability with the borough's strongest five-year growth and highest yields.
TF6 at 12.6x sits at the top of the table, well above the national benchmark. At more than twelve times the local median salary, Admaston and Wrockwardine are firmly in owner-occupier territory, where buyers are typically established families or those moving out from the urban core. For investors, that elevated ratio compresses yields and extends the payback period.
Deposit Requirements in Telford
A 30% deposit on a buy-to-let property in Telford ranges from £65,252 in TF3 to £136,102 in TF6. The gap between the cheapest and most expensive deposit is £70,850, more than a full second deposit in TF3. For investors comparing Telford with other West Midlands locations, the cheapest deposits here sit close to the urban-core deposits in Wolverhampton and Walsall, but below the premium end of either.
Beyond the deposit, the stamp duty calculation and other running costs of buy-to-let affect the total capital required.
| Rank | Area | 30% Deposit Required |
|---|---|---|
| 1 | TF3 (Madeley, Brookside) | £65,252 |
| 2 | TF7 (Sutton Hill, Stirchley) | £65,299 |
| 3 | TF1 (Wellington, Hadley) | £80,306 |
| 4 | TF4 (Lawley, Dawley) | £81,518 |
| 5 | TF2 (Donnington, Priorslee) | £82,000 |
| 6 | TF10 (Newport) | £108,151 |
| 7 | TF8 (Ironbridge, Coalbrookdale) | £110,400 |
| 8 | TF5 (Wellington rural) | £123,727 |
| 9 | TF11 (Shifnal) | £130,583 |
| 10 | TF6 (Admaston, Wrockwardine) | £136,102 |
TF3 and TF7 are the cheapest way into Telford, at deposits of £65,252 and £65,299, effectively level. They are also the two highest-yielding postcodes, so the lowest capital outlay buys the best income return, an unusually clean alignment that rarely holds this neatly. Stepping up to TF1 costs roughly £15,000 more in deposit, and that money buys a busier sales market in Wellington rather than a better yield.
At the top end, the four rural and commuter postcodes all need deposits above £108,000, with TF6 at £136,102 more than double TF3's. These are owner-occupier markets where the higher entry cost buys location and space rather than rental return, which the yield and price-to-earnings tables above bear out.
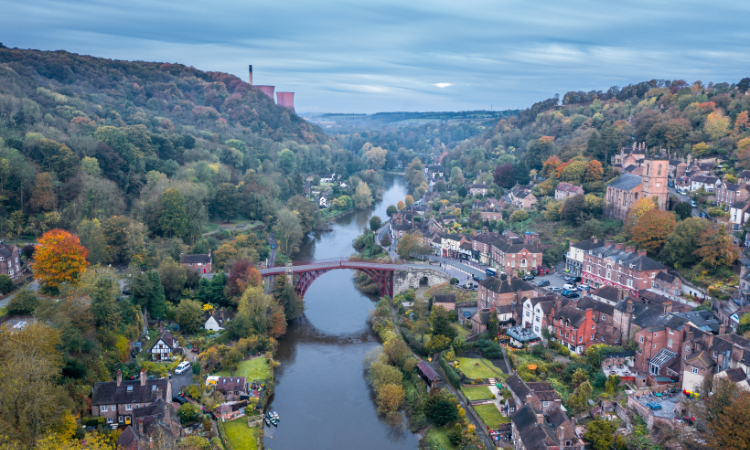
What the Telford Data Tells Buy-to-Let Investors
In Telford the cheapest way in is also the highest-yielding, and the two go together more cleanly than in most markets. TF3 (Madeley, Brookside) has the top yield at 5.1%, the joint-lowest asking price for an investment property in Telford at £217,508, the most affordable price against local earnings at 6.0 times income, and the lowest 30% deposit at £65,252. TF7 sits right alongside it at 4.8% on an almost identical price, and adds the borough's strongest five-year growth at 26.1%.
Those same two urban postcodes also lead on growth and turnover. TF7 and TF3 took the top two five-year growth readings (26.1% and 18.6%) and hold the highest turnover in the borough at 12%, so the affordable core has been both the strongest grower and the most actively traded part of Telford. The Station Quarter regeneration lands directly in TF3, which adds a new town-centre rental segment that did not exist before.
The rural and commuter postcodes read differently. TF6, TF5, TF11 and TF8 carry asking prices above £367,000, price-to-earnings ratios above 10x, and the borough's slowest selling times, with TF8's Ironbridge market showing over 1,000 days on market. TF10 (Newport) is the exception near the top, a separate market town with the highest rent in the borough at £1,477 and a 4.9% yield. Buyers who want to come in below asking often look through below market value property routes, which matters more in the slower-moving outer postcodes.
Telford has no boroughwide selective licensing scheme for private landlords, though HMO licensing applies and the council has consulted on extending it, so landlords should check the current position on the council's property licensing pages. With a fast-growing population, a manufacturing and distribution employment base, and a £300 million council regeneration programme concentrated in the urban core, the borough offers an affordable West Midlands entry point: lower headline yields than the cheapest northern markets, but a low capital outlay and a clear alignment between price, yield and growth in the core postcodes.
How Telford Compares
Telford's mean asking price of £327,780 is the highest of five West Midlands locations compared here, and its top yield of 5.1% sits towards the lower end of the group. The comparison below places Telford alongside four nearby locations, each with a different investor profile. The mean asking price and mean monthly rent are simple averages across all postcodes with data, and the top gross yield is the single highest postcode yield in each location.
| Location | Mean Asking Price | Mean Monthly Rent | Mean Gross Yield | Top Yield (postcode) |
|---|---|---|---|---|
| Stoke-on-Trent | £245,606 | £859 | 4.2% | 6.9% (ST1) |
| Wolverhampton | £255,437 | £986 | 4.6% | 5.5% (WV1) |
| Dudley | £274,570 | £947 | 4.1% | 5.0% (DY4, WV14) |
| Walsall | £284,303 | £1,017 | 4.3% | 6.2% (WS2) |
| Telford | £327,780 | £1,021 | 3.7% | 5.1% (TF3) |
Telford carries the highest mean asking price in this group at £327,780, lifted by its expensive rural and commuter postcodes, even though its cheapest urban postcodes (TF3 and TF7, around £217,500) undercut every postcode average in the table. Its 5.1% top yield sits below the rest of the group on headline income, a reminder that the borough-wide average is pulled up by stock that most investors would not be buying for yield.
For investors prioritising income, Stoke-on-Trent at 6.9% and Walsall at 6.2% deliver higher top-line yields on lower mean prices. Wolverhampton at 5.5% and Dudley at 5.0% sit closer to Telford on yield, in the conurbation rather than out on the Shropshire edge. Telford's pitch is different: a faster-growing population, a low urban-core asking price, and a heavy council regeneration spend, set against a yield that the headline average understates. For a data-driven comparison across all UK locations, see our best places to invest in buy-to-let guide.
Frequently Asked Questions
What are buy-to-let prices, yields and growth in Telford?
The highest measured gross yield is 5.1% in TF3. TF3 and TF7 both have asking-price averages around £217,500, with a 30% deposit just over £65,000. The population grew 11.34% over the last census decade, and the council is partway through a £300 million regeneration programme concentrated in the urban core.
Local wages are below the regional and national averages. The higher-priced outer postcodes have slower recorded selling times, while TF8, TF5, TF11 and TF6 do not have enough rental data for a gross-yield comparison.
What are the best areas in Telford for property investment?
The data points cleanly at the urban core. TF3 (Madeley, Brookside) carries the top yield at 5.1%, the joint-lowest asking price at £217,508 and the strongest one-year growth at 6.2%, while TF7 (Sutton Hill, Stirchley) sits right behind on yield at 4.8% and leads the borough on five-year growth at 26.1%. Both are dense estates of terraced and semi-detached housing, the stock that drives rental demand, and both hold the highest turnover in Telford at 12%.
The rural and commuter postcodes tell the opposite story. TF6, TF5 and TF11 all carry asking prices above £400,000, price-to-earnings ratios above 11x and the slowest selling times. So if yield and growth matter most, the two cheapest postcodes lead; the outer areas are owner-occupier markets where the numbers compress.
How does Telford compare to Wolverhampton for buy-to-let?
They are close on yield but different in character. Wolverhampton has a higher top yield at 5.5% against Telford's 5.1%, on a lower mean asking price of £255,437 versus £327,780, so on the headline averages it looks the cheaper, higher-yielding option. It is also part of the West Midlands conurbation, with the larger, more urban tenant pool that comes with that.
Telford's mean is pulled up by its expensive rural postcodes, but its cheapest urban postcodes (TF3 and TF7 around £217,500) undercut every postcode average in either town. Telford also has the faster-growing population and a concentrated council regeneration spend. The split is between Wolverhampton's conurbation scale and Telford's affordable, growing new-town profile.
Can I find buy-to-let property under £220,000 in Telford?
Yes, in the two cheapest postcodes. TF3 (Madeley, Brookside) at £217,508 and TF7 (Sutton Hill, Stirchley) at £217,664 both average just under £220,000, and they happen to be the two highest-yielding postcodes in the borough at 5.1% and 4.8%. These are the dense urban estates at the heart of the new town, where terraced and semi-detached houses dominate the stock.
Below those averages, the way in is by property type rather than postcode: terraced houses across Telford and Wrekin average £174,757 and flats £98,354 on the Land Registry index. If a sub-£220,000 purchase is the target, TF3 and TF7 terraces are the obvious place to look, or explore below market value property.
Is there demand for student or HMO lets in Telford?
Telford is not a university town in the way Birmingham or Wolverhampton are, so it does not carry the same student rental demand. The borough has further-education provision, including the new college facility coming through the Station Quarter regeneration in TF3, but there is no large undergraduate population driving a shared-house market the way a campus city does.
On the HMO side, the live room-advert sample for Telford's postcodes was too thin to produce a reliable per-room rent figure, which itself tells you the shared-house market here is small. For investors, that points towards standard single lets of the terraced and semi-detached stock rather than HMOs. If you are weighing the shared-house model elsewhere, see our guide to investing in HMOs.
When will the Station Quarter regeneration affect Telford property prices?
It is already under way rather than a distant promise. The £45.7 million Station Quarter scheme is delivering 189 homes and a new college facility into Telford town centre, with the education provision relocating in by autumn 2026, and the wider £300 million programme is targeted for completion by 2027. So the delivery window is the next year or two, not the end of the decade.
The effect to watch is less a price spike and more a new market segment: town-centre living at scale in TF3, which Telford has not really had before. That changes the type of rental stock available in the borough's highest-yielding postcode, rather than lifting prices across the board.
What are average house prices in Telford?
The average sold price across Telford and Wrekin is £223,330 on the Land Registry index, about 23.0% below the England average of £289,946 as of March 2026. Asking prices by postcode run from £217,508 in TF3 (Madeley, Brookside) up to £453,675 in TF6 (Admaston, Wrockwardine), with a borough-wide mean of £327,780. By type, detached homes average £349,558, semi-detached £205,929, terraced £174,757 and flats £98,354.
Through a buy-to-let lens, TF3 is the cheapest entry and the highest-yielding at 5.1%, while the rural postcodes such as TF6 are the dearest and lowest-yielding.
What type of property is most common in Telford?
Houses, by a wide margin, which fits a new town built around family living. Semi-detached and detached homes dominate every postcode, and in the rural areas such as TF6 and TF10 they account for around 88% of the stock between them. That weighting towards houses is why Telford's flat market is so thin and prices so far below the England average for flats.
The smaller homes that usually suit buy-to-let, terraces and flats, cluster in the urban core. TF3 (Madeley, Brookside) holds the most of both at 27.9% terraced and 17.8% flats, the highest shares in the borough, which lines up with TF3 carrying the joint-lowest price and the top yield. If you are buying for rental income, the terraced and semi-detached stock in the urban postcodes is the natural fit.
What are the Local Housing Allowance rates in Telford?
Every Telford postcode falls in the Shropshire Broad Rental Market Area, so they share one set of rates. As of June 2026, Local Housing Allowance runs at £85.00 a week for a shared room, £109.32 for a one-bed, £136.93 for two beds, £166.85 for three and £224.38 for four. That figure is the most a tenant on housing support can claim towards rent, so for that part of the market it effectively sets a floor.
How do I buy an investment property in Telford?
Start by deciding whether you are buying for income or for growth, because in Telford the two line up rather than pulling apart. TF3 (Madeley, Brookside) is the joint-cheapest postcode at £217,508 and the highest-yielding at 5.1%. TF7 (Sutton Hill, Stirchley) sits alongside it on price and leads the borough on five-year growth at 26.1%. Budget for a 30% deposit, which runs from £65,252 in TF3 up to £136,102 in TF6.
Beyond what is listed openly, plenty of experienced investors buy below asking through off market property channels, which matters more in Telford's slower-moving rural postcodes. To see what is available now, browse investment properties or buy-to-let homes for sale.
Ready to buy property?
Browse investment properties with prices and gross yields shown for each opportunity.
Get property alerts