The 18-Year Property Cycle: Where Are We Now?
Between September 2022 and February 2024, England's average house price fell from £290,185 to £276,935. A 4.6% drop. Headlines screamed crash. Investors froze.
By March 2025, the average was back above that peak. On the latest data, for May 2026, it stands at £292,095, 0.7% above the September 2022 high. The correction lasted roughly 17 months, wiped less than 5% off values, and was over before most commentators noticed.
Article updated: August 2026
If you follow the 18-year property cycle, none of this was surprising. The theory says every property cycle since the 1950s has included a mid-cycle dip roughly halfway through. It also says the real pain comes later. The question for 2026 is where we sit, and, as this article gets to, which cycle we are even in.
One thing worth saying upfront. The cycle tells you about timing, and nothing else. It cannot tell you whether a specific deal stacks up. For that, you look at the investment properties for sale right now and run the numbers on each one.
I have been investing in property since 2005. I bought my first rental property two years before the 2007 peak, held through the crash, and watched the full recovery play out over the following decade. That experience colours everything in this article. The cycle is real. The timing is never exact. And anyone who tells you they know the precise year of the next crash is in crystal ball territory.
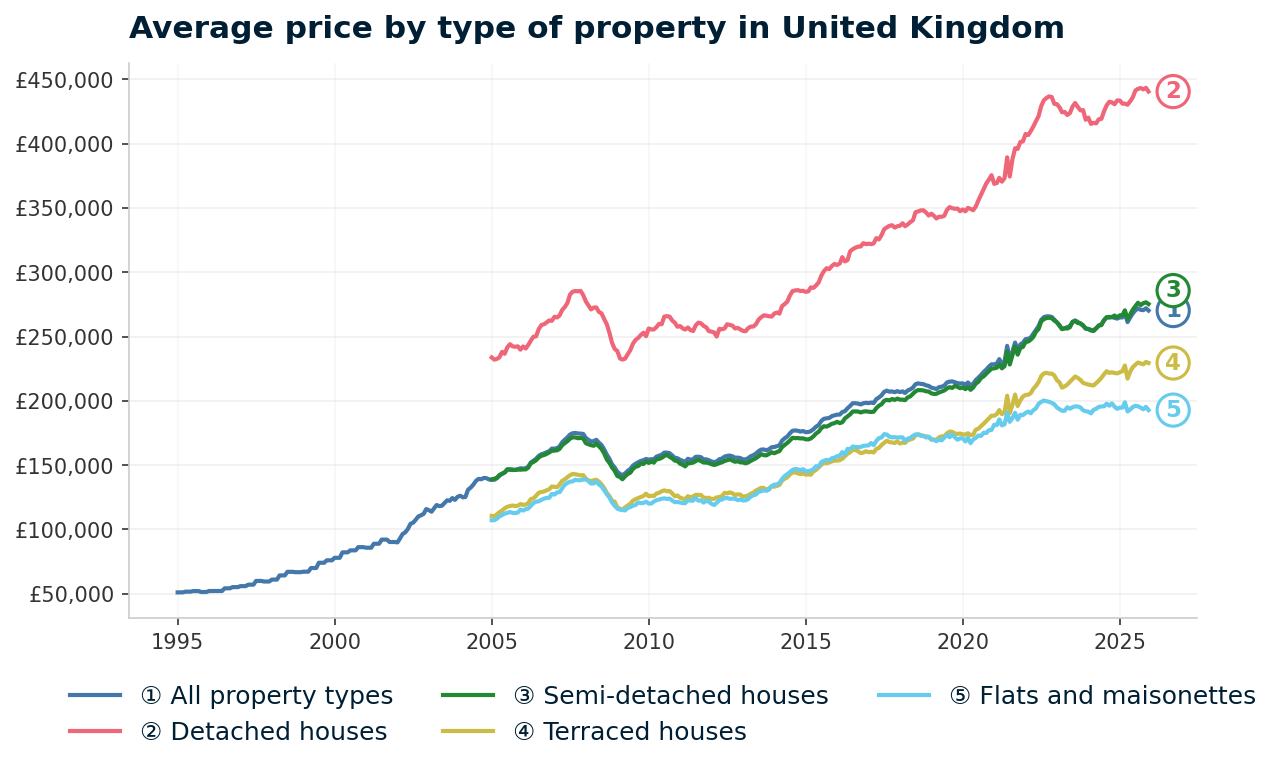
- All property types
- Detached
- Semi-detached
- Terraced
- Flats
Source: HM Land Registry House Price Index
| Month | All property types | Detached | Semi-detached | Terraced | Flats |
|---|---|---|---|---|---|
| 2005-01 | £138,759 | £233,758 | £138,860 | £110,564 | £107,188 |
| 2005-02 | £138,626 | £232,093 | £139,493 | £110,272 | £107,211 |
| 2005-03 | £139,763 | £232,616 | £140,203 | £111,665 | £108,330 |
| 2005-04 | £141,751 | £233,896 | £142,384 | £113,477 | £110,164 |
| 2005-05 | £143,273 | £238,123 | £143,302 | £114,686 | £111,246 |
| 2005-06 | £144,410 | £236,625 | £144,327 | £116,457 | £112,341 |
| 2005-07 | £146,269 | £241,625 | £146,836 | £117,620 | £112,876 |
| 2005-08 | £146,864 | £244,088 | £146,443 | £118,199 | £113,527 |
| 2005-09 | £146,635 | £242,427 | £146,221 | £118,654 | £112,928 |
| 2005-10 | £146,342 | £242,076 | £146,292 | £118,158 | £112,682 |
| 2005-11 | £146,777 | £242,413 | £146,621 | £118,563 | £113,192 |
| 2005-12 | £147,580 | £239,846 | £146,475 | £119,767 | £115,503 |
| 2006-01 | £147,360 | £242,321 | £146,673 | £119,106 | £114,691 |
| 2006-02 | £147,601 | £240,737 | £146,708 | £119,398 | £115,789 |
| 2006-03 | £148,798 | £243,422 | £148,045 | £120,384 | £116,236 |
| 2006-04 | £152,032 | £246,915 | £151,459 | £123,669 | £118,409 |
| 2006-05 | £153,473 | £249,900 | £152,496 | £124,245 | £120,490 |
| 2006-06 | £154,927 | £250,145 | £153,825 | £126,155 | £121,615 |
| 2006-07 | £157,156 | £255,691 | £156,011 | £128,481 | £121,845 |
| 2006-08 | £158,476 | £258,986 | £157,285 | £129,140 | £123,003 |
| 2006-09 | £159,122 | £259,621 | £157,890 | £129,509 | £123,940 |
| 2006-10 | £160,054 | £260,976 | £158,769 | £130,440 | £124,565 |
| 2006-11 | £160,878 | £262,557 | £159,924 | £131,202 | £124,648 |
| 2006-12 | £162,881 | £262,269 | £161,145 | £133,419 | £127,649 |
| 2007-01 | £162,825 | £265,423 | £161,304 | £133,124 | £127,121 |
| 2007-02 | £163,288 | £264,885 | £161,582 | £132,962 | £128,864 |
| 2007-03 | £164,555 | £266,405 | £162,660 | £134,904 | £129,036 |
| 2007-04 | £167,877 | £270,764 | £165,603 | £137,885 | £131,992 |
| 2007-05 | £169,800 | £272,968 | £167,078 | £138,900 | £134,968 |
| 2007-06 | £171,659 | £276,280 | £168,693 | £140,680 | £136,163 |
| 2007-07 | £173,817 | £282,741 | £170,658 | £142,181 | £137,176 |
| 2007-08 | £174,826 | £284,963 | £171,682 | £143,202 | £137,449 |
| 2007-09 | £175,052 | £285,409 | £171,557 | £142,870 | £138,608 |
| 2007-10 | £174,644 | £285,254 | £170,939 | £142,554 | £138,259 |
| 2007-11 | £174,553 | £285,498 | £171,254 | £141,995 | £138,312 |
| 2007-12 | £174,280 | £282,303 | £170,695 | £142,262 | £138,795 |
| 2008-01 | £171,137 | £277,315 | £167,080 | £139,379 | £138,886 |
| 2008-02 | £169,666 | £274,183 | £166,218 | £138,149 | £137,513 |
| 2008-03 | £168,432 | £271,161 | £165,557 | £137,713 | £135,697 |
| 2008-04 | £168,711 | £272,580 | £165,067 | £138,247 | £135,834 |
| 2008-05 | £169,742 | £272,675 | £166,694 | £138,676 | £137,297 |
| 2008-06 | £167,498 | £269,188 | £164,556 | £137,191 | £134,915 |
| 2008-07 | £165,669 | £268,092 | £162,588 | £135,169 | £133,492 |
| 2008-08 | £162,212 | £263,639 | £159,087 | £132,197 | £130,524 |
| 2008-09 | £158,128 | £259,497 | £154,362 | £128,517 | £127,323 |
| 2008-10 | £154,920 | £252,934 | £151,805 | £125,810 | £124,877 |
| 2008-11 | £150,563 | £245,035 | £148,184 | £122,347 | £120,994 |
| 2008-12 | £148,267 | £240,435 | £145,583 | £121,590 | £118,389 |
| 2009-01 | £144,840 | £238,721 | £141,552 | £117,187 | £116,246 |
| 2009-02 | £143,166 | £232,991 | £140,741 | £116,051 | £115,392 |
| 2009-03 | £142,278 | £232,113 | £139,046 | £115,471 | £115,140 |
| 2009-04 | £143,567 | £232,876 | £141,318 | £117,151 | £114,811 |
| 2009-05 | £145,550 | £236,239 | £143,133 | £118,579 | £116,756 |
| 2009-06 | £146,984 | £239,464 | £144,159 | £120,030 | £117,402 |
| 2009-07 | £149,620 | £244,415 | £147,077 | £122,349 | £118,443 |
| 2009-08 | £151,096 | £247,403 | £148,752 | £123,497 | £119,068 |
| 2009-09 | £152,283 | £249,012 | £149,328 | £124,467 | £120,939 |
| 2009-10 | £153,306 | £251,221 | £151,189 | £125,251 | £120,457 |
| 2009-11 | £153,823 | £253,041 | £150,939 | £126,033 | £120,674 |
| 2009-12 | £154,832 | £250,340 | £152,890 | £127,813 | £121,575 |
| 2010-01 | £154,268 | £256,310 | £151,750 | £125,808 | £120,117 |
| 2010-02 | £154,654 | £255,598 | £152,854 | £126,261 | £120,175 |
| 2010-03 | £154,645 | £255,531 | £151,960 | £125,959 | £121,678 |
| 2010-04 | £156,625 | £257,396 | £154,618 | £127,907 | £122,747 |
| 2010-05 | £157,379 | £259,913 | £154,839 | £128,469 | £123,258 |
| 2010-06 | £158,155 | £259,609 | £155,688 | £129,687 | £123,881 |
| 2010-07 | £159,757 | £265,571 | £157,107 | £130,378 | £124,202 |
| 2010-08 | £159,748 | £265,939 | £158,032 | £129,743 | £123,780 |
| 2010-09 | £159,337 | £265,484 | £156,495 | £129,886 | £123,966 |
| 2010-10 | £157,562 | £262,552 | £155,335 | £128,037 | £122,461 |
| 2010-11 | £155,691 | £260,773 | £153,537 | £125,794 | £121,207 |
| 2010-12 | £155,405 | £257,657 | £153,207 | £126,406 | £121,388 |
| 2011-01 | £154,113 | £258,167 | £151,091 | £124,616 | £120,967 |
| 2011-02 | £153,297 | £256,373 | £150,286 | £124,032 | £120,480 |
| 2011-03 | £152,591 | £255,470 | £149,047 | £123,466 | £120,433 |
| 2011-04 | £154,958 | £257,029 | £151,462 | £125,914 | £122,821 |
| 2011-05 | £154,269 | £255,070 | £151,544 | £124,988 | £122,396 |
| 2011-06 | £154,530 | £254,354 | £152,012 | £125,603 | £122,428 |
| 2011-07 | £156,476 | £258,704 | £153,101 | £126,978 | £124,621 |
| 2011-08 | £156,570 | £260,850 | £154,216 | £126,910 | £122,402 |
| 2011-09 | £156,179 | £260,324 | £153,089 | £126,798 | £122,629 |
| 2011-10 | £154,456 | £258,360 | £152,059 | £124,741 | £120,906 |
| 2011-11 | £154,533 | £257,180 | £152,002 | £124,545 | £122,341 |
| 2011-12 | £153,880 | £254,264 | £151,620 | £124,682 | £121,599 |
| 2012-01 | £152,831 | £253,841 | £150,743 | £123,677 | £119,959 |
| 2012-02 | £152,415 | £253,193 | £150,166 | £123,853 | £119,016 |
| 2012-03 | £152,866 | £250,029 | £150,690 | £124,918 | £120,674 |
| 2012-04 | £154,623 | £256,023 | £151,606 | £125,250 | £122,769 |
| 2012-05 | £155,121 | £255,683 | £152,209 | £125,957 | £123,297 |
| 2012-06 | £156,645 | £256,309 | £153,243 | £128,459 | £124,314 |
| 2012-07 | £157,246 | £259,601 | £153,900 | £128,094 | £124,555 |
| 2012-08 | £157,431 | £259,109 | £154,514 | £128,827 | £123,789 |
| 2012-09 | £156,871 | £258,546 | £153,521 | £128,149 | £123,996 |
| 2012-10 | £155,761 | £256,331 | £152,626 | £126,746 | £123,899 |
| 2012-11 | £155,888 | £256,764 | £153,027 | £127,305 | £122,817 |
| 2012-12 | £155,534 | £255,658 | £152,235 | £127,099 | £123,279 |
| 2013-01 | £154,495 | £254,443 | £152,072 | £125,440 | £122,511 |
| 2013-02 | £154,465 | £254,158 | £151,432 | £125,880 | £122,638 |
| 2013-03 | £155,385 | £256,496 | £152,066 | £126,397 | £123,518 |
| 2013-04 | £156,909 | £257,767 | £153,320 | £127,782 | £125,568 |
| 2013-05 | £157,736 | £257,812 | £154,356 | £128,617 | £126,554 |
| 2013-06 | £159,045 | £259,568 | £155,449 | £130,251 | £127,208 |
| 2013-07 | £160,830 | £263,105 | £156,863 | £131,271 | £129,298 |
| 2013-08 | £162,110 | £265,084 | £158,597 | £132,387 | £129,720 |
| 2013-09 | £162,217 | £266,548 | £157,774 | £132,215 | £130,476 |
| 2013-10 | £161,554 | £266,234 | £157,625 | £130,895 | £130,062 |
| 2013-11 | £162,450 | £265,811 | £158,825 | £132,013 | £131,007 |
| 2013-12 | £163,942 | £265,553 | £160,032 | £133,562 | £133,737 |
| 2014-01 | £164,137 | £267,931 | £159,301 | £133,295 | £134,786 |
| 2014-02 | £164,818 | £268,709 | £160,297 | £133,898 | £135,109 |
| 2014-03 | £165,385 | £267,862 | £160,938 | £134,595 | £136,188 |
| 2014-04 | £169,065 | £273,703 | £164,094 | £137,945 | £139,232 |
| 2014-05 | £170,856 | £275,294 | £165,678 | £139,475 | £141,562 |
| 2014-06 | £172,331 | £277,219 | £167,346 | £140,558 | £142,976 |
| 2014-07 | £174,755 | £281,993 | £169,194 | £142,776 | £144,660 |
| 2014-08 | £176,803 | £285,402 | £171,265 | £144,329 | £146,370 |
| 2014-09 | £176,993 | £285,901 | £171,004 | £144,384 | £147,042 |
| 2014-10 | £176,731 | £286,134 | £171,108 | £143,670 | £146,770 |
| 2014-11 | £176,137 | £285,465 | £170,810 | £143,051 | £145,995 |
| 2014-12 | £176,561 | £285,637 | £170,826 | £143,537 | £146,881 |
| 2015-01 | £175,636 | £284,767 | £170,140 | £142,617 | £145,249 |
| 2015-02 | £175,785 | £285,237 | £170,045 | £142,852 | £145,326 |
| 2015-03 | £176,439 | £288,243 | £170,768 | £142,553 | £145,834 |
| 2015-04 | £177,994 | £287,903 | £172,442 | £145,051 | £146,808 |
| 2015-05 | £179,917 | £289,749 | £174,617 | £146,378 | £149,215 |
| 2015-06 | £181,289 | £292,231 | £176,069 | £148,223 | £148,917 |
| 2015-07 | £184,365 | £297,356 | £178,752 | £150,286 | £152,377 |
| 2015-08 | £186,053 | £300,930 | £180,271 | £151,657 | £153,373 |
| 2015-09 | £186,435 | £303,202 | £179,973 | £151,509 | £154,125 |
| 2015-10 | £186,689 | £302,480 | £180,942 | £152,067 | £153,677 |
| 2015-11 | £188,125 | £304,885 | £182,204 | £152,950 | £155,401 |
| 2015-12 | £188,767 | £306,477 | £182,676 | £153,491 | £155,726 |
| 2016-01 | £189,268 | £305,706 | £183,727 | £153,558 | £157,021 |
| 2016-02 | £189,352 | £306,870 | £182,712 | £153,921 | £157,238 |
| 2016-03 | £191,298 | £311,772 | £183,356 | £154,879 | £160,155 |
| 2016-04 | £192,013 | £308,453 | £186,373 | £157,025 | £158,469 |
| 2016-05 | £194,250 | £309,488 | £187,902 | £158,886 | £162,653 |
| 2016-06 | £196,106 | £316,390 | £189,523 | £160,045 | £162,429 |
| 2016-07 | £198,169 | £317,974 | £191,763 | £162,042 | £164,483 |
| 2016-08 | £198,186 | £319,156 | £191,823 | £161,779 | £164,138 |
| 2016-09 | £197,883 | £319,920 | £191,706 | £160,811 | £164,008 |
| 2016-10 | £197,230 | £320,109 | £191,002 | £159,377 | £164,169 |
| 2016-11 | £198,157 | £322,661 | £191,669 | £159,825 | £165,017 |
| 2016-12 | £198,513 | £321,919 | £191,877 | £160,807 | £165,218 |
| 2017-01 | £198,276 | £322,264 | £191,638 | £160,078 | £165,412 |
| 2017-02 | £198,695 | £321,868 | £191,338 | £160,415 | £167,195 |
| 2017-03 | £198,270 | £322,517 | £191,581 | £159,865 | £165,614 |
| 2017-04 | £201,407 | £326,588 | £194,302 | £162,687 | £168,766 |
| 2017-05 | £202,616 | £325,557 | £196,247 | £163,459 | £171,019 |
| 2017-06 | £204,347 | £328,979 | £197,369 | £165,651 | £171,539 |
| 2017-07 | £207,005 | £333,466 | £200,043 | £167,413 | £174,104 |
| 2017-08 | £207,944 | £334,961 | £200,808 | £168,998 | £173,852 |
| 2017-09 | £207,167 | £336,145 | £200,368 | £167,901 | £172,081 |
| 2017-10 | £207,349 | £336,616 | £201,450 | £167,687 | £171,660 |
| 2017-11 | £206,760 | £334,785 | £200,765 | £167,248 | £171,759 |
| 2017-12 | £207,568 | £335,813 | £201,764 | £168,529 | £171,454 |
| 2018-01 | £206,844 | £336,194 | £200,951 | £166,829 | £171,670 |
| 2018-02 | £207,385 | £338,128 | £200,987 | £167,590 | £171,565 |
| 2018-03 | £206,133 | £335,868 | £200,552 | £167,283 | £168,819 |
| 2018-04 | £208,103 | £337,203 | £202,697 | £169,403 | £170,620 |
| 2018-05 | £208,953 | £339,021 | £203,510 | £169,982 | £171,220 |
| 2018-06 | £210,355 | £340,433 | £205,504 | £170,707 | £172,765 |
| 2018-07 | £212,963 | £346,741 | £207,428 | £173,102 | £173,939 |
| 2018-08 | £213,618 | £347,348 | £208,390 | £174,055 | £173,823 |
| 2018-09 | £213,210 | £348,170 | £208,303 | £173,316 | £172,789 |
| 2018-10 | £212,986 | £348,234 | £208,131 | £172,719 | £172,855 |
| 2018-11 | £212,077 | £346,482 | £207,450 | £172,383 | £171,506 |
| 2018-12 | £211,621 | £344,161 | £207,273 | £171,722 | £172,195 |
| 2019-01 | £210,317 | £345,600 | £205,889 | £169,823 | £170,228 |
| 2019-02 | £209,787 | £343,862 | £205,338 | £169,909 | £169,641 |
| 2019-03 | £209,202 | £341,874 | £205,497 | £169,634 | £168,673 |
| 2019-04 | £210,718 | £343,256 | £206,575 | £171,695 | £169,883 |
| 2019-05 | £211,005 | £343,139 | £207,284 | £172,395 | £169,323 |
| 2019-06 | £211,915 | £343,983 | £208,110 | £172,523 | £171,409 |
| 2019-07 | £214,282 | £348,464 | £209,662 | £174,701 | £173,470 |
| 2019-08 | £214,971 | £350,717 | £210,652 | £176,123 | £171,729 |
| 2019-09 | £215,127 | £349,891 | £210,073 | £175,848 | £173,965 |
| 2019-10 | £214,559 | £349,418 | £211,678 | £174,672 | £171,697 |
| 2019-11 | £213,801 | £349,599 | £210,905 | £174,337 | £169,841 |
| 2019-12 | £213,521 | £347,500 | £209,889 | £174,572 | £170,849 |
| 2020-01 | £213,657 | £348,846 | £210,423 | £173,898 | £170,893 |
| 2020-02 | £212,429 | £347,424 | £209,114 | £173,754 | £168,422 |
| 2020-03 | £214,344 | £350,069 | £210,729 | £174,807 | £171,323 |
| 2020-04 | £212,160 | £349,349 | £208,589 | £173,401 | £167,166 |
| 2020-05 | £213,258 | £348,263 | £210,384 | £173,677 | £169,943 |
| 2020-06 | £216,208 | £351,174 | £213,386 | £177,612 | £171,258 |
| 2020-07 | £218,030 | £355,875 | £214,872 | £178,313 | £173,065 |
| 2020-08 | £220,163 | £360,301 | £217,785 | £180,370 | £172,723 |
| 2020-09 | £222,511 | £364,877 | £219,118 | £182,299 | £175,269 |
| 2020-10 | £224,377 | £369,094 | £221,160 | £184,359 | £175,007 |
| 2020-11 | £226,675 | £372,148 | £223,145 | £186,531 | £177,205 |
| 2020-12 | £228,446 | £375,535 | £225,075 | £188,462 | £177,402 |
| 2021-01 | £228,417 | £368,824 | £225,294 | £188,443 | £181,428 |
| 2021-02 | £229,067 | £369,450 | £225,832 | £189,791 | £181,179 |
| 2021-03 | £232,463 | £373,463 | £228,375 | £192,865 | £185,555 |
| 2021-04 | £228,979 | £370,490 | £225,303 | £189,668 | £180,913 |
| 2021-05 | £230,532 | £373,176 | £227,004 | £190,961 | £181,789 |
| 2021-06 | £242,777 | £389,414 | £238,313 | £204,019 | £190,695 |
| 2021-07 | £231,386 | £374,500 | £228,280 | £190,492 | £183,693 |
| 2021-08 | £238,403 | £387,872 | £235,488 | £196,854 | £186,631 |
| 2021-09 | £245,371 | £396,472 | £242,303 | £204,933 | £190,714 |
| 2021-10 | £239,236 | £395,985 | £235,955 | £195,984 | £185,361 |
| 2021-11 | £243,930 | £401,306 | £241,243 | £200,299 | £189,152 |
| 2021-12 | £245,189 | £401,833 | £241,958 | £203,365 | £188,911 |
| 2022-01 | £248,031 | £407,538 | £245,846 | £204,616 | £190,631 |
| 2022-02 | £248,309 | £406,772 | £246,185 | £204,836 | £191,682 |
| 2022-03 | £249,232 | £409,709 | £247,572 | £205,850 | £190,362 |
| 2022-04 | £252,167 | £413,384 | £249,718 | £209,367 | £192,739 |
| 2022-05 | £255,040 | £417,496 | £253,740 | £211,588 | £194,145 |
| 2022-06 | £258,118 | £421,461 | £255,862 | £214,628 | £197,725 |
| 2022-07 | £262,904 | £429,129 | £261,757 | £219,180 | £199,200 |
| 2022-08 | £265,124 | £433,757 | £263,509 | £221,347 | £200,246 |
| 2022-09 | £265,727 | £435,575 | £264,400 | £221,813 | £199,792 |
| 2022-10 | £265,693 | £436,814 | £264,669 | £221,236 | £199,280 |
| 2022-11 | £265,299 | £436,328 | £264,298 | £221,174 | £198,448 |
| 2022-12 | £263,190 | £431,009 | £262,450 | £219,801 | £197,324 |
| 2023-01 | £260,941 | £430,764 | £261,086 | £216,073 | £194,805 |
| 2023-02 | £258,788 | £428,190 | £258,204 | £214,287 | £193,426 |
| 2023-03 | £255,885 | £424,426 | £255,807 | £210,299 | £192,269 |
| 2023-04 | £256,479 | £424,716 | £256,474 | £211,281 | £192,356 |
| 2023-05 | £257,330 | £422,381 | £256,263 | £212,695 | £195,037 |
| 2023-06 | £258,275 | £423,828 | £257,278 | £214,878 | £193,937 |
| 2023-07 | £261,182 | £428,922 | £261,565 | £216,925 | £195,054 |
| 2023-08 | £262,602 | £431,657 | £262,101 | £218,944 | £195,719 |
| 2023-09 | £261,318 | £428,518 | £260,519 | £217,842 | £195,619 |
| 2023-10 | £260,129 | £425,957 | £260,280 | £216,282 | £194,826 |
| 2023-11 | £258,368 | £426,134 | £258,799 | £214,014 | £192,701 |
| 2023-12 | £256,177 | £418,631 | £256,370 | £213,287 | £191,890 |
| 2024-01 | £255,972 | £420,315 | £255,737 | £212,711 | £191,646 |
| 2024-02 | £254,633 | £415,397 | £255,295 | £212,262 | £190,328 |
| 2024-03 | £255,082 | £416,298 | £254,265 | £211,943 | £193,000 |
| 2024-04 | £256,478 | £415,853 | £256,304 | £213,888 | £193,853 |
| 2024-05 | £258,565 | £419,008 | £258,606 | £215,670 | £195,274 |
| 2024-06 | £259,585 | £419,358 | £258,910 | £217,952 | £195,694 |
| 2024-07 | £262,479 | £425,199 | £262,908 | £220,655 | £195,740 |
| 2024-08 | £265,085 | £429,838 | £264,929 | £223,062 | £197,803 |
| 2024-09 | £264,750 | £432,642 | £265,344 | £221,758 | £196,260 |
| 2024-10 | £265,252 | £432,134 | £265,132 | £222,232 | £198,015 |
| 2024-11 | £264,515 | £430,747 | £266,381 | £221,701 | £195,408 |
| 2024-12 | £263,991 | £433,653 | £264,927 | £221,372 | £193,853 |
| 2025-01 | £264,936 | £433,587 | £266,530 | £222,203 | £194,677 |
| 2025-02 | £264,771 | £431,405 | £266,300 | £222,890 | £194,706 |
| 2025-03 | £268,019 | £430,077 | £269,386 | £227,171 | £199,186 |
| 2025-04 | £260,162 | £427,892 | £261,888 | £216,126 | £192,319 |
| 2025-05 | £264,078 | £431,479 | £265,527 | £221,455 | £194,620 |
| 2025-06 | £266,865 | £434,780 | £268,402 | £224,336 | £196,648 |
| 2025-07 | £269,050 | £438,581 | £270,922 | £226,472 | £197,433 |
| 2025-08 | £271,013 | £442,059 | £273,816 | £228,652 | £197,156 |
| 2025-09 | £270,124 | £442,621 | £272,799 | £228,102 | £195,294 |
| 2025-10 | £271,441 | £445,652 | £275,679 | £228,732 | £194,771 |
| 2025-11 | £271,787 | £445,356 | £275,519 | £229,920 | £194,963 |
| 2025-12 | £269,255 | £440,861 | £273,298 | £227,938 | £192,803 |
| 2026-01 | £268,708 | £439,124 | £273,507 | £227,776 | £191,762 |
| 2026-02 | £269,114 | £441,987 | £274,653 | £227,511 | £190,717 |
| 2026-03 | £269,112 | £441,746 | £274,866 | £228,170 | £189,846 |
| 2026-04 | £270,435 | £441,974 | £275,870 | £228,626 | £193,072 |
| 2026-05 | £271,295 | £444,892 | £277,358 | £229,445 | £192,046 |
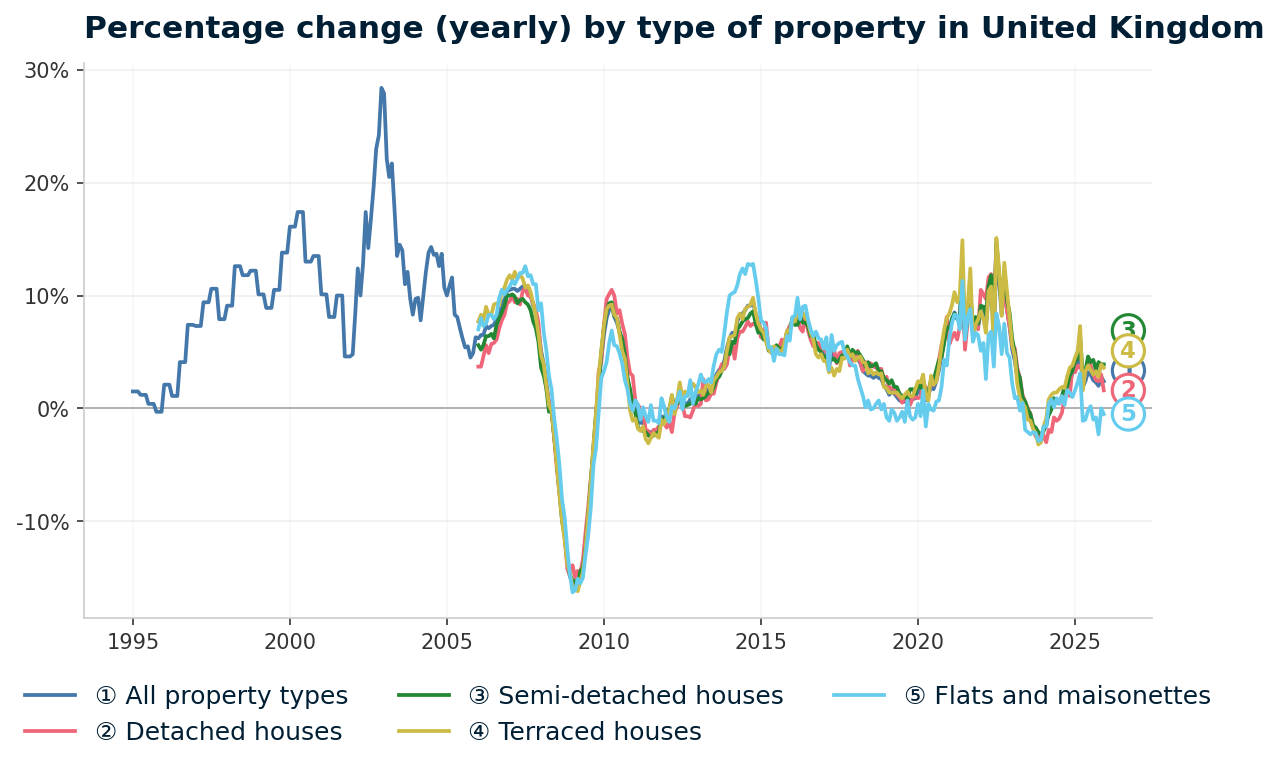
- All property types
- Detached
- Semi-detached
- Terraced
- Flats
Source: HM Land Registry House Price Index
| Month | All property types | Detached | Semi-detached | Terraced | Flats |
|---|---|---|---|---|---|
| 2006-01 | +6.2% | +3.7% | +5.6% | +7.7% | +7.0% |
| 2006-02 | +6.5% | +3.7% | +5.2% | +8.3% | +8.0% |
| 2006-03 | +6.5% | +4.6% | +5.6% | +7.8% | +7.3% |
| 2006-04 | +7.3% | +5.6% | +6.4% | +9.0% | +7.5% |
| 2006-05 | +7.1% | +4.9% | +6.4% | +8.3% | +8.3% |
| 2006-06 | +7.3% | +5.7% | +6.6% | +8.3% | +8.3% |
| 2006-07 | +7.4% | +5.8% | +6.2% | +9.2% | +7.9% |
| 2006-08 | +7.9% | +6.1% | +7.4% | +9.3% | +8.3% |
| 2006-09 | +8.5% | +7.1% | +8.0% | +9.1% | +9.8% |
| 2006-10 | +9.4% | +7.8% | +8.5% | +10.4% | +10.5% |
| 2006-11 | +9.6% | +8.3% | +9.1% | +10.7% | +10.1% |
| 2006-12 | +10.4% | +9.3% | +10.0% | +11.4% | +10.5% |
| 2007-01 | +10.5% | +9.5% | +10.0% | +11.8% | +10.8% |
| 2007-02 | +10.6% | +10.0% | +10.1% | +11.4% | +11.3% |
| 2007-03 | +10.6% | +9.4% | +9.9% | +12.1% | +11.0% |
| 2007-04 | +10.4% | +9.7% | +9.3% | +11.5% | +11.5% |
| 2007-05 | +10.6% | +9.2% | +9.6% | +11.8% | +12.0% |
| 2007-06 | +10.8% | +10.4% | +9.7% | +11.5% | +12.0% |
| 2007-07 | +10.6% | +10.6% | +9.4% | +10.7% | +12.6% |
| 2007-08 | +10.3% | +10.0% | +9.2% | +10.9% | +11.7% |
| 2007-09 | +10.0% | +9.9% | +8.7% | +10.3% | +11.8% |
| 2007-10 | +9.1% | +9.3% | +7.7% | +9.3% | +11.0% |
| 2007-11 | +8.5% | +8.7% | +7.1% | +8.2% | +11.0% |
| 2007-12 | +7.0% | +7.6% | +5.9% | +6.6% | +8.7% |
| 2008-01 | +5.1% | +4.5% | +3.6% | +4.7% | +9.3% |
| 2008-02 | +3.9% | +3.5% | +2.9% | +3.9% | +6.7% |
| 2008-03 | +2.4% | +1.8% | +1.8% | +2.1% | +5.2% |
| 2008-04 | +0.5% | +0.7% | -0.3% | +0.3% | +2.9% |
| 2008-05 | 0.0% | -0.1% | -0.2% | -0.2% | +1.7% |
| 2008-06 | -2.4% | -2.6% | -2.5% | -2.5% | -0.9% |
| 2008-07 | -4.7% | -5.2% | -4.7% | -4.9% | -2.7% |
| 2008-08 | -7.2% | -7.5% | -7.3% | -7.7% | -5.0% |
| 2008-09 | -9.7% | -9.1% | -10.0% | -10.0% | -8.1% |
| 2008-10 | -11.3% | -11.3% | -11.2% | -11.7% | -9.7% |
| 2008-11 | -13.7% | -14.2% | -13.5% | -13.8% | -12.5% |
| 2008-12 | -14.9% | -14.8% | -14.7% | -14.5% | -14.7% |
| 2009-01 | -15.4% | -13.9% | -15.3% | -15.9% | -16.3% |
| 2009-02 | -15.6% | -15.0% | -15.3% | -16.0% | -16.1% |
| 2009-03 | -15.5% | -14.4% | -16.0% | -16.2% | -15.1% |
| 2009-04 | -14.9% | -14.6% | -14.4% | -15.3% | -15.5% |
| 2009-05 | -14.3% | -13.4% | -14.1% | -14.5% | -15.0% |
| 2009-06 | -12.2% | -11.0% | -12.4% | -12.5% | -13.0% |
| 2009-07 | -9.7% | -8.8% | -9.5% | -9.5% | -11.3% |
| 2009-08 | -6.9% | -6.2% | -6.5% | -6.6% | -8.8% |
| 2009-09 | -3.7% | -4.0% | -3.3% | -3.2% | -5.0% |
| 2009-10 | -1.0% | -0.7% | -0.4% | -0.4% | -3.5% |
| 2009-11 | +2.2% | +3.3% | +1.9% | +3.0% | -0.3% |
| 2009-12 | +4.4% | +4.1% | +5.0% | +5.1% | +2.7% |
| 2010-01 | +6.5% | +7.4% | +7.2% | +7.4% | +3.3% |
| 2010-02 | +8.0% | +9.7% | +8.6% | +8.8% | +4.1% |
| 2010-03 | +8.7% | +10.1% | +9.3% | +9.1% | +5.7% |
| 2010-04 | +9.1% | +10.5% | +9.4% | +9.2% | +6.9% |
| 2010-05 | +8.1% | +10.0% | +8.2% | +8.3% | +5.6% |
| 2010-06 | +7.6% | +8.4% | +8.0% | +8.0% | +5.5% |
| 2010-07 | +6.8% | +8.7% | +6.8% | +6.6% | +4.9% |
| 2010-08 | +5.7% | +7.5% | +6.2% | +5.1% | +4.0% |
| 2010-09 | +4.6% | +6.6% | +4.8% | +4.4% | +2.5% |
| 2010-10 | +2.8% | +4.5% | +2.7% | +2.2% | +1.7% |
| 2010-11 | +1.2% | +3.1% | +1.7% | -0.2% | +0.4% |
| 2010-12 | +0.4% | +2.9% | +0.2% | -1.1% | -0.2% |
| 2011-01 | -0.1% | +0.7% | -0.4% | -0.9% | +0.7% |
| 2011-02 | -0.9% | +0.3% | -1.7% | -1.8% | +0.3% |
| 2011-03 | -1.3% | 0.0% | -1.9% | -2.0% | -1.0% |
| 2011-04 | -1.1% | -0.1% | -2.0% | -1.6% | +0.1% |
| 2011-05 | -2.0% | -1.9% | -2.1% | -2.7% | -0.7% |
| 2011-06 | -2.3% | -2.0% | -2.4% | -3.1% | -1.2% |
| 2011-07 | -2.1% | -2.6% | -2.5% | -2.6% | +0.3% |
| 2011-08 | -2.0% | -1.9% | -2.4% | -2.2% | -1.1% |
| 2011-09 | -2.0% | -1.9% | -2.2% | -2.4% | -1.1% |
| 2011-10 | -2.0% | -1.6% | -2.1% | -2.6% | -1.3% |
| 2011-11 | -0.7% | -1.4% | -1.0% | -1.0% | +0.9% |
| 2011-12 | -1.0% | -1.3% | -1.0% | -1.4% | +0.2% |
| 2012-01 | -0.8% | -1.7% | -0.2% | -0.8% | -0.8% |
| 2012-02 | -0.6% | -1.2% | -0.1% | -0.1% | -1.2% |
| 2012-03 | +0.2% | -2.1% | +1.1% | +1.2% | +0.2% |
| 2012-04 | -0.2% | -0.4% | +0.1% | -0.5% | 0.0% |
| 2012-05 | +0.6% | +0.2% | +0.4% | +0.8% | +0.7% |
| 2012-06 | +1.4% | +0.8% | +0.8% | +2.3% | +1.5% |
| 2012-07 | +0.5% | +0.3% | +0.5% | +0.9% | -0.1% |
| 2012-08 | +0.5% | -0.7% | +0.2% | +1.5% | +1.1% |
| 2012-09 | +0.4% | -0.7% | +0.3% | +1.1% | +1.1% |
| 2012-10 | +0.8% | -0.8% | +0.4% | +1.6% | +2.5% |
| 2012-11 | +0.9% | -0.2% | +0.7% | +2.2% | +0.4% |
| 2012-12 | +1.1% | +0.5% | +0.4% | +1.9% | +1.4% |
| 2013-01 | +1.1% | +0.2% | +0.9% | +1.4% | +2.1% |
| 2013-02 | +1.3% | +0.4% | +0.8% | +1.6% | +3.0% |
| 2013-03 | +1.6% | +2.6% | +0.9% | +1.2% | +2.4% |
| 2013-04 | +1.5% | +0.7% | +1.1% | +2.0% | +2.3% |
| 2013-05 | +1.7% | +0.8% | +1.4% | +2.1% | +2.6% |
| 2013-06 | +1.5% | +1.3% | +1.4% | +1.4% | +2.3% |
| 2013-07 | +2.3% | +1.3% | +1.9% | +2.5% | +3.8% |
| 2013-08 | +3.0% | +2.3% | +2.6% | +2.8% | +4.8% |
| 2013-09 | +3.4% | +3.1% | +2.8% | +3.2% | +5.2% |
| 2013-10 | +3.7% | +3.9% | +3.3% | +3.3% | +5.0% |
| 2013-11 | +4.2% | +3.5% | +3.8% | +3.7% | +6.7% |
| 2013-12 | +5.4% | +3.9% | +5.1% | +5.1% | +8.5% |
| 2014-01 | +6.2% | +5.3% | +4.8% | +6.3% | +10.0% |
| 2014-02 | +6.7% | +5.7% | +5.9% | +6.4% | +10.2% |
| 2014-03 | +6.4% | +4.4% | +5.8% | +6.5% | +10.3% |
| 2014-04 | +7.7% | +6.2% | +7.0% | +8.0% | +10.9% |
| 2014-05 | +8.3% | +6.8% | +7.3% | +8.4% | +11.9% |
| 2014-06 | +8.4% | +6.8% | +7.7% | +7.9% | +12.4% |
| 2014-07 | +8.7% | +7.2% | +7.9% | +8.8% | +11.9% |
| 2014-08 | +9.1% | +7.7% | +8.0% | +9.0% | +12.8% |
| 2014-09 | +9.1% | +7.3% | +8.4% | +9.2% | +12.7% |
| 2014-10 | +9.4% | +7.5% | +8.6% | +9.8% | +12.8% |
| 2014-11 | +8.4% | +7.4% | +7.5% | +8.4% | +11.4% |
| 2014-12 | +7.7% | +7.6% | +6.7% | +7.5% | +9.8% |
| 2015-01 | +7.0% | +6.3% | +6.8% | +7.0% | +7.8% |
| 2015-02 | +6.7% | +6.2% | +6.1% | +6.7% | +7.6% |
| 2015-03 | +6.7% | +7.6% | +6.1% | +5.9% | +7.1% |
| 2015-04 | +5.3% | +5.2% | +5.1% | +5.2% | +5.4% |
| 2015-05 | +5.3% | +5.3% | +5.4% | +4.9% | +5.4% |
| 2015-06 | +5.2% | +5.4% | +5.2% | +5.5% | +4.2% |
| 2015-07 | +5.5% | +5.4% | +5.6% | +5.3% | +5.3% |
| 2015-08 | +5.2% | +5.4% | +5.3% | +5.1% | +4.8% |
| 2015-09 | +5.3% | +6.1% | +5.2% | +4.9% | +4.8% |
| 2015-10 | +5.6% | +5.7% | +5.7% | +5.8% | +4.7% |
| 2015-11 | +6.8% | +6.8% | +6.7% | +6.9% | +6.4% |
| 2015-12 | +6.9% | +7.3% | +6.9% | +6.9% | +6.0% |
| 2016-01 | +7.8% | +7.4% | +8.0% | +7.7% | +8.1% |
| 2016-02 | +7.7% | +7.6% | +7.4% | +7.7% | +8.2% |
| 2016-03 | +8.4% | +8.2% | +7.4% | +8.6% | +9.8% |
| 2016-04 | +7.9% | +7.1% | +8.1% | +8.3% | +7.9% |
| 2016-05 | +8.0% | +6.8% | +7.6% | +8.5% | +9.0% |
| 2016-06 | +8.2% | +8.3% | +7.6% | +8.0% | +9.1% |
| 2016-07 | +7.5% | +6.9% | +7.3% | +7.8% | +7.9% |
| 2016-08 | +6.5% | +6.1% | +6.4% | +6.7% | +7.0% |
| 2016-09 | +6.1% | +5.5% | +6.5% | +6.1% | +6.4% |
| 2016-10 | +5.6% | +5.8% | +5.6% | +4.8% | +6.8% |
| 2016-11 | +5.3% | +5.8% | +5.2% | +4.5% | +6.2% |
| 2016-12 | +5.2% | +5.0% | +5.0% | +4.8% | +6.1% |
| 2017-01 | +4.8% | +5.4% | +4.3% | +4.2% | +5.3% |
| 2017-02 | +4.9% | +4.9% | +4.7% | +4.2% | +6.3% |
| 2017-03 | +3.6% | +3.4% | +4.5% | +3.2% | +3.4% |
| 2017-04 | +4.9% | +5.9% | +4.3% | +3.6% | +6.5% |
| 2017-05 | +4.3% | +5.2% | +4.4% | +2.9% | +5.1% |
| 2017-06 | +4.2% | +4.0% | +4.1% | +3.5% | +5.6% |
| 2017-07 | +4.5% | +4.9% | +4.3% | +3.3% | +5.8% |
| 2017-08 | +4.9% | +5.0% | +4.7% | +4.5% | +5.9% |
| 2017-09 | +4.7% | +5.1% | +4.5% | +4.4% | +4.9% |
| 2017-10 | +5.1% | +5.2% | +5.5% | +5.2% | +4.6% |
| 2017-11 | +4.3% | +3.8% | +4.7% | +4.6% | +4.1% |
| 2017-12 | +4.6% | +4.3% | +5.2% | +4.8% | +3.8% |
| 2018-01 | +4.3% | +4.3% | +4.9% | +4.2% | +3.8% |
| 2018-02 | +4.4% | +5.1% | +5.0% | +4.5% | +2.6% |
| 2018-03 | +4.0% | +4.1% | +4.7% | +4.6% | +1.9% |
| 2018-04 | +3.3% | +3.3% | +4.3% | +4.1% | +1.1% |
| 2018-05 | +3.1% | +4.1% | +3.7% | +4.0% | +0.1% |
| 2018-06 | +2.9% | +3.5% | +4.1% | +3.1% | +0.7% |
| 2018-07 | +2.9% | +4.0% | +3.7% | +3.4% | -0.1% |
| 2018-08 | +2.7% | +3.7% | +3.8% | +3.0% | 0.0% |
| 2018-09 | +2.9% | +3.6% | +4.0% | +3.2% | +0.4% |
| 2018-10 | +2.7% | +3.5% | +3.3% | +3.0% | +0.7% |
| 2018-11 | +2.6% | +3.5% | +3.3% | +3.1% | -0.1% |
| 2018-12 | +2.0% | +2.5% | +2.7% | +1.9% | +0.4% |
| 2019-01 | +1.7% | +2.8% | +2.5% | +1.8% | -0.8% |
| 2019-02 | +1.2% | +1.7% | +2.2% | +1.4% | -1.1% |
| 2019-03 | +1.5% | +1.8% | +2.5% | +1.4% | -0.1% |
| 2019-04 | +1.3% | +1.8% | +1.9% | +1.4% | -0.4% |
| 2019-05 | +1.0% | +1.2% | +1.9% | +1.4% | -1.1% |
| 2019-06 | +0.7% | +1.0% | +1.3% | +1.1% | -0.8% |
| 2019-07 | +0.6% | +0.5% | +1.1% | +0.9% | -0.3% |
| 2019-08 | +0.6% | +1.0% | +1.1% | +1.2% | -1.2% |
| 2019-09 | +0.9% | +0.5% | +0.8% | +1.5% | +0.7% |
| 2019-10 | +0.7% | +0.3% | +1.7% | +1.1% | -0.7% |
| 2019-11 | +0.8% | +0.9% | +1.7% | +1.1% | -1.0% |
| 2019-12 | +0.9% | +1.0% | +1.3% | +1.7% | -0.8% |
| 2020-01 | +1.6% | +0.9% | +2.2% | +2.4% | +0.4% |
| 2020-02 | +1.3% | +1.0% | +1.8% | +2.3% | -0.7% |
| 2020-03 | +2.5% | +2.4% | +2.5% | +3.0% | +1.6% |
| 2020-04 | +0.7% | +1.8% | +1.0% | +1.0% | -1.6% |
| 2020-05 | +1.1% | +1.5% | +1.5% | +0.7% | +0.4% |
| 2020-06 | +2.0% | +2.1% | +2.5% | +2.9% | -0.1% |
| 2020-07 | +1.7% | +2.1% | +2.5% | +2.1% | -0.2% |
| 2020-08 | +2.4% | +2.7% | +3.4% | +2.4% | +0.6% |
| 2020-09 | +3.4% | +4.3% | +4.3% | +3.7% | +0.7% |
| 2020-10 | +4.6% | +5.6% | +4.5% | +5.5% | +1.9% |
| 2020-11 | +6.0% | +6.5% | +5.8% | +7.0% | +4.3% |
| 2020-12 | +7.0% | +8.1% | +7.2% | +8.0% | +3.8% |
| 2021-01 | +6.9% | +5.7% | +7.1% | +8.4% | +6.2% |
| 2021-02 | +7.8% | +6.3% | +8.0% | +9.2% | +7.6% |
| 2021-03 | +8.5% | +6.7% | +8.4% | +10.3% | +8.3% |
| 2021-04 | +7.9% | +6.1% | +8.0% | +9.4% | +8.2% |
| 2021-05 | +8.1% | +7.2% | +7.9% | +10.0% | +7.0% |
| 2021-06 | +12.3% | +10.9% | +11.7% | +14.9% | +11.3% |
| 2021-07 | +6.1% | +5.2% | +6.2% | +6.8% | +6.1% |
| 2021-08 | +8.3% | +7.7% | +8.1% | +9.1% | +8.1% |
| 2021-09 | +10.3% | +8.7% | +10.6% | +12.4% | +8.8% |
| 2021-10 | +6.6% | +7.3% | +6.7% | +6.3% | +5.9% |
| 2021-11 | +7.6% | +7.8% | +8.1% | +7.4% | +6.7% |
| 2021-12 | +7.3% | +7.0% | +7.5% | +7.9% | +6.5% |
| 2022-01 | +8.6% | +10.5% | +9.1% | +8.6% | +5.1% |
| 2022-02 | +8.4% | +10.1% | +9.0% | +7.9% | +5.8% |
| 2022-03 | +7.2% | +9.7% | +8.4% | +6.7% | +2.6% |
| 2022-04 | +10.1% | +11.6% | +10.8% | +10.4% | +6.5% |
| 2022-05 | +10.6% | +11.9% | +11.8% | +10.8% | +6.8% |
| 2022-06 | +6.3% | +8.2% | +7.4% | +5.2% | +3.7% |
| 2022-07 | +13.6% | +14.6% | +14.7% | +15.1% | +8.4% |
| 2022-08 | +11.2% | +11.8% | +11.9% | +12.4% | +7.3% |
| 2022-09 | +8.3% | +9.9% | +9.1% | +8.2% | +4.8% |
| 2022-10 | +11.1% | +10.3% | +12.2% | +12.9% | +7.5% |
| 2022-11 | +8.8% | +8.7% | +9.6% | +10.4% | +4.9% |
| 2022-12 | +7.3% | +7.3% | +8.5% | +8.1% | +4.5% |
| 2023-01 | +5.2% | +5.7% | +6.2% | +5.6% | +2.2% |
| 2023-02 | +4.2% | +5.3% | +4.9% | +4.6% | +0.9% |
| 2023-03 | +2.7% | +3.6% | +3.3% | +2.2% | +1.0% |
| 2023-04 | +1.7% | +2.7% | +2.7% | +0.9% | -0.2% |
| 2023-05 | +0.9% | +1.2% | +1.0% | +0.5% | +0.5% |
| 2023-06 | +0.1% | +0.6% | +0.6% | +0.1% | -1.9% |
| 2023-07 | -0.7% | 0.0% | -0.1% | -1.0% | -2.1% |
| 2023-08 | -1.0% | -0.5% | -0.5% | -1.1% | -2.3% |
| 2023-09 | -1.7% | -1.6% | -1.5% | -1.8% | -2.1% |
| 2023-10 | -2.1% | -2.5% | -1.7% | -2.2% | -2.2% |
| 2023-11 | -2.6% | -2.3% | -2.1% | -3.2% | -2.9% |
| 2023-12 | -2.7% | -2.9% | -2.3% | -3.0% | -2.8% |
| 2024-01 | -1.9% | -2.4% | -2.0% | -1.6% | -1.6% |
| 2024-02 | -1.6% | -3.0% | -1.1% | -0.9% | -1.6% |
| 2024-03 | -0.3% | -1.9% | -0.6% | +0.8% | +0.4% |
| 2024-04 | 0.0% | -2.1% | -0.1% | +1.2% | +0.8% |
| 2024-05 | +0.5% | -0.8% | +0.9% | +1.4% | +0.1% |
| 2024-06 | +0.5% | -1.1% | +0.6% | +1.4% | +0.9% |
| 2024-07 | +0.5% | -0.9% | +0.5% | +1.7% | +0.4% |
| 2024-08 | +0.9% | -0.4% | +1.1% | +1.9% | +1.1% |
| 2024-09 | +1.3% | +1.0% | +1.9% | +1.8% | +0.3% |
| 2024-10 | +2.0% | +1.5% | +1.9% | +2.8% | +1.6% |
| 2024-11 | +2.4% | +1.1% | +2.9% | +3.6% | +1.4% |
| 2024-12 | +3.1% | +3.6% | +3.3% | +3.8% | +1.0% |
| 2025-01 | +3.5% | +3.2% | +4.2% | +4.5% | +1.6% |
| 2025-02 | +4.0% | +3.9% | +4.3% | +5.0% | +2.3% |
| 2025-03 | +5.1% | +3.3% | +5.9% | +7.2% | +3.2% |
| 2025-04 | +1.4% | +2.9% | +2.2% | +1.0% | -0.8% |
| 2025-05 | +2.1% | +3.0% | +2.7% | +2.7% | -0.3% |
| 2025-06 | +2.8% | +3.7% | +3.7% | +2.9% | +0.5% |
| 2025-07 | +2.5% | +3.1% | +3.0% | +2.6% | +0.9% |
| 2025-08 | +2.2% | +2.8% | +3.4% | +2.5% | -0.3% |
| 2025-09 | +2.0% | +2.3% | +2.8% | +2.9% | -0.5% |
| 2025-10 | +2.3% | +3.1% | +4.0% | +2.9% | -1.6% |
| 2025-11 | +2.7% | +3.4% | +3.4% | +3.7% | -0.2% |
| 2025-12 | +2.0% | +1.7% | +3.2% | +3.0% | -0.5% |
| 2026-01 | +1.4% | +1.3% | +2.6% | +2.5% | -1.5% |
| 2026-02 | +1.6% | +2.5% | +3.1% | +2.1% | -2.0% |
| 2026-03 | +0.4% | +2.7% | +2.0% | +0.4% | -4.7% |
| 2026-04 | +3.9% | +3.3% | +5.3% | +5.8% | +0.4% |
| 2026-05 | +2.7% | +3.1% | +4.5% | +3.6% | -1.3% |
What Is the 18-Year Property Cycle?
The 18-year property cycle is the theory that UK (and global) real estate markets move through a repeating pattern of roughly 18 years from peak to peak. The idea was popularised by economist Fred Harrison, who used it to predict the 2007-08 financial crisis years before it happened.
Harrison's model draws on over 200 years of land market data. The argument is straightforward: property markets follow a predictable sequence driven by land speculation, credit expansion, and eventual over-leverage. Each cycle runs through five distinct phases before resetting.
The Five Phases at a Glance
| # | Phase | Typical Duration |
|---|---|---|
| 1 | Recovery - Prices stabilise after a crash. Confidence slowly returns. Early buyers enter. | 4-6 years |
| 2 | Expansion - Prices rise steadily. Lending loosens. Transaction volumes increase. | 3-4 years |
| 3 | Mid-Cycle Dip - A correction. Prices stall or fall slightly. Often mistaken for a crash. | 1-2 years |
| 4 | Boom - Rapid price growth. Speculation increases. Credit over-extends. | 4-6 years |
| 5 | Crash / Recession - Prices fall sharply. Forced sellers. Negative equity. Lending tightens. | 2-4 years |
The total adds up to roughly 14 to 22 years peak to peak. Across the complete UK cycles since the 1950s, the average lands close to 18.
Harrison is not the only researcher to identify this pattern. The economist Homer Hoyt documented 18-year land cycles in Chicago going back to the 1830s. More recently, Phillip Anderson's book The Secret Life of Real Estate and Banking mapped the same rhythm across US, UK, and global property markets.
The cycle is not a law of physics. It is a pattern observed over roughly 200 years of data. Understanding it does not guarantee you can time the market. But ignoring it means ignoring a pattern that has repeated across 70 years of UK price data, and in building records long before that. Later in this article I look at what the academic research says about the cycle, for and against.
The Evidence: UK Property Crashes Since 1953
Theory is one thing. Data is another. Here is every major UK property downturn since the 1950s, with the numbers that matter: how far prices fell, how long the pain lasted, and how long the recovery took.
| Cycle | Peak → Trough | Drop | Recovery |
|---|---|---|---|
| 1953-1973 | 1973 → 1977 | ~35% (real terms) | ~5 years |
| 1973-1989 | Jul 1989 (£55,916) → Oct 1992 (£49,018) | 12.3% | Peak regained Apr 1997 |
| 1989-2007 | Sep 2007 (£175,052) → Mar 2009 (£142,278) | 18.7% | Peak regained Aug 2014 |
| 2007-present | Sep 2022 (£265,727) → Feb 2024 (£254,633)* | 4.2% | Peak regained Mar 2025 |
*UK average prices (Land Registry UK HPI, May 2026 release). England-only data shows a 4.6% drop from the Sep 2022 peak of £290,185 to the Feb 2024 trough of £276,935. "Peak regained" is the month the previous peak price was passed again. Whether the 2022-2024 drop was a mid-cycle dip or the crash that ended a 15-year cycle is an open question this article takes on in the Where Are We Now section.
Three things stand out from this table.
First, the peak-to-peak timing is remarkably consistent. The gap between the 1989 peak and the 2007 peak was 18 years almost to the month. The gap between the 1973 peak and the 1989 peak was 16 years. The theory does not say the cycle is always exactly 18 years. It says the rhythm is persistent enough to be useful.
Second, the severity varies enormously. The 2007 crash saw UK prices fall 18.7% in under two years. The early 1990s downturn saw a 12.3% nominal drop from the July 1989 peak of £55,916 to an October 1992 trough of £49,018, where prices sat for months. Inflation was doing a lot of the heavy lifting in the 1990s, making the real-terms loss significantly worse than the headline figure.
Third, every single recovery has completed. After every crash in the table, prices eventually surpassed the previous peak. That is not a guarantee it will happen next time. But it is the pattern across 70 years of data.
The Five Phases of the Property Cycle Explained
Each phase of the 18-year cycle has its own characteristics. Mapping recent UK data onto these phases shows where the theory holds up and where reality gets messier than any model.
Phase 1: Recovery (2009-2013)
After the 2007-08 crash, England's average house price bottomed out at £150,438 in March 2009. That was an 18.2% fall from the September 2007 peak of £183,883.
Recovery was slow. By January 2013, the England average had only reached £166,938. That is an 11.0% gain from the trough but still £16,945 below the pre-crash peak. London recovered faster. The North recovered slower. Some areas did not see their 2007 prices again until 2016 or later.
For investors who bought during this phase, entry prices were significantly below what the same properties would cost five years later. I remember looking at properties in 2010 and 2011 where the numbers stacked up at almost any reasonable rent assumption. The problem was getting a mortgage. Lenders had retreated hard after the crash and deposit requirements were brutal.
That is the pattern with recovery phases. The prices are attractive but the lending is not. When mortgages are hard to get, the buyers who can still transact are the ones with cash, or equity they can draw on.
It is also a phase where below market value purchases keep appearing, because sellers who need to move have very few buyers to sell to while lending stays tight.
The data on this is stark. An investor who bought at the March 2009 trough (England average: £150,438) and held to May 2026 (£292,095) would have seen 94% capital growth before any rental income. The same investor who bought at the September 2007 peak (£183,883) would still have seen 59% growth over the same period. Even buying at the worst possible moment, holding through the full cycle delivered significant returns. That is the power of the long-term view.
Phase 2: Expansion (2013-2019)
From 2013, the market accelerated. Help to Buy launched in October 2013 and injected new demand into the market. Interest rates stayed at historic lows. Prices rose steadily across most of the country.
England's average price climbed back above its 2007 peak in 2014 and kept going. This is the phase where confidence returns in full, transaction volumes pick up, and the memory of the crash starts to fade.
The expansion phase is typically the longest and most stable part of the cycle. Growth is steady rather than spectacular. The headlines are not dramatic. That is exactly what makes it a productive period for buy-to-let property investment. Prices rise, rents rise, and the market is not overheated.
Phase 3: The Mid-Cycle Correction (2022-2024)
This is the phase that catches people off guard. Halfway through the cycle, prices dip. It feels like a crash. It is not.
The data for the current cycle is clear. England's average house price peaked at £290,185 in September 2022. By February 2024, it had fallen to £276,935. That is a 4.6% drop over 17 months.
Compare that to 2007-09, when prices fell 18.2% in 18 months. The mid-cycle dip was roughly one quarter the severity of the previous crash.
What triggered it was equally clear. The Bank of England raised the base rate from 0.1% in December 2021 to 5.25% by August 2023. Mortgage rates doubled. Affordability was squeezed. Demand dropped.
And the correction has already reversed. England's average price first edged back above the September 2022 peak in March 2025, slipped below it again through the spring, and has held above it since July 2025. By May 2026 it stood at £292,095, £1,910 above the peak, with annual growth running at +2.3%.
One honest caveat before moving on. Calling 2022-2024 a mid-cycle dip assumes the cycle that began after 2007 is still running. There is a second reading, that the 2007-to-2022 gap was itself a complete cycle and this dip was the crash that ended it. The Where Are We Now section weighs the two.
Key Takeaway If the 18-year cycle holds, the mid-cycle dip is behind us. England's average price has recovered to £292,095, 0.7% above the September 2022 peak. The question is what comes next.Phase 4: The Boom (What the Theory Says Follows the Dip)
In Fred Harrison's model, the years after the mid-cycle correction are where things get interesting. Confidence returns. Lending loosens. Prices accelerate.
The boom phase is typically the most profitable period for property owners and the most dangerous. Prices rise faster than fundamentals justify. Speculation increases. New investors pile in because prices are rising, not because the numbers stack up.
During the last cycle, the equivalent period would be roughly 2003 to 2007. In those four years, UK house prices nearly doubled. Lending standards collapsed. Self-cert mortgages, 125% LTV products, and interest-only deals with no repayment plan became commonplace.
Whether we see a repeat of that kind of excess depends on regulation, interest rate policy, and lending standards. The post-2008 regulatory framework (stress testing, affordability checks, limits on high-LTV lending) was specifically designed to prevent it. The Financial Policy Committee and Prudential Regulation Authority have tools they did not have in 2006. Time will tell whether those guardrails hold. History suggests that regulatory vigilance tends to fade as the memory of the last crash recedes.
The boom phase is also when property investment scams tend to proliferate. Rising prices attract new entrants who lack experience, and some operators exploit that enthusiasm. Due diligence becomes more important, not less, when the market feels easy.
Phase 5: Crash and Recession (The End of the Cycle)
Every 18-year cycle ends the same way. Prices fall. Over-leveraged buyers face negative equity. Transaction volumes collapse. Forced sellers appear. Lenders tighten.
The 2007-09 crash remains the defining example for most current investors. UK prices fell from £175,052 in September 2007 to £142,278 by March 2009. In England, the fall was steeper: from £183,883 to £150,438, a drop of 18.2%.
The 1990s crash was different in character. UK prices fell 12.3% from £55,916 to £49,018 between July 1989 and October 1992. High inflation meant real-terms losses were much more severe. Negative equity trapped hundreds of thousands of homeowners.
If the 18-year cycle holds with a 2007 start, the next crash window would fall somewhere around 2025-2028. That does not mean it will happen in any specific year. It means the pattern suggests this decade carries higher risk than the last. The data so far does not show crash conditions. But that is the nature of the cycle. The boom phase feels good right up until it does not.
Where Are We Now in the Property Cycle?
The short answer: the 2022-2024 dip is behind us and prices are back above their old peak. What the model cannot settle is which cycle we are in. There are two honest readings, and they point to different decades for the next crash.
The first reading, the one Fred Harrison's followers take, says the cycle that began after 2007 is still running. On this reading 2022-2024 was the mid-cycle dip, a boom phase comes next, and the cycle ends in a crash in the late 2020s.
The second reading says that cycle has already finished. The gap from the 2007 peak to the 2022 peak was 15 years, inside the model's own 14-to-22-year range and close to the 16 years between the 1973 and 1989 peaks. On this reading 2022-2024 was the crash that ended it: shallow in cash terms at 4.6%, but with inflation running high through 2022 and 2023 the real-terms fall was considerably deeper, much as it was in the early 1990s. That would make 2024 the start of a new cycle, putting the market in the recovery phase and pushing the model's own next-crash arithmetic out beyond this decade.
The current data fits the second reading at least as well as the first. Recovery phases look like this: prices grinding back above the old peak, growth positive but modest, lending still tight. Booms do not. Here is that data.
As of May 2026 (the latest Land Registry data at time of writing), England's average house price stands at £292,095. The UK average is £271,295.
England's figure is 0.7% above the September 2022 peak of £290,185. The 2022-2024 correction is over, though the recovery has not been a straight line: the average first crossed the old peak in March 2025, dipped back below it through the spring, and has held above it since July 2025.
Annual price growth in May 2026 was +2.3%. The monthly readings through 2026 have been choppy: around 1% in January and February, a brief dip to -0.3% in March, then +4.0% in April and +2.3% in May. Through 2025, annual growth ranged between 0.9% and 5.3%, ending the year at 1.4%. Growth is positive but not yet accelerating in the way you would expect if a boom phase were underway.
2024 was a different story. The year started with prices still falling (annual change was -2.7% in January 2024) before gradually recovering through the year. The turnaround point, where annual growth turned positive again, came in mid-2024.
What This Means in Cycle Terms
If you overlay the 18-year cycle onto recent data, the picture looks like this:
- 2009-2013: Recovery phase. Prices bottomed at £150,438 (England) and slowly climbed back.
- 2013-2022: Expansion. Prices rose steadily, accelerated during Covid (stamp duty holiday, space race), and peaked in September 2022.
- 2022-2024: A 4.6% dip in England, 4.2% in the UK average. On the first reading, the mid-cycle correction. On the second, the crash that closed a 15-year cycle.
- 2024 onwards: Either the early boom phase of the old cycle, or the recovery phase of a new one. Prices regained the 2022 peak in March 2025. Growth is positive but uneven. Mortgage rates remain elevated compared to the 2010s but have come down from 2023 highs.
The two readings put the next peak in different decades: around 2025-2028 if the old cycle is still running, or well into the 2030s if a new one began in 2024. That gap is exactly why precise timing has never been the model's strength. Its strength is the sequence: recovery, expansion, correction, boom, crash. The order tends to hold even when the timing drifts.
What I pay more attention to is the data coming through month by month. Right now, it shows a market in positive territory with moderate growth. Not a boom. Not a bust. The conditions that typically precede a crash (rampant speculation, collapsing lending standards, prices detached from incomes) are not present in mid-2026.
That does not mean a crash cannot happen. External shocks, geopolitical events, or a sudden credit contraction could trigger one at any time. The cycle is a pattern, not a prediction.
The Regional Picture (May 2026)
The 18-year cycle plays out differently across the country. London tends to lead (prices rise first, correct first) while the North follows. The May 2026 Land Registry data makes this clear.
| # | Region | Avg Price / Annual Change |
|---|---|---|
| 1 | London | £544,814 / -3.7% |
| 2 | South East | £381,311 / +1.2% |
| 3 | East of England | £338,224 / +2.3% |
| 4 | South West | £302,559 / +1.7% |
| 5 | West Midlands | £247,764 / +2.7% |
| 6 | East Midlands | £240,758 / +3.2% |
| 7 | North West | £219,506 / +5.8% |
| 8 | Yorkshire & Humber | £208,549 / +4.3% |
| 9 | North East | £163,933 / +5.9% |
Source: Land Registry UK HPI, May 2026.
London is the outlier. At -3.7% annual change, it is the only English region showing negative growth. The North East and North West are leading at +5.9% and +5.8% respectively. This regional divergence is consistent with where we sit in the cycle. London ran hardest during the expansion phase and is correcting later, while northern regions, where prices remain more affordable relative to local incomes, are seeing the strongest recovery.
For investors deciding where to invest in buy-to-let property, this regional variation matters more than the national headline figure. The cycle does not move in lockstep across the country. Understanding which regions are leading and which are lagging helps inform location decisions.
What the Academic Research Says About the 18-Year Cycle
Most articles about the property cycle cite Fred Harrison and stop there. We reviewed the academic research on property, house price and credit cycles. Around 40 peer-reviewed papers, with the key studies read in full. The evidence cuts both ways, and both sides are worth knowing before you lean on the cycle for anything.
The research that supports a long cycle
A 2017 study in the journal Property Management measured UK housing cycles directly and found the average complete house price cycle ran 19 years from peak to peak. That is the closest peer-reviewed figure to the 18-year claim, and it came from price data, not theory.
Research on credit points the same way. A frequency analysis of the UK, US and Germany found the UK credit cycle averaged around 8 years before 1985, then stretched to roughly 18 years in the decades after lending was deregulated. A different method, a different dataset, and it lands close to the same number.
The mechanism behind the cycle holds up even better than the timing. A study of 17 countries going back to 1870, titled The Great Mortgaging, found that mortgage lending's share of bank credit has roughly doubled since 1900, and that since the Second World War mortgage lending booms have been among the strongest predictors of financial crises. Recessions that follow mortgage booms run deeper and recover more slowly. The core idea in Harrison's model, that credit expansion drives both the boom and the bust, is one of the best-documented findings in the field.
The 18-year figure itself has a longer pedigree than Harrison. Homer Hoyt's study of a century of Chicago land values, published in 1933, found cycles averaging 18 years. A review of 100 years of property cycle research catalogues studies from the 1930s to the 1960s that measured building cycles of 15 to 25 years in Britain and America.
The research that cuts the other way
The longest dataset ever tested tells a different story. A 2019 study of more than 150 years of UK and US house prices found UK price cycles averaging 5 to 6 years, and concluded that long-run trends explain far more of house price behaviour than any cycle does. In inflation-adjusted terms it found no significant cyclical pattern in UK prices at all.
The Royal Institution of Chartered Surveyors reached a similar position years earlier. Its accepted definition describes property cycles as recurrent but irregular, and its own history of the UK market from 1921 to 1997 concluded that long-run cycle analysis adds little to the ability to predict the market. Both are reported in the same hundred-year review.
Two gaps worth knowing about. We could not find a peer-reviewed test of Harrison's five phases, or of the mid-cycle dip as a repeating feature. The sequence may be a fair description of how past cycles have unfolded, but it is a practitioner's framework rather than published science. Harrison is also largely absent from the academic conversation: the hundred-year review of cycle research does not mention him once, in its main text or its reference list.
What I take from the research
Three things.
First, the cycle earns its keep as a warning system, not as a clock. The rhythm shows up in the data, but the regularity you would need to time the market does not. That matches how I have used it since I started investing in 2005.
Second, the strongest modern finding is about credit, not the calendar. The UK credit cycle has run close to 18 years since the mid-1980s, when lending was deregulated. Before that, cycles were shorter. So the 18-year rhythm may be a feature of the modern credit era rather than a 200-year constant, and it is set by lending conditions rather than a law of nature. If lending rules change materially, the cycle's shape can change with them.
Third, the research puts a number on something experienced investors feel instinctively. A study of housing booms across 20 countries found that the longer a boom runs, the more likely it becomes to end. For booms under six and a half years, each extra quarter of age raised the chance of the boom ending by around 4 percentage points. The table of UK crashes earlier in this article says the same thing in plainer terms: no boom has lasted forever.
Is a UK House Price Crash Coming?
This is the most searched question in UK property right now. And the honest answer is: nobody knows. But we can look at what the data says for and against.
The Case for a Crash (What the Bears Say)
The cycle says we are due. If the 18-year pattern holds and you count from the 2007 peak, the window for the next crash falls in the mid-to-late 2020s. Fred Harrison has pointed to 2026 as a potential inflection point, though his model focuses on land values rather than house prices specifically.
Affordability is stretched. The average UK house price of £271,295 against average earnings leaves the house-price-to-income ratio above historical norms. Even with rate cuts, monthly mortgage costs are significantly higher than during the 2010s. A buyer putting down a 10% deposit on the average England property (£292,095) at a 5% mortgage rate faces monthly payments roughly 40% higher than an equivalent buyer in 2019.
Interest rates remain elevated. The base rate is higher than at any point between 2009 and 2022. If it stays elevated or rises again, that puts pressure on both buyers and existing mortgage holders coming off fixed deals.
The Case Against a Crash (What the Data Shows)
The mid-cycle correction already happened. England's 4.6% dip from September 2022 to February 2024 looks consistent with the mid-cycle correction in the 18-year model. If that reading is correct, the crash phase would not arrive until the late 2020s at the earliest, after a boom phase.
Supply remains constrained. The UK has a structural housing shortage. New builds have consistently fallen short of the government's 300,000 annual target for years. The National Housing Federation estimates England needs 340,000 new homes a year, yet completions have averaged closer to 200,000-220,000. Demand outstrips supply in most regions. This puts a floor under prices that did not exist in the early 1990s, when supply came closer to keeping up with demand.
Lending standards are tighter. Post-2008 regulation (stress testing, affordability assessments, limits on high-LTV lending) means the kind of reckless lending that amplified the 2007 crash is less likely to recur. The system has more safeguards.
Prices have already recovered. England at £292,095 is above the 2022 peak. Markets do not typically crash from a position of moderate, positive growth. They crash from a position of excess.
What the 2008 Housing Market Crash Actually Looked Like
The conditions before the 2007 crash were nothing like today. Self-certified mortgages. 125% loan-to-value products. Lenders falling over themselves to approve applications with minimal checks. House prices had roughly doubled in four years.
Today, stress testing is mandatory. High-LTV lending is capped. Deposit requirements are substantial. The financial system is in a fundamentally different position. That does not make a crash impossible. It makes the 2007-style crash (driven by lending excess) less probable.
For a detailed breakdown of what happened in 2008-09 and how prices recovered, see our guide to the 2008 housing market crash.
How Investors Use the Property Cycle
Understanding the cycle is one thing. The question is what investors actually do with it.
In my experience, the cycle is most useful as a way of staying aware of risk, not as a market-timing tool. Trying to call the exact top or bottom is a losing game. But knowing roughly where you sit in the cycle helps you set sensible expectations.
During the Recovery Phase
Prices are low. Confidence is fragile. Lenders are cautious. This is when below market value properties are most abundant because motivated sellers outnumber buyers. Repossessions increase. Auction activity rises.
The challenge is that financing is harder to obtain and sentiment is against you. Everyone you know thinks property is a terrible investment. That is precisely why the numbers work.
During the Expansion Phase
This is the workhorse phase for investment property. Prices rise steadily. The rental market strengthens. Mortgage products become more competitive. Transaction volumes are healthy.
Most successful long-term investors build their portfolios during expansion phases because the market is stable enough for property investment strategies like buy refurbish refinance to work as planned. Valuations are predictable. Refinancing timetables hold.
During the Mid-Cycle Dip
Prices stall or fall slightly. Some investors panic. Others see it as a buying opportunity. The data from 2022-2024 suggests the dip is temporary and shallow. England's 4.6% fall was fully recovered within about three years of the peak.
Dips can also throw up off-market property deals, because some sellers become keener on a quick, quiet sale. Competition cools too. In the 2022-2024 dip, transaction volumes fell as higher mortgage rates pushed some buyers out. For those still active, that meant fewer bidding wars and more room to negotiate.
The risk during a mid-cycle dip is psychological. Headlines talk about crashes. Commentators predict further falls. The temptation is to wait for the bottom. But the data from 2022-2024 shows the correction was shallow (4.6%) and brief (17 months). Waiting for a crash that does not materialise means missing the recovery. That said, the mid-cycle dip is real and timing varies. Some locations corrected more than others, and recovery has been uneven across regions.
During the Boom Phase
Capital growth accelerates. Everyone feels like a genius. Media coverage turns relentlessly positive. This is when the numbers start to look stretched.
Experienced investors focus on fundamentals during boom phases. Does the rent cover the mortgage? Does the yield stack up at current prices? If the answer is only "yes, because prices will keep rising" then the numbers do not stack up. Capital appreciation on its own is not a strategy. It is speculation.
Before and During a Crash
The most important thing any investor can do before a crash is stress-test their portfolio. Can you hold through a 20% price drop? Can you service the mortgage if rates rise 2%? If the answer is no, the cycle does not matter. Your exposure is too high.
I held through 2008-09. It was uncomfortable. Valuations dropped, banks pulled offers, and the phone stopped ringing. But because the rental income covered the costs, holding was possible. The properties that survived the crash went on to deliver strong capital growth over the following decade.
Thorough property due diligence matters more the further into the cycle you are. Early in the cycle, most purchases look reasonable within a few years. Late in the cycle, the margin for error shrinks.
For the current forecasts and their track record, see our guide to house price predictions for the next 5 years.
Location Matters at Every Stage of the Cycle
The 18-year cycle describes the national market. But property is local. In the 2007-09 crash, London fell faster but recovered sooner. Parts of the North did not recover for a decade.
In the current cycle, the same regional variation is playing out. Some areas barely dipped during 2022-2024. Others fell further but have bounced back faster.
Where you invest matters at least as much as when you invest. Location fundamentals (employment, transport, population growth, housing supply) outlast any single cycle. The May 2026 regional data underlines this: the North East grew 5.9% while London fell 3.7%. Same national market, completely different local outcomes.
The cycle is a useful framework. But the decision of where to invest, and at what price relative to local rents and local earnings, matters more than the question of where we sit in the national cycle. A property yielding 7% in a northern city with strong employment growth is a fundamentally different proposition to a property yielding 3% in London, regardless of which phase the cycle is in.
If you are comparing areas, our guide to the best buy-to-let locations ranks 161 UK towns and cities across yield, growth, and rental demand using the latest government data. For anyone starting out, how to start a property business covers the practical steps from first purchase onwards.

Frequently Asked Questions
How long does the property cycle last?
The complete UK property cycles since the 1950s have lasted between 15 and 20 years from peak to peak, depending on where you place the most recent peak. The average is close to 18 years, which is where the name comes from. The gap between the 1989 peak and the 2007 peak was 18 years almost exactly, and the gap from 2007 to the 2022 peak was 15.
Is the 18-year property cycle real?
Partly. The rhythm shows up in the data, but the regularity is harder to prove, and the surveyors' body RICS calls property cycles recurrent but irregular. One UK study measured the average house price cycle at 19 years peak to peak, and separate research found the UK credit cycle has run close to 18 years since lending was deregulated in the mid-1980s. But the longest study, covering more than 150 years of UK prices, found shorter cycles of 5 to 6 years and concluded that long-run trends matter more. Fred Harrison used the cycle to predict the 2007-08 crash, but it is a historical pattern, not a guaranteed repeating law.
Where are we in the property cycle in 2026?
Past the 2022-2024 dip, with prices back above the old peak: England's average of £292,095 in May 2026 sits 0.7% above September 2022. The open question is which cycle we are in. If the cycle that began after 2007 is still running, the dip was mid-cycle and a boom phase comes next. If the 2007-to-2022 gap was itself a complete 15-year cycle, the market is in the recovery phase of a new one, and the current pattern of modest growth and tight lending fits that reading well.
Will house prices crash in the UK?
In the cycle model, a crash follows a boom, and there has been no boom: growth since 2024 has been positive but modest. On one reading of the cycle the boom is still to come, with a crash after it in the late 2020s; on the other, the 2022-2024 dip was the crash and a new cycle has already begun. Current conditions (tight supply, regulated lending, moderate growth) differ significantly from pre-crash conditions in 2007 and 1989. External shocks could still trigger a downturn at any time.
When will house prices drop in the UK?
Land Registry data shows England's prices dropped 4.6% between September 2022 and February 2024 before recovering. As of May 2026, prices are rising at +2.3% annually. The cycle model's answer depends on which reading you take: the late 2020s if the cycle that began after 2007 is still running, or well into the 2030s if a new cycle began in 2024. No model can predict the exact timing.
Who is Fred Harrison?
Fred Harrison is a British economist and author best known for predicting the 2007-08 financial crisis using the 18-year property cycle theory. His books, including Boom Bust: House Prices, Banking and the Depression of 2010 (published 2005), laid out the case for a crash years before it happened. He continues to write about land economics and the cyclical nature of property markets.
What was the biggest UK house price crash?
In nominal terms, the 2007-09 crash was the most severe in recent history. UK average prices fell 18.7% from £175,052 (September 2007) to £142,278 (March 2009). In England, the fall was 18.2% from £183,883 to £150,438. The 1973 crash was arguably worse in real terms due to high inflation, but reliable nominal price data from that period is less precise.
How long do house prices take to recover after a crash?
Recovery times vary. After the 2007-09 crash, UK average prices regained their September 2007 peak in August 2014, around five and a half years after the March 2009 trough. After the 1989-92 downturn, the July 1989 peak was regained in April 1997, though in real (inflation-adjusted) terms recovery took considerably longer. Every crash in the UK since 1953 has been followed by a full nominal recovery.
Ready to buy property?
Browse investment properties with prices and gross yields shown for each opportunity.
Get property alerts