Where to Buy Property Investments in Birkenhead: Yields of 7.1%
Birkenhead's gross rental yields range from 3.8% to 7.1% across postcodes with rental data, with CH41 delivering the highest returns. Average sold prices across Wirral sit 25.1% below the England average, and the borough's population held steady at 320,199 in the 2021 census.
Birkenhead's average asking prices start from £132,138 in CH41, where a 3.5x price-to-earnings ratio creates one of the most affordable entry points in the North West. Five of the six postcodes sit below the national affordability benchmark. Rental data is available for 5 of the 6 postcodes, with CH63 (Bromborough, Eastham) lacking sufficient current listings.
This guide covers all 6 Birkenhead postcodes from CH41 to CH63 under the Wirral metropolitan borough (ONS code E08000015). Birkenhead sits on the western bank of the River Mersey, directly opposite Liverpool and connected by the Mersey Tunnel and Mersey Rail network. Investors comparing options in the region may also consider Chester or Warrington. Browse all our North West location guides.
Article updated: March 2026
Birkenhead Buy-to-Let Market Overview 2026
Birkenhead offers some of the lowest entry prices on Merseyside, backed by a £4.5 billion Wirral Waters regeneration programme and direct rail links to Liverpool city centre.
- Average sold price: £218,516 (25.1% below England's £291,865)
- Asking price range: £132,138 (CH41) to £302,831 (CH63)
- Rental yields: 3.8% (CH43, CH45) to 7.1% (CH41) across postcodes with rental data
- Rental income: Monthly rents from £734 (CH42) to £860 (CH43)
- Price per sq ft: House prices from £133/sq ft (CH41) to £256/sq ft (CH63)
- Market activity: Sales ranging from 15 per month (CH41) to 35 per month (CH43)
- Deposit requirements: 30% deposits range from £39,641 (CH41) to £90,849 (CH63)
- Affordability ratios: Property prices from 3.5 to 8.0 times Wirral's median annual salary of £38,010
Contents

-
by Robert Jones, Founder of Property Investments UK
With two decades in UK property, Rob has been investing in buy-to-let since 2005, and uses property data to develop tools for property market analysis.

Property Data Sources
Our location guide relies on diverse, authoritative datasets including:
- HM Land Registry UK House Price Index
- Ministry of Housing, Communities and Local Government
- Ordnance Survey Data Hub
- Propertydata.co.uk
We update our property data quarterly to ensure accuracy. Last update: March 2026. All data is presented as provided by our sources without adjustments or amendments.
Why Invest in Birkenhead?
Birkenhead sits under ten minutes from Liverpool Central by Mersey Rail, with asking prices starting at £132,138 in CH41. That proximity is the foundation of Birkenhead's property investment case. The connectivity gives access to Liverpool's job market, its two universities, and its expanding commercial district without Liverpool's price tag. Across the river, the cheapest Liverpool postcodes start higher.
The borough sits within the Wirral metropolitan area, which had a population of 320,199 at the 2021 Census. Growth was minimal at 0.1% from 2011, but Wirral is not a growth story in the traditional sense. It is a stability story. Employment is anchored by public sector roles, the NHS (Arrowe Park Hospital is a major employer), and the emerging regeneration economy around Wirral Waters.
Earnings in Wirral sit close to the regional median. The median annual salary is £38,010, compared to £37,445 across the North West and £39,125 for Great Britain. That puts Wirral in a position where house prices remain accessible to local workers, which supports both owner-occupier demand and rental affordability.
Rail Connections: Rock Ferry, Hamilton Square, and Birkenhead Train Stations
The Mersey Rail network connects Birkenhead's postcodes directly to Liverpool, Chester, and Ellesmere Port. Rock Ferry station serves CH42, Birkenhead Central and Hamilton Square serve CH41, and the West Kirby line runs through CH43 and beyond. For tenants who work in Liverpool, the commute is shorter than many inner-city bus routes.
Birkenhead Economic Summary
- Population: 320,199 (2021 Census). Growth of 0.1% from 2011.
- Median annual salary: £38,010 (Wirral), £37,445 (North West), £39,125 (Great Britain)
- Employment rate: 72.6% (Wirral), 73.2% (North West), 75.6% (Great Britain)
- Unemployment rate: 5.6% (Wirral), 4.5% (North West), 4.3% (Great Britain)
- Key employment sectors: Healthcare (NHS), public administration, regeneration and construction, retail, transport and logistics
Source: ONS Census 2021, Nomis Labour Market Profile (ASHE 2025, Employment Oct 2024-Sep 2025)
Wirral's unemployment rate of 5.6% sits above both the North West (4.5%) and Great Britain (4.3%). The employment rate of 72.6% is also below the national average. These are not headline numbers that sell. But the context matters.
Wirral's working-age population includes a significant retiree and early-retirement demographic, particularly in the western Wirral postcodes. For landlords, the more relevant figure is that those in work earn close to the regional median and can sustain rents.
Regeneration and Investment in Birkenhead
Birkenhead's combined regeneration pipeline runs into billions, with Wirral Waters alone carrying a £4.5 billion long-term masterplan. It is the largest regeneration programme on Merseyside outside Liverpool itself.
- Wirral Waters (under construction, £4.5 billion masterplan): Peel L&P's flagship 500-acre waterfront regeneration spans East Float and West Float docklands. Millers Quay residential development is completed and occupied. MEA Park West has attracted £16 million for manufacturing and employment space creating 200+ jobs. The long-term vision includes 13,000 homes and 27,000 jobs. Updates at Birkenhead News.
- Hind Street Urban Garden Village (approved, £51 million): Transformation of derelict land around Hind Street into over 1,500 homes, with 633 in Phase 1. Funded by £29 million from Homes England and £22 million from the Liverpool City Region Combined Authority. Includes Dock Branch Park, a linear walking and cycling route along the historic Rock Ferry to Bidston Dock railway line. Updates at GOV.UK.
- Birkenhead Town Centre and Waterfront (under construction, £20m+ government grants): Infrastructure upgrades to Grange Road, Charing Cross, Conway Street, and Europa Boulevard. Woodside Ferry Terminal is being transformed into a multi-functional hub with business centre and commercial space. Updated masterplans shared with the public in 2025. Updates at Wirral View.

Birkenhead Property Market Analysis
When Was the Last House Price Crash in Birkenhead?
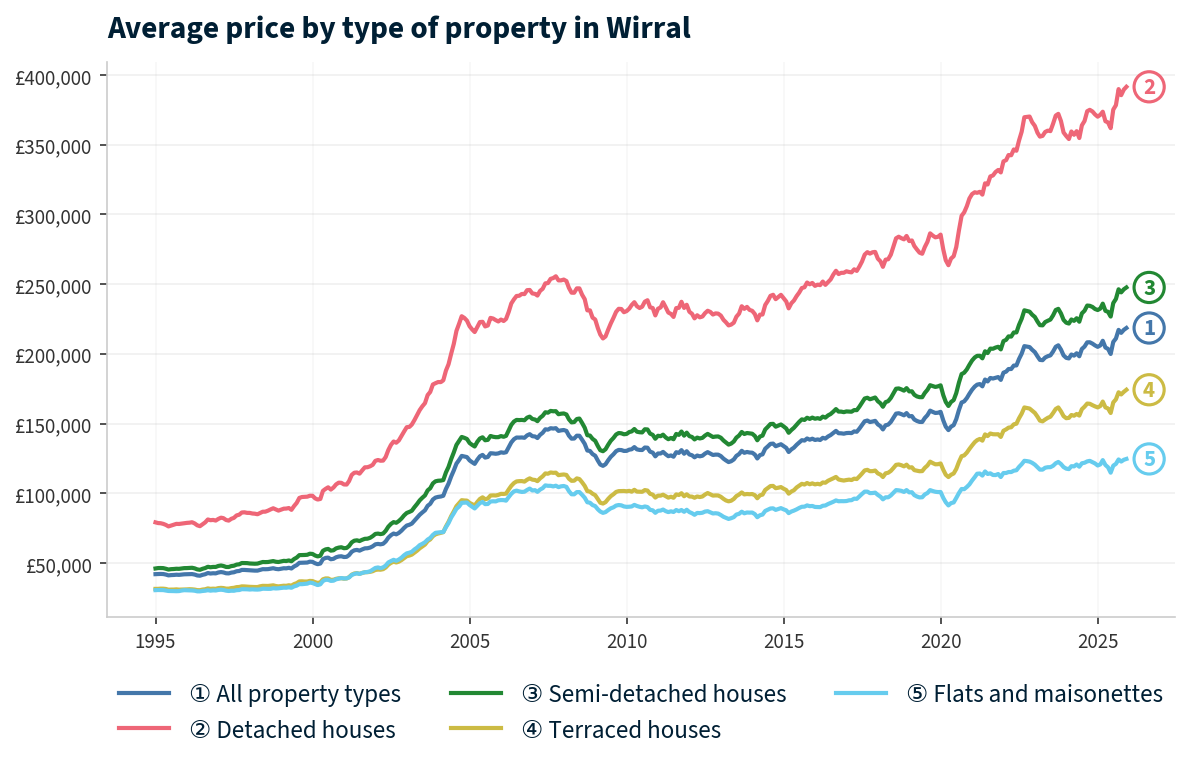
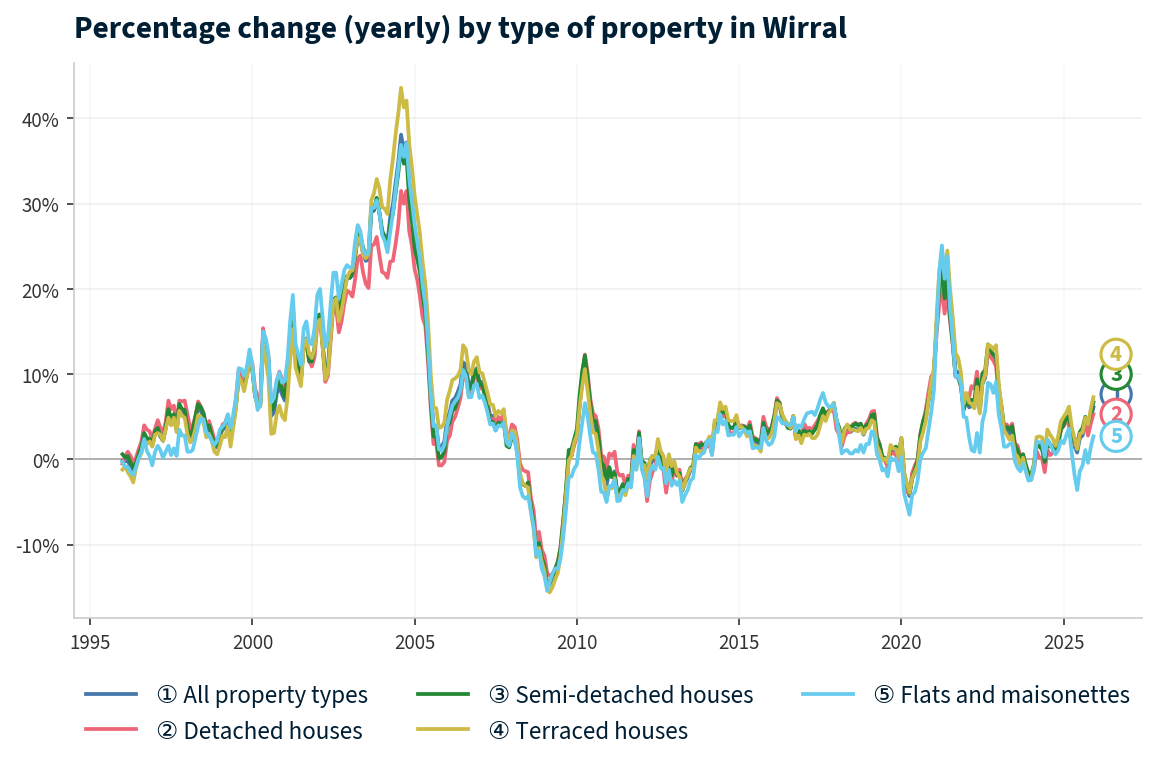
Birkenhead is in the metropolitan borough of Wirral so all sold property prices from HM Land Registry are available at this level. Wirral property prices have risen 421.8% since January 1995, from £41,875 to £218,516, but an 18.4% crash in 2007-2009 took over 8 years to recover. The full house price history from the HM Land Registry House Price Index runs from January 1995 to December 2025. The data shows one major crash, a prolonged stagnation period, and a sharp pandemic-era surge.
- 1995-2000 (Slow build): Wirral began 1995 at £41,983. Prices barely moved for the first year, actually dipping to £41,916 by January 1996. By January 2000, the average had reached £50,791. Steady but unremarkable growth while southern England surged ahead.
- 2000-2007 (The boom): Prices nearly tripled from £50,791 in January 2000 to a peak of £146,684 in October 2007. The sharpest growth came in 2003-2005, when annual change exceeded 20%. Cheap credit and national house price momentum drove Merseyside upward alongside every other region.
- 2007-2009 (The financial crisis): From the peak of £146,684 in October 2007 to the trough of £119,660 in April 2009, Wirral lost 18.4% of its value in 18 months. The worst annual change reading was -14.8% in February 2009. All property types fell: detached dropped from £255,607 to £211,019, semi-detached from £158,860 to £130,148, terraced from £114,766 to £92,621, and flats from £105,416 to £85,937. Wirral's decline of 18.4% was in line with the North West (-18.3%) and England (-18.2%).
- 2009-2013 (Stagnation): Prices bounced off the April 2009 trough quickly, recovering to £130,345 by December 2009. But then growth stalled entirely. Prices oscillated between £126,000 and £131,000 for four years. By December 2013, the average was £129,212. Still 11.9% below the pre-crash peak.
- 2014-2017 (Slow recovery): Annual growth of 2-5% gradually closed the gap. Prices finally passed the pre-crash peak in July 2017 at £148,910. That recovery took 99 months from the October 2007 peak. Wirral recovered more slowly than England, where prices passed their pre-crash peak by 2014.
From crash to recovery: Wirral took 99 months to regain its October 2007 peak. Since then, prices have risen a further 46.7% to £218,516 by December 2025.
- 2017-2019 (Steady growth): Prices rose from £148,910 in July 2017 to £157,759 by December 2019. Consistent growth of 2-3% per year. Nothing dramatic, but the market had found a sustainable pace.
- 2020-2022 (Pandemic surge): The stamp duty holiday and lifestyle re-evaluation hit Wirral hard in the best way. Prices jumped from £147,744 in March 2020 to £202,876 by December 2022. That is 37.3% growth in under three years. Wirral's coastal postcodes and proximity to Liverpool without Liverpool's density made it a beneficiary of the move-to-the-water trend.
- 2023 (Rate shock): Interest rate rises cooled the market. Prices slipped from £202,876 in December 2022 to £198,878 by December 2023. A decline of 2.0%. Brief and mild compared to 2008.
- 2024-2025 (Recovery): Prices stabilised and began rising again. By December 2025, the average reached £218,516 with annual growth of 6.1%. Wirral now sits 49.0% above its pre-crash peak.
Long-Term Property Value Growth in Wirral
- 5 years (2020-2025): +27.5% (£171,360 to £218,516)
- 10 years (2015-2025): +57.1% (£139,126 to £218,516)
- 15 years (2010-2025): +72.8% (£126,476 to £218,516)
- 20 years (2005-2025): +69.9% (£128,584 to £218,516)
- 30 years (1995-2025): +421.8% (£41,875 to £218,516)
The 2008 crash is the benchmark for Wirral investors assessing downside. An 18.4% decline took over 8 years to recover. That is slower than England but consistent with the North West. The difference now is the regeneration pipeline. Wirral Waters, Hind Street, and the town centre investment did not exist in 2007. Whether that pipeline changes the recovery profile in any future downturn is untested, but the structural investment is real.
Source: HM Land Registry House Price Index for Wirral, January 1995 to December 2025.
Thinking of Buying?
We have off-market investment properties averaging 8%+ annual yield.
View Property DealsSold House Prices in Birkenhead
Wirral's average sold price of £218,516 sits 25.1% below England's £291,865 and almost exactly level with the North West regional average of £217,428. That means Birkenhead investors get the England discount without paying a regional premium. The size of that discount varies by property type, and flats tell the most striking story.
| Property Type | Wirral Average | England Average | Difference |
|---|---|---|---|
| Detached houses | £391,486 | £471,667 | -17.0% |
| Semi-detached houses | £247,585 | £289,135 | -14.4% |
| Terraced houses | £174,223 | £244,830 | -28.8% |
| Flats and maisonettes | £124,622 | £219,340 | -43.2% |
| All property types | £218,516 | £291,865 | -25.1% |
Flats in Wirral average £124,622, a 43.2% discount to England's £219,340. That is the widest gap of any property type. Birkenhead's flat stock includes ex-council blocks in CH41 and CH42, converted Victorian properties near the waterfront, and newer developments linked to Wirral Waters. The deep discount reflects an oversupply of older stock relative to demand, but for yield-focused investors looking at below market value properties, it means even modest rents produce meaningful returns.
Terraced houses at £174,223 sit 28.8% below England. Terraces are the dominant housing type in CH41 (Birkenhead Centre), CH42 (Rock Ferry, Tranmere), and CH44 (Wallasey, Seacombe). These are the core rental stock postcodes where investor activity concentrates. The discount here is structural. Merseyside terraced housing has always traded below national averages, and the gap widened further during the pandemic when detached and semi-detached properties saw stronger demand.
Semi-detached houses show the narrowest discount at 14.4%. Semis are the family housing stock in CH43 (Prenton, Oxton) and CH45 (Wallasey, New Brighton). Owner-occupier demand in these postcodes keeps prices closer to the national average.
Detached houses at £391,486 sit 17.0% below England. CH63 (Bromborough, Eastham) and CH43 carry the bulk of Birkenhead's detached stock. These are not typical buy-to-let postcodes, but the discount means investors looking at larger properties for HMO conversion have lower entry costs than in most English boroughs.
Property Data Sources
Our location guide relies on diverse, authoritative datasets including:
- HM Land Registry UK House Price Index
- Ministry of Housing, Communities and Local Government
- Ordnance Survey Data Hub
- Propertydata.co.uk
We update our property data quarterly to ensure accuracy. Last update: March 2026. All data is presented as provided by our sources without adjustments or amendments.
Price Per Square Foot in Birkenhead
CH41, CH42, and CH44 all price below £141 per square foot, while CH63 commands £256. That near-2x spread across six postcodes (£133 to £256) is one of the widest per-foot gaps in any PIUK North West guide. Price per square foot strips out property size and shows what you pay for space itself. A postcode with large houses may look expensive on average asking price but cheap per square foot. It is the truest like-for-like comparison across postcodes, and in Birkenhead it maps directly onto the two-tier market: affordable inner postcodes where investors buy for yield, and premium outer postcodes where owner-occupiers drive prices.
| Rank | Area | Price Per Sq Ft |
|---|---|---|
| 1 | CH41 (Birkenhead Centre, Hamilton Square) | £133 |
| 2 | CH42 (Rock Ferry, Tranmere) | £141 |
| 3 | CH44 (Wallasey, Seacombe) | £141 |
| 4 | CH45 (Wallasey, New Brighton) | £191 |
| 5 | CH43 (Prenton, Oxton) | £218 |
| 6 | CH63 (Bromborough, Eastham) | £256 |
CH41, CH42, and CH44 cluster tightly between £133 and £141 per square foot. These three postcodes form the affordable core of Birkenhead. The difference between them is negligible in per-foot terms. What separates them is location and tenant profile: CH41 sits closest to the waterfront regeneration, CH42 runs south toward Rock Ferry, and CH44 extends north into Wallasey and Seacombe.
CH45 at £191 represents the jump into Wallasey's coastal premium. New Brighton's seafront regeneration and Victorian housing stock command a 35% premium over the inner postcodes. CH43 at £218 reflects Prenton and Oxton's established residential character. CH63 at £256 is the Bromborough and Eastham end of the market, where larger properties and proximity to the M53 motorway attract commuter families.
Figures reflect averages across all property types and ages. Individual values depend on condition, location within the postcode, and building age.
For Sale Asking Prices in Birkenhead
What does £132,138 buy in Birkenhead? An average-priced property in CH41, the same borough where CH63 asks £302,831. That £170,693 spread is wide for a six-postcode area and reflects the distinct character of each neighbourhood within the Wirral borough. Asking prices capture what sellers and agents think the market will pay. They run ahead of sold prices in a rising market and sit above actual transaction prices in a cooling one.
| Rank | Area | Average Asking Price |
|---|---|---|
| 1 | CH41 (Birkenhead Centre, Hamilton Square) | £132,138 |
| 2 | CH42 (Rock Ferry, Tranmere) | £162,333 |
| 3 | CH44 (Wallasey, Seacombe) | £171,726 |
| 4 | CH45 (Wallasey, New Brighton) | £239,788 |
| 5 | CH43 (Prenton, Oxton) | £272,342 |
| 6 | CH63 (Bromborough, Eastham) | £302,831 |
Three postcodes sit below £175,000. CH41, CH42, and CH44 offer asking prices that put buy-to-let within reach for investors with limited capital. CH41 at £132,138 requires just £39,641 at 30% deposit. That is less than a single year's rental income at current rates in some London postcodes.
CH45 at £239,788 marks the transition into the premium tier. New Brighton's coastal position and improved amenities (the Marine Point development, the revived seafront) have lifted asking prices 44% above neighbouring CH44 Wallasey. The two postcodes share a border and a rail line, but CH45's waterfront premium is clear in the data.
The mean asking price across all six Birkenhead postcodes is £213,526. That figure appears in the comparison section later, where Birkenhead is measured against Liverpool, Wigan, St Helens, and Chester.

House Price Growth in Birkenhead
Between 2021 and 2026, all six Birkenhead postcodes delivered positive growth, with CH41 leading at 37.5% over five years. An investor who bought a £96,000 property in CH41 five years ago would be sitting on a property now asking £132,138. That is £36,000 in equity growth from the cheapest postcode in the area. The five-year column captures a full market cycle and filters out the noise of individual sales. One-year growth can swing on a handful of transactions in a small postcode. The three-year figures tell a different story.
| Area | 1 Year | 3 Years | 5 Years |
|---|---|---|---|
| CH41 (Birkenhead Centre, Hamilton Square) | -1.2% | -0.1% | 37.5% |
| CH44 (Wallasey, Seacombe) | 8.9% | 11.9% | 37.3% |
| CH42 (Rock Ferry, Tranmere) | -0.8% | 8.9% | 32.5% |
| CH45 (Wallasey, New Brighton) | 5.7% | 7.8% | 27.9% |
| CH63 (Bromborough, Eastham) | 6.1% | 1.6% | 20.3% |
| CH43 (Prenton, Oxton) | 1.9% | 2.0% | 14.7% |
The cheapest postcodes delivered the strongest growth. CH41 and CH44 both exceeded 37% over five years. CH42 at 32.5% completes the affordable trio. This is a common pattern in undervalued areas: prices have further to run from a low base.
The pandemic accelerated this. When buyers who had never considered Birkenhead were priced out of Liverpool and Chester, Wirral's inner postcodes absorbed the demand.
CH43 Prenton and Oxton shows the weakest five-year growth at 14.7%. This is the most established residential postcode in Birkenhead, where prices were already relatively high. There is less headroom for capital appreciation when asking prices sit at £272,342. The one-year figure of 1.9% and three-year figure of 2.0% confirm a market that is growing but slowly. CH43 is a stability play, not a growth play.
CH41 and CH42 both show negative one-year growth (-1.2% and -0.8%) despite strong five-year returns. That pattern suggests these postcodes surged during the pandemic, pulled back slightly as rates rose, and are now consolidating. Investors entering now are buying after a correction from the pandemic peak, which may be a better entry point than twelve months ago.
Monthly Property Sales in Birkenhead
At 175 combined transactions per month across six postcodes, Birkenhead is a liquid market by North West standards. That matters for exit strategy. High sales volume with high turnover means you can sell when you need to. Low volume means you may wait. Individual postcodes range from 15 sales per month in CH41 to 35 in CH43, and CH63 Bromborough stands out with a turnover rate of 104%, meaning properties change hands faster than new stock comes to market.
| Area | Sales Per Month | Turnover | Asking Price |
|---|---|---|---|
| CH43 (Prenton, Oxton) | 35 | 37% | £272,342 |
| CH44 (Wallasey, Seacombe) | 33 | 79% | £171,726 |
| CH45 (Wallasey, New Brighton) | 33 | 47% | £239,788 |
| CH42 (Rock Ferry, Tranmere) | 32 | 49% | £162,333 |
| CH63 (Bromborough, Eastham) | 27 | 104% | £302,831 |
| CH41 (Birkenhead Centre, Hamilton Square) | 15 | 27% | £132,138 |
CH41 has the lowest sales volume at 15 per month and the lowest turnover at 27%. That low turnover indicates a postcode dominated by long-term holders. Landlords buy in CH41 for the 7.1% yield and hold. The low volume means fewer opportunities to buy, but it also means less competition from flippers and short-term speculators.
CH44 Wallasey combines strong volume (33 sales per month) with high turnover (79%). Properties move quickly here. For investors planning an eventual exit, CH44 offers the best combination of liquidity and affordable entry at £171,726. CH63 at 104% turnover is the most liquid postcode, but with asking prices of £302,831, it serves a different investor profile.
Property Data Sources
Our location guide relies on diverse, authoritative datasets including:
- HM Land Registry UK House Price Index
- Ministry of Housing, Communities and Local Government
- Ordnance Survey Data Hub
- Propertydata.co.uk
We update our property data quarterly to ensure accuracy. Last update: March 2026. All data is presented as provided by our sources without adjustments or amendments.

Birkenhead Rental Market Analysis
For investors weighing up whether rental property is a worthwhile investment in Birkenhead, the data below breaks down average monthly rents and gross rental yields across the borough's postcodes.
Rental data is available for 5 of 6 postcodes. CH63 (Bromborough, Eastham) has insufficient current listings for reliable figures. For the five with data, monthly rents range from £734 in CH42 to £860 in CH43 and gross yields range from 3.8% to 7.1%. If you are looking to build a property portfolio in the North West, Birkenhead's combination of sub-£40,000 deposits and yields above 7% makes it one of the most capital-efficient options in the region.
Average Rent & Gross Rental Yields in Birkenhead
CH41 delivers Birkenhead's highest gross yield at 7.1%, where monthly rents of £778 meet asking prices of just £132,138. Gross rental yield is calculated from the average asking price and average monthly rent for each postcode. It does not account for void periods, maintenance, management fees, or mortgage costs. It is a starting point for comparison, not a profit forecast.
That 7.1% figure is driven entirely by CH41's low entry price. The rent itself is not the highest in the area. CH43 at £860 per month collects the highest absolute rent but its asking price of £272,342 compresses the yield to 3.8%.
| Area | Average Monthly Rent | Average Asking Price | Gross Yield |
|---|---|---|---|
| CH41 (Birkenhead Centre, Hamilton Square) | £778 | £132,138 | 7.1% |
| CH44 (Wallasey, Seacombe) | £790 | £171,726 | 5.5% |
| CH42 (Rock Ferry, Tranmere) | £734 | £162,333 | 5.4% |
| CH43 (Prenton, Oxton) | £860 | £272,342 | 3.8% |
| CH45 (Wallasey, New Brighton) | £750 | £239,788 | 3.8% |
| CH63 (Bromborough, Eastham) | Not enough data | £302,831 | Not enough data |
The yield spread across Birkenhead is 3.3 percentage points, from 3.8% to 7.1%. That is a wider range than most comparable areas and it maps onto the two-tier market. CH41, CH42, and CH44 sit above 5% and deliver income. CH43 and CH45 sit below 4% and rely on capital growth to justify the investment.
The yield gap is driven entirely by entry price, not by rent. Monthly rents across all five postcodes with data sit within a £126 range (£734 to £860). Asking prices span £140,000.
CH44 at 5.5% combines strong yield with the best exit liquidity. Its 79% turnover rate (from the Monthly Sales table) means properties sell quickly, and the asking price of £171,726 is accessible. For investors who want both income and the option to exit, CH44 is worth reading alongside CH41.
Is Birkenhead Rent High?
Across Birkenhead's five postcodes with rental data, rent takes between 23.2% and 27.2% of the local median gross monthly salary. Rent affordability matters from both sides. For tenants, it determines whether they can sustain payments long-term. For landlords, areas where rent takes a smaller share of income tend to produce more reliable tenants and fewer arrears.
The median gross weekly salary in Wirral is £731.00, which equates to £3,168 per month or £38,010 per year. This is above the North West regional median of £720.10 per week and below the Great Britain median of £752.40 per week. Data from the Nomis Labour Market Profile (ASHE 2025).
Every single postcode sits below the 30% affordability threshold. That is rare. In most locations covered by PIUK guides, at least one or two postcodes breach 30%. Birkenhead's combination of moderate rents and above-regional earnings keeps the entire area in affordable territory.
| Rank | Area | Rent as % of Income |
|---|---|---|
| 1 | CH43 (Prenton, Oxton) | 27.2% |
| 2 | CH44 (Wallasey, Seacombe) | 24.9% |
| 3 | CH41 (Birkenhead Centre, Hamilton Square) | 24.6% |
| 4 | CH45 (Wallasey, New Brighton) | 23.7% |
| 5 | CH42 (Rock Ferry, Tranmere) | 23.2% |
| — | CH63 (Bromborough, Eastham) | Not enough data |
CH43 at 27.2% is the highest but still comfortably below the 30% threshold. This is the postcode with the highest absolute rents (£860/month) but also the area most likely to attract higher-earning tenants. Professional families in Prenton and Oxton typically earn above the Wirral median, which means the effective affordability is better than the headline figure suggests.
CH42 at 23.2% is the most affordable postcode for tenants. Rents of £734 per month against a median income of £3,168 per month leave significant headroom. For landlords, that headroom translates into lower arrears risk and more sustainable tenancies. CH42 also delivers 5.4% yield, so the affordability does not come at the expense of investor returns.
Thinking of Buying?
We have off-market investment properties averaging 8%+ annual yield.
View Property DealsBuy-to-Let Considerations
Are Birkenhead House Prices High? Price-to-Earnings Ratios
Purchasing a property in Birkenhead requires between 3.5 and 8.0 times the local median annual salary of £38,010. The price-to-earnings ratio compares a postcode's average asking price to that salary figure. Lower ratios mean more affordable entry points relative to local wages. The national benchmark is 7.5x, calculated from England's average sold price of £291,865 against Great Britain's median annual salary of £39,125.
Source: Nomis Labour Market Profile for Wirral (ASHE 2025).
Five of Birkenhead's six postcodes sit below the national benchmark of 7.5x. CH41 at 3.5x is one of the lowest price-to-earnings ratios across all PIUK location guides. That figure means a property in CH41 costs less than four years' gross salary. Even CH45 at 6.3x sits comfortably below the national benchmark.
| Rank | Area | Price-to-Earnings Ratio |
|---|---|---|
| 1 | CH41 (Birkenhead Centre, Hamilton Square) | 3.5x |
| 2 | CH42 (Rock Ferry, Tranmere) | 4.3x |
| 3 | CH44 (Wallasey, Seacombe) | 4.5x |
| 4 | CH45 (Wallasey, New Brighton) | 6.3x |
| 5 | CH43 (Prenton, Oxton) | 7.2x |
| 6 | CH63 (Bromborough, Eastham) | 8.0x |
The three cheapest postcodes all sit below 4.5x. CH41 at 3.5x, CH42 at 4.3x, and CH44 at 4.5x. These are the same postcodes that deliver the strongest yields (7.1%, 5.4%, and 5.5%). Affordable entry relative to local wages and strong rental returns in the same postcodes is a combination that supports sustainable buy-to-let investment. Tenants in these areas can afford the rent. Investors can afford to enter.
CH63 at 8.0x is the only postcode above the national benchmark. Bromborough and Eastham attract commuter families who value M53 access and good schools. The premium reflects lifestyle demand rather than investor value. With no rental data available, CH63 is difficult to assess as a buy-to-let proposition from the data alone.
Deposit Requirements in Birkenhead
At 30% deposit, entry costs in Birkenhead range from £39,641 in CH41 to £90,849 in CH63. Most buy-to-let mortgage lenders require a minimum 25% deposit. The table below uses the more conservative 30% figure to reflect the rates and products available at higher loan-to-value ratios. A 30% deposit typically unlocks better interest rates, which matters for cash flow in a yield-driven market.
The difference between the cheapest and second cheapest deposit is just £9,059. That gap buys the difference between a 7.1% yield postcode and a 5.4% yield postcode. Both are strong returns for the capital committed.
| Rank | Area | 30% Deposit Required |
|---|---|---|
| 1 | CH41 (Birkenhead Centre, Hamilton Square) | £39,641 |
| 2 | CH42 (Rock Ferry, Tranmere) | £48,700 |
| 3 | CH44 (Wallasey, Seacombe) | £51,518 |
| 4 | CH45 (Wallasey, New Brighton) | £71,936 |
| 5 | CH43 (Prenton, Oxton) | £81,703 |
| 6 | CH63 (Bromborough, Eastham) | £90,849 |
Three postcodes require deposits under £52,000. CH41 at £39,641, CH42 at £48,700, and CH44 at £51,518. All three deliver yields above 5%. For investors searching for buy-to-let property for sale across the North West, these are among the lowest deposit requirements available for yields in this range. Liverpool's cheapest postcodes require similar deposits but Birkenhead's regeneration pipeline adds a growth angle that inner Liverpool cannot match.
The step up to CH45 at £71,936 buys coastal New Brighton living but drops the yield to 3.8%. That extra £20,000 over CH44 does not improve income returns. It buys location premium and potential capital growth. Investors looking purely at cash flow would stay in the sub-£52,000 tier.
Deposit is only part of the upfront cost. Budget for stamp duty (use our stamp duty calculator for an accurate figure), legal fees, and survey costs. For a full breakdown, see our guide to buy-to-let costs.

What the Birkenhead Data Tells Buy-to-Let Investors
For yield, the numbers favour CH41 (7.1%), CH44 (5.5%), and CH42 (5.4%). All three sit below 4.5x price-to-earnings with 30% deposits between £39,641 and £51,518. CH41 stands out as the headline postcode: highest yield, strongest five-year growth (37.5%), lowest entry price, and the most affordable price-to-earnings ratio in the area at 3.5x. The trade-off is volume. Just 15 sales per month and 27% turnover mean fewer buying opportunities and a thinner resale market, which is where sourcing off-market properties can help.
For growth, CH41 (37.5%) and CH44 (37.3%) delivered the strongest five-year appreciation. CH44 adds something CH41 cannot match: liquidity. With 33 sales per month and 79% turnover, CH44 offers both growth track record and exit flexibility. Read the two postcodes together. CH41 for maximum yield, CH44 for the balanced play.
CH43, CH45, and CH63 serve a different investor profile. CH43 at £272,342 with 3.8% yield and 14.7% five-year growth is a premium residential hold. CH45 at 3.8% yield trades on its New Brighton coastal position, which may also suit investors exploring Airbnb properties for sale. CH63 has no rental data and the highest entry price at £302,831. These postcodes work for investors prioritising tenant quality and long-term capital preservation over cash flow.
Wirral Council operates a selective licensing scheme in parts of CH41 and CH42. Landlords in designated areas need a property licence. Factor this into running costs.
How Birkenhead Buy-to-Let Compares to Nearby Areas
Birkenhead's top yield of 7.1% sits just 0.4 percentage points behind Liverpool (7.5%) and ahead of Wigan (6.1%), St Helens (5.0%), and Chester (4.3%). The table below compares Birkenhead against four nearby areas using the same methodology: mean asking price across all postcodes, mean monthly rent across postcodes with data, and top single-postcode gross yield.
| Location | Mean Asking Price | Mean Monthly Rent | Top Gross Yield |
|---|---|---|---|
| Liverpool | £206,849 | £872 | 7.5% |
| Birkenhead | £213,526 | £782 | 7.1% |
| Wigan | £229,966 | £890 | 6.1% |
| St Helens | £235,379 | £934 | 5.0% |
| Chester | £334,810 | £1,091 | 4.3% |
Birkenhead sits just above Liverpool on mean asking price but trails on absolute rent and top yield. Liverpool's L5 delivers 7.5% against Birkenhead's 7.1% in CH41. The gap is narrow. What Birkenhead adds is the regeneration angle. Wirral Waters' £4.5 billion masterplan has no equivalent in Liverpool's inner postcodes. Investors who see value in buying ahead of infrastructure investment may find Birkenhead's discount to Liverpool a more interesting entry point than Liverpool itself.
Wigan and St Helens offer higher absolute rents but lower top yields. St Helens at 5.0% top yield requires a mean asking price of £235,379. Birkenhead matches that yield with CH42 (5.4%) at a mean price £73,000 lower. For yield-per-pound-invested, Birkenhead leads this group alongside Liverpool.
Chester is the premium outlier. Mean asking prices of £334,810 and a top yield of 4.3% place it in a different category. Chester's historic centre commands a lifestyle premium that compresses yields. For investors comparing capital efficiency across the region, Birkenhead and Liverpool deliver significantly more rental income per pound of deposit than Chester or St Helens.
Frequently Asked Questions
Is Birkenhead part of Liverpool?
No. Birkenhead sits within the Wirral metropolitan borough, which is a separate local authority from Liverpool. The two are connected by the Mersey Tunnel (road) and Mersey Rail (train), with Hamilton Square to Liverpool Central taking under ten minutes. Wirral has its own council, its own council tax bands, and its own planning authority. For investors, the distinction matters because Wirral's selective licensing schemes, landlord regulations, and local housing policies differ from Liverpool's.
Is Birkenhead a nice place to live?
It depends on the postcode. The data shows a wide range across postcodes. CH43 (Prenton, Oxton) has the highest asking prices at £272,342 and attracts families with established schools and green spaces. CH45 (New Brighton) has undergone significant seafront regeneration with Marine Point and the refurbished promenade. CH41 and CH42 are the most affordable postcodes and carry higher deprivation indices, but they are also where the largest regeneration investment is concentrated. The Wirral Waters and Hind Street projects are specifically targeted at transforming the CH41 area. The answer depends on which postcode. The data ranges are wide enough that each area serves a different demographic.
How does Birkenhead compare to Liverpool for buy-to-let?
Liverpool offers a slightly higher top yield (7.5% vs 7.1%) and higher average rents (£872 vs £782 mean monthly). Birkenhead counters with lower mean asking prices (£213,526 vs £206,849) and a £4.5 billion regeneration pipeline through Wirral Waters that has no direct equivalent in Liverpool's inner postcodes. Both locations offer sub-£40,000 deposits at 30%. For investors with capital for one property, Liverpool has marginally better immediate income. For investors positioning ahead of infrastructure-driven growth, Birkenhead's investment property pipeline carries a distinct angle.
When will Wirral Waters affect Birkenhead property prices?
It already is, incrementally. Wirral Waters is a multi-decade, multi-phase regeneration programme. Millers Quay residential is completed and occupied. MEA Park West has delivered £16 million in employment space. The Hind Street Urban Garden Village is approved with £51 million in public funding. These are not future plans. Construction is underway. The price data already shows CH41 delivering 37.5% five-year growth from a low base. Whether that growth is directly caused by the regeneration or by the broader post-pandemic uplift in affordable areas is impossible to separate. The investment is real and ongoing. The price impact will build incrementally as each phase completes, not as a single event.
Can I find buy-to-let property in Birkenhead under £100,000?
Individual flats and terraced houses in CH41 and CH42 do list below £100,000. The average asking prices in this guide range from £132,138 (CH41) to £302,831 (CH63), but these are postcode averages across all property types. Wirral's average flat price of £124,622 from the Land Registry confirms that sub-£100,000 stock exists, particularly ex-local authority properties and smaller units. At that price point, a 30% deposit is under £30,000. Due diligence on lease length, service charges, building condition, and actual tenant demand is essential at the lower end of the market.
Are there new builds in Birkenhead?
Wirral Waters is delivering new-build residential stock in Birkenhead. Millers Quay, the first completed residential phase within the Wirral Waters masterplan, is built and occupied. The wider programme includes plans for up to 13,000 new homes across the East Float and West Float docklands. The Hind Street Urban Garden Village will add over 1,500 homes in a separate scheme south of the town centre. New-build supply in Birkenhead is concentrated in CH41 and linked directly to the regeneration pipeline rather than volume housebuilder estates.