Croydon Property Investment: Best Buy-to-Let Areas
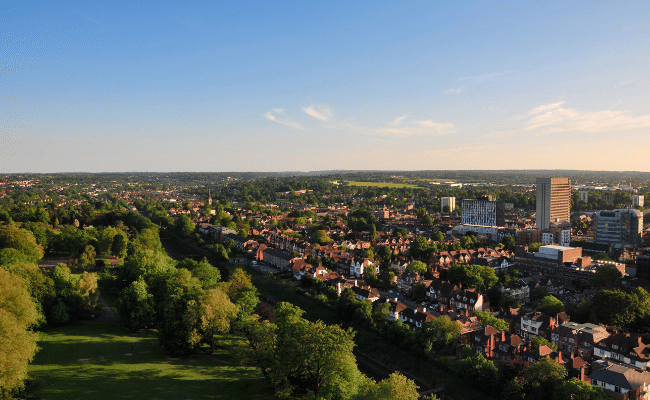
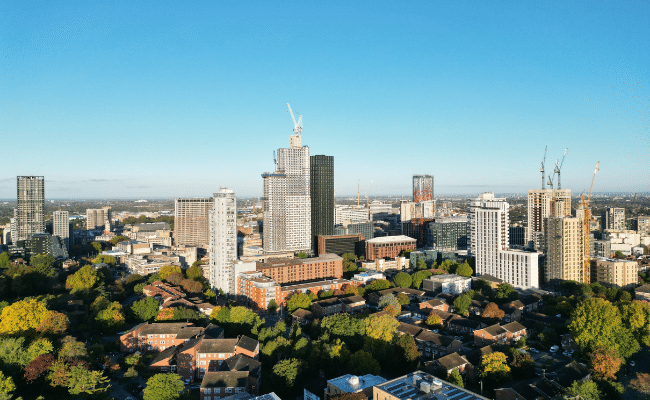
Croydon provides for all types of residents, from the Victorian terraces of Thornton Heath to the leafy streets of Coulsdon near the Surrey border. This is London living that feels like a true blend of City and Suburbs.
It's just 15 minutes from London Bridge, yet with Crystal Palace Park and South Norwood Country Park on your doorstep.
Development is taking place across the borough, with investment pouring in to a new Town Centre regeneration and Cheyne Capital's £210 million purchase of a vacant office block site to create 569 new homes opposite East Croydon station.
Buyer demand is strong in Croydon, with it's regeneration story attracting homeowners, tenants and investors to the borough. The data shows the story, with some postcodes achieving significant property sale transaction volume and steady, continuing house price growth.
Article updated: June 2025
Croydon Buy-to-Let Market Overview 2025
Croydon's property market offers investors genuine value and solid fundamentals compared to London averages, with attractive yields and consistent growth potential. With CR7 (including Thornton Heath) showing the strongest five-year price growth while CR0 (including central Croydon) delivers the highest rental yields alongside exceptional sales activity.
- Price range: £368,811 (CR0) to £636,309 (CR5)
- Rental yields: 3.5% to 5.1% across different postcodes
- Rental income: Weekly rents from £355 to £431 (monthly: £1,538 to £1,868)
- Price per sq ft: Good value across the borough from £416/sq ft to £586/sq ft
- Affordability: Property prices range from 9.12 to 15.74 times local annual salaries
Contents

-
by Robert Jones, Founder of Property Investments UK
With two decades in UK property, Rob has been investing in buy-to-let since 2005, and uses property data to develop tools for property market analysis.
Property Data Sources
Our location guide relies on diverse, authoritative datasets including:
- HM Land Registry UK House Price Index
- Ministry of Housing, Communities and Local Government
- Government Planning and Housing Data
- Propertydata.co.uk
We update our property data quarterly to ensure accuracy. Last update: June 2025. All data is presented as provided by our sources without adjustments or amendments.
Why Invest in Croydon?
Croydon provides some real value compared to many other Greater London boroughs, with average sold house prices 29.9% below the London average, making it one of the capital's most sensible entry points for new landlords.
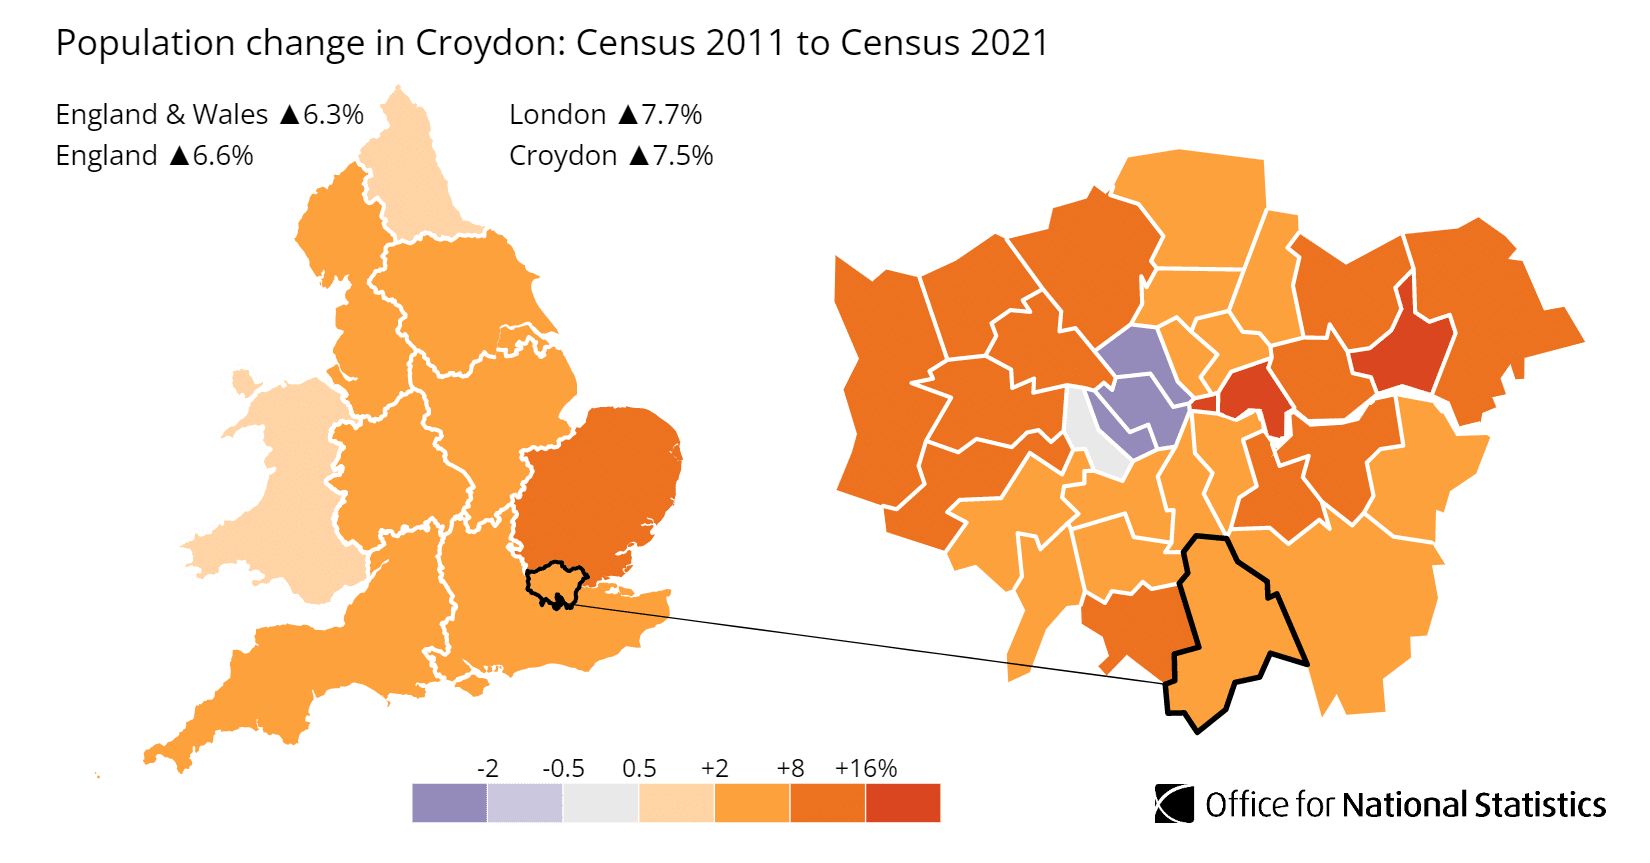
Croydon total population growth is actually slightly higher than the UK average and higher than the average Greater London population growth.
The total population of Croydon was 390,700 (as of the 2021 UK government census) and its population has increased by 7.5%, growing from 363,400 in 2011.
Croydon includes well-established communities such as central Croydon, South Croydon, Thornton Heath, Crystal Palace, South Norwood, Purley, Coulsdon, Caterham, and Warlingham.
The borough is primarily covered by the postcodes: CR0, CR2, CR3, CR5, CR6, CR7, CR8, SE19, and SE25.
With additional postcodes that cross Croydon and other local London Boroughs including:
- CR4 (Mitcham) crosses Croydon and Merton
- SW16 (Streatham) crosses Croydon and Lambeth
- SE20 (Penge) crosses Croydon and Bromley
What makes Croydon special isn't just the regeneration headlines. It's the combination of housing styles from the Victorian terraces of Thornton Heath to the leafy streets near the Surrey border. It's that rare balance of sensible commute times to the centre of London, access to green space and with property prices that are still below Greater London averages.
Croydon Property Market Analysis
When Was the Last House Price Crash in Croydon?
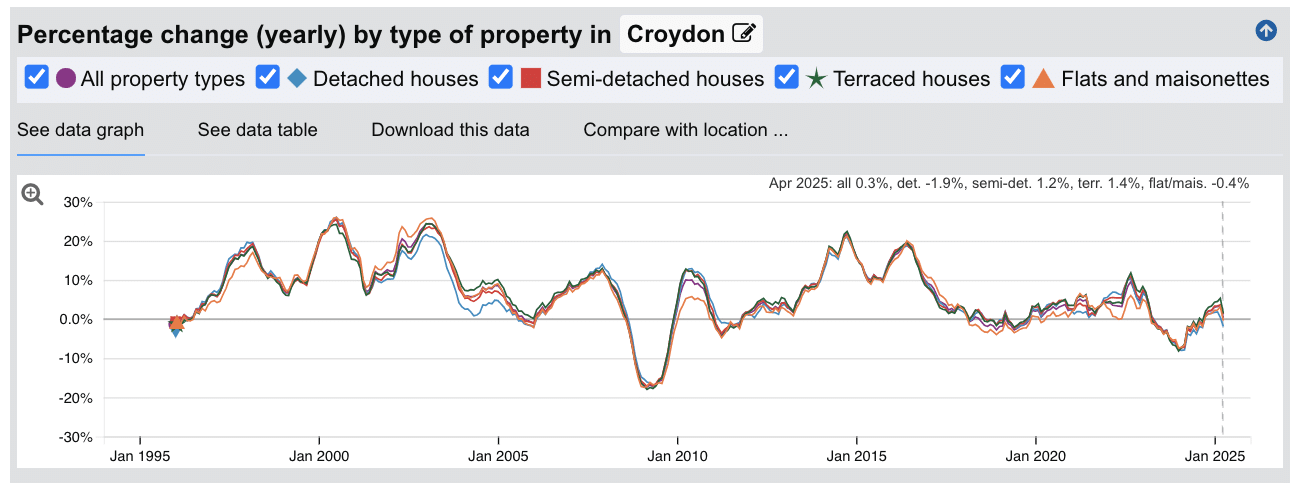
The last significant property price crash in Croydon occurred during the global financial crisis of 2008-2010, with a smaller correction in late 2019 and then again in April 2023.
Source: HM Land Registry House Price Index for Croydon
Looking at the property data across all types:
- 1995-2000: Steady, sensible growth, yet with some high annual increases around 5-16%
- 2000-2004: Accelerated growth with annual peaks reaching 26%. The kind of rise that felt exciting at the time but looking back was somewhat unsustainable.
- 2004-2007: Growth slowed to less than 10% per annum and then less than 2% year on year growth in Feb 2006.
- 2008-2010: The financial crisis hit hard, with values dropping around 15% at the peak in 2009
- 2010-2014: Slow, patient recovery after a boom in early 2010.
- 2014-2016: Saw highs of 20% annual growth again.
- 2016-2022: Showed a more measured growth with a small correction in 2019.
- 2022-2025: Despite the previous run, house prices took a hit again in 2023 and dropping to a new low of -7.8% annual change by Jan 2024. Then rebounding to a more stable 3.6% annual year on year growth by March 2025
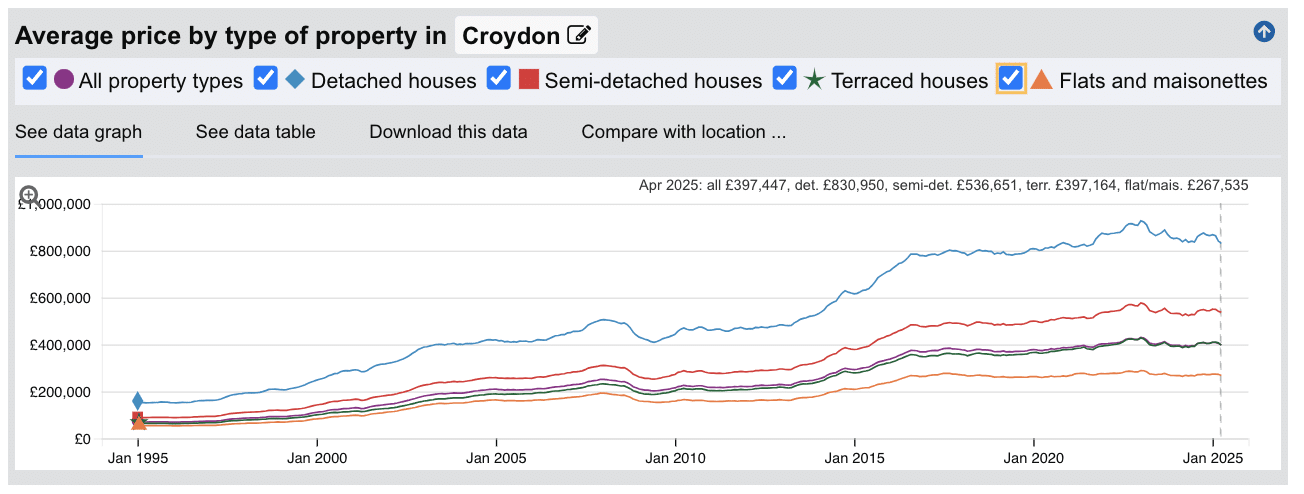
The long-term picture tells a compelling story. Properties that cost on average £70,118 in 1995 are now worth over £397,447. That's nearly six times the original value.
House Prices in Croydon: Sold (£)
The latest sold house price index by the Land Registry, shows the following average sold house prices across the London Borough of Croydon.
While detached houses in Croydon offer a significant discount at 30.1% below the London average, semi-detached houses provide also provide 26.4% below typical London prices, which is great for families looking for extra space in their budget.
Terraced houses in Croydon represent even more meaningful savings at 37.8% below London averages, while flats and maisonettes offer the most significant discount for the borough coming in 40.4% below typical London prices.
These reduced prices sound great, however the reality remains challenging for local buyers with average detached houses selling at £830,950.
But the opportunity looks to be in flats and maisonettes where average prices are only £267,535 (considering it's proximity to the centre of London these prices are more similar to premium areas of the Manchester buy-to-let market) . When you combine that entry point with the rental yields and growth we've explored, it becomes clear why experienced landlords have been quietly building portfolios in this borough. It's that rare combination of London benefits without London premiums.
For landlords focused on their buy-to-let checklist of affordability, tenant demand and potential growth from the surging London population, Croydon has a lot to offer.
Updated June 2025
| Property Type | Croydon Average Price | London Average | Difference |
|---|---|---|---|
| Detached houses | £830,950 | £1,189,033 | -30.1% |
| Semi-detached houses | £536,651 | £728,867 | -26.4% |
| Terraced houses | £397,164 | £638,160 | -37.8% |
| Flats and maisonettes | £267,535 | £449,067 | -40.4% |
| All property types | £397,447 | £566,614 | -29.9% |
Property Data Sources
Our location guide relies on diverse, authoritative datasets including:
- HM Land Registry UK House Price Index
- Ministry of Housing, Communities and Local Government
- Government Planning and Housing Data
- Propertydata.co.uk
We update our property data quarterly to ensure accuracy. Last update: June 2025. All data is presented as provided by our sources without adjustments or amendments.
House Prices in Croydon: For Sale Asking Prices (£)
Updated June 2025
The data represents the average asking prices of properties currently listed for sale in Croydon.
| Rank | Area | Average House Price |
|---|---|---|
| 1 | CR5 (Coulsdon) | £636,309 |
| 2 | CR6 (Warlingham) | £584,030 |
| 3 | CR8 (Purley) | £572,383 |
| 4 | CR2 (South Croydon) | £503,167 |
| 5 | SE19 (Crystal Palace) | £469,416 |
| 6 | CR3 (Caterham) | £469,746 |
| 7 | CR7 (Thornton Heath) | £417,010 |
| 8 | SE25 (South Norwood) | £371,017 |
| 9 | CR0 (Croydon) | £368,811 |
These prices reveal why Croydon appeals to investors at different stages. You can start in CR0 (central Croydon) at £368,811 and work your way up to CR5 (Coulsdon) at £636,309 as your portfolio grows. That £267,498 spread between highest and lowest means genuine choice based on your situation. CR0 keeps impressing at £368,811 house price averages. The middle ground around CR7 (Thornton Heath) at £417,010 offers that combination of affordability with the strongest five-year growth we've seen. Even CR5 at the top feels reasonable when you consider it's actually below Greater London's average house price, yet you're buying into leafy streets near the Surrey border.
Sold Price Per Square Foot in Croydon (£)
Updated June 2025
The data represents the average sold price per square foot of properties actually sold in Croydon over the past 18 months.
| Rank | Area | Price Per Square Foot |
|---|---|---|
| 1 | SE19 (Crystal Palace) | £586 |
| 2 | CR6 (Warlingham) | £498 |
| 3 | CR5 (Coulsdon) | £495 |
| 4 | SE25 (South Norwood) | £478 |
| 5 | CR2 (South Croydon) | £471 |
| 6 | CR8 (Purley) | £464 |
| 7 | CR3 (Caterham) | £459 |
| 8 | CR0 (Croydon) | £439 |
| 9 | CR7 (Thornton Heath) | £416 |
SE19 (Crystal Palace) commands premium pricing at £586 per square foot, reflecting its position near the famous park and sports centre. But here's what matters for practical buyers: CR7 (Thornton Heath) offers value at £416 per square foot. CR0 (central Croydon) is a little higher and sits at £439 per square foot, modest pricing for somewhere experiencing such extensive regeneration. The £170 per square foot spread between highest and lowest areas, can mean the difference between an extra bedroom or garden space that changes everything for families.
House Price Growth in Croydon (%)
Updated June 2025
The data represents the average house price growth over the past five years, calculated using a blended rolling annual comparison of both sold prices and asking prices.
| Rank | Area | 5 Year Growth |
|---|---|---|
| 1 | CR7 (Thornton Heath) | 19.5% |
| 2 | CR3 (Caterham) | 14.5% |
| 3 | SE25 (South Norwood) | 11.7% |
| 4 | CR6 (Warlingham) | 11.6% |
| 5 | CR0 (Croydon) | 10.3% |
| 6 | CR2 (South Croydon) | 9.7% |
| 7 | SE19 (Crystal Palace) | 9.3% |
| 8 | CR5 (Coulsdon) | 6.6% |
| 9 | CR8 (Purley) | 1.0% |
CR7 (Thornton Heath) has quietly delivered the strongest growth at 19.5% over five years, benefiting from its proximity to Norwood Junction and the growing appeal of its Victorian terraces. CR3 (Caterham) follows with solid 14.5% growth, reflecting buyer interest in its position on the edge of the Surrey Hills. While CR0 (central Croydon) shows steady 10.3% growth despite all the regeneration investment. Considering many areas of London have experienced a recent downturn or slight reduction in prices, this growth is actually pretty solid. On the other hand, CR8 (Purley) has barely moved at 1.0%. This suggests buyers have valued affordability and potential over established premium areas.
Average Monthly Property Sales in Croydon
Updated June 2025
The data represents the average number of residential property sales per month across Croydon's postcode districts, based on transactions recorded over the past 3 months.
| Rank | Area | Average Monthly Sales |
|---|---|---|
| 1 | CR0 (Croydon) | 92 |
| 2 | CR2 (South Croydon) | 35 |
| 3 | SE19 (Crystal Palace) | 28 |
| 4 | SE25 (South Norwood) | 28 |
| 5 | CR3 (Caterham) | 27 |
| 6 | CR7 (Thornton Heath) | 20 |
| 7 | CR5 (Coulsdon) | 18 |
| 8 | CR8 (Purley) | 18 |
| 9 | CR6 (Warlingham) | 9 |
CR0 (central Croydon) shows remarkable activity with 92 sales monthly - that's three properties changing hands every day which impressive when you consider the performance of the rest of the borough. This level of turnover reflects genuine buyer confidence in the regeneration story. CR2 (South Croydon) maintains steady momentum with 35 monthly sales, while SE25 (South Norwood) matches SE19 (Crystal Palace) at 28 sales each. For those developers relying on flipping, CR6 (Warlingham) moves much more slowly with only 9 sales per month on average. This could cause concern for those owners looking for faster sales and more active buyers.Remember that these figures represent the entire market, including different property types and price points, so individual segments may experience faster or slower sales rates.
Planning Applications in Croydon
Updated June 2025
The data represents the average number of planning applications submitted per month in each postcode district, along with the percentage of applications that receive approval.
| Rank | Area | Monthly Applications | Success Rate |
|---|---|---|---|
| 1 | CR0 (Croydon) | 128 | 70% |
| 2 | CR2 (South Croydon) | 56 | 73% |
| 3 | CR3 (Caterham) | 38 | 89% |
| 4 | SE19 (Crystal Palace) | 31 | 81% |
| 5 | CR8 (Purley) | 30 | 67% |
| 6 | CR7 (Thornton Heath) | 29 | 63% |
| 7 | SE25 (South Norwood) | 27 | 66% |
| 8 | CR5 (Coulsdon) | 26 | 75% |
| 9 | CR6 (Warlingham) | 12 | 82% |
CR0 (central Croydon) dominates planning activity with 128 applications monthly, reflecting the ongoing town centre regeneration around East Croydon station. CR3 (Caterham) stands out with an impressive 89% approval rate from 38 monthly applications, suggesting straightforward planning processes near the Surrey border. The contrast is telling: while CR7 (Thornton Heath) and SE25 (South Norwood) show much lower approval rates around 63-66%.
Property Data Sources
Our location guide relies on diverse, authoritative datasets including:
- HM Land Registry UK House Price Index
- Ministry of Housing, Communities and Local Government
- Government Planning and Housing Data
- Propertydata.co.uk
We update our property data quarterly to ensure accuracy. Last update: June 2025. All data is presented as provided by our sources without adjustments or amendments.
Croydon Rental Market Analysis
For those first-time buyers buying their first rental property, and thinking how much can you charge for rent across the South London borough of Croydon?
The rental data below gives you an indication on the rental income per month and the rental yields landlords can aim to achieve for traditional assured shorthold tenants. This is helpful if you are starting a residential property portfolio in Croydon.
Rental Prices in Croydon (£)
Updated June 2025
The data represents the average monthly rent for long-let AST properties in Croydon. These figures reflect rents across all property types and do not account for differences in property size, number of bedrooms, or short-term lets.
| Rank | Area | Average Weekly Rent | Average Monthly Rent |
|---|---|---|---|
| 1 | CR5 (Coulsdon) | £431 | £1,868 |
| 2 | CR8 (Purley) | £413 | £1,790 |
| 3 | SE19 (Crystal Palace) | £407 | £1,764 |
| 4 | CR3 (Caterham) | £406 | £1,759 |
| 5 | CR6 (Warlingham) | £399 | £1,729 |
| 6 | CR2 (South Croydon) | £398 | £1,725 |
| 7 | CR0 (Croydon) | £361 | £1,564 |
| 8 | CR7 (Thornton Heath) | £360 | £1,560 |
| 9 | SE25 (South Norwood) | £355 | £1,538 |
CR5 (Coulsdon) commands the highest rents at £431 weekly, reflecting its position near Coulsdon South station with direct trains to London Victoria. CR0 (central Croydon) offers a different proposition at £361 weekly - you're paying less for rent but gaining immediate access to East Croydon station's multiple rail lines. SE25 (South Norwood) presents the most compelling story for buy-to-let investors: the lowest rents in the borough at £355 weekly, yet South Norwood station connects directly to London Bridge in under 25 minutes.These figures represent average rents across all property types, from studio apartments to larger houses, and actual achievable rents can vary significantly based on property size, condition, and specific location within each postcode.
Gross Rental Yields in Croydon (%)
Updated June 2025
The data represents the average gross rental yields across different postcode districts in Croydon, calculated using a snapshot of current properties for sale and properties for rent. These figures are based on asking prices.
| Rank | Area | Gross Rental Yield |
|---|---|---|
| 1 | CR0 (Croydon) | 5.1% |
| 2 | SE25 (South Norwood) | 5.0% |
| 3 | CR3 (Caterham) | 4.5% |
| 4 | CR7 (Thornton Heath) | 4.5% |
| 5 | SE19 (Crystal Palace) | 4.5% |
| 6 | CR2 (South Croydon) | 4.1% |
| 7 | CR8 (Purley) | 3.8% |
| 8 | CR6 (Warlingham) | 3.6% |
| 9 | CR5 (Coulsdon) | 3.5% |
CR0 (central Croydon) leads with a strong 5.1% return, while SE25 (South Norwood) follows closely at 5.0%. What's particularly encouraging is how areas like CR3 (Caterham), CR7 (Thornton Heath), and SE19 (Crystal Palace) all offer solid 4.5% yields, giving you a couple of options that compete in both house prices and rental yields with locations further out of the City. The central and northern areas shine for income-focused investors, combining higher rental yields with excellent transport links to London's business districts. Remember that these figures represent gross rental yields before accounting for costs such as maintenance, void periods, and management fees.
Access our selection of exclusive, high-yielding, residential investment property deals and a personal consultant to guide you through your options.
Is Croydon Rent High?
Yes, Croydon's rental costs are high, when considering average local earnings, especially if you compare to regions outside of the Capital.
However, Croydon residents do on average see higher incomes and offer more reasonable rents than many London areas.
Average rent in Croydon consumes between 46.31% to 55.45% of local earnings based on the borough's mean annual income of £40,419.
The strain is most significant in CR5 (Coulsdon) where rents reach £431 per week. For a household relying on one local income, tenants need to dedicate 55.45% of their earnings to rent alone, leaving limited room for everyday expenses.
CR8 (Purley) presents similar challenges, with weekly rents of £413 requiring 53.13% of mean income.
Even in Croydon's most accessible areas, the picture remains challenging. CR0 (central Croydon) at 46.44% of income and CR7 (Thornton Heath) at 46.31% still demand nearly half of local earnings just for housing.
Here's what residents face across Croydon for rental costs as a percentage of incomes:
- CR5 (Coulsdon) - 55.45% of local income
- CR8 (Purley) - 53.13% of local income
- CR3 (Caterham) - 52.23% of local income
- SE19 (Crystal Palace) - 52.36% of local income
- CR2 (South Croydon) - 51.20% of local income
- CR6 (Warlingham) - 51.33% of local income
- CR0 (Croydon) - 46.44% of local income
- CR7 (Thornton Heath) - 46.31% of local income
- SE25 (South Norwood) - 45.67% of local income
This is significantly better than other London boroughs (like Bexley) that have similar house prices but lower average earnings.
For landlords, affordability is only part of the equation; the other part is how those rents translate to actual returns. In our London rental yields article, we have a breakdown of which parts of South London (and the rest of Greater London) have the best yields for landlords.
Buy-to-Let Considerations
Are Croydon House Prices High?
No, compared to the 32 London boroughs, Croydon offers genuinely affordable property prices while still providing London benefits and connectivity.
The borough's average 'sold' property price of £397,447 sits 49.7% above the UK average of £265,497, which may seem very high for the average UK property buyer, but looking deeper, it is actually a more manageable 29.9% below the London average of £566,614. This positions Croydon as an accessible entry point for investors and landlords wanting London exposure without London premiums.
Interestingly, the average asking prices across Croydon postcodes range from the most expensive CR5 (Coulsdon) at £636,309 (more inline with London averages) to the most affordable SE25 (South Norwood) at £371,017.
Looking at property types, larger family semi-detached and detached homes (like any area) push prices even higher yet still significantly below London averages.
Croydon shows detached homes averaging £830,950 (30.1% below London average), semi-detached houses at £536,651 (26.4% below London average), terraced properties at £397,164 (37.8% below London average), and flats at £267,535 (40.4% below London average).
These meaningful savings across all property types explain why income-focused buy-to-let investors looking for lower house prices with a South London postcode are drawn to Croydon.
Median annual earnings in Croydon are £38,040 (with 10.4% annual growth).
Mean annual earnings in Croydon are £40,419 (with 5.7% annual increase).
To afford an average priced house in Croydon, residents affordability ratios are:
- CR5 (Coulsdon) - 15.74 times mean annual salary
- CR6 (Warlingham) - 14.45 times mean annual salary
- CR8 (Purley) - 14.16 times mean annual salary
- CR2 (South Croydon) - 12.45 times mean annual salary
- CR3 (Caterham) - 11.62 times mean annual salary
- SE19 (Crystal Palace) - 11.61 times mean annual salary
- CR7 (Thornton Heath) - 10.32 times mean annual salary
- SE25 (South Norwood) - 9.18 times mean annual salary
- CR0 (Croydon) - 9.12 times mean annual salary
For local buyers on mean earnings, even Croydon's most affordable area, CR0 (including central Croydon), requires 9.12 times annual salary. This compares to London's overall ratio where the average house price of £566,614 and mean income of approximately £56,752 means buyers typically need about 9.99 times their salary.
This reveals something important: while Croydon offers better absolute value than most London areas, local residents still face significant affordability challenges. The gap between local earnings and housing costs remains substantial across the whole city and wider region of Greater London.
How Much Deposit to Buy a House in Croydon?
Assuming a 30% deposit for buy-to-let investments, here's an overview of deposit requirements across different Croydon postcodes:
Central Croydon
- CR0 (including Croydon): Investors considering properties near East Croydon station and the town centre (typical value £368,811) would need to have a 30% deposit of £110,643 available.
- CR7 (including Thornton Heath): Properties close to Thornton Heath station require a 30% down payment of £125,103 based on median property values of £417,010.
Northern Croydon
- SE19 (including Crystal Palace): Purchasing near Crystal Palace Park and the National Sports Centre requires a 30% down payment of £140,825 based on average property values of £469,416.
- SE25 (including South Norwood): Property buyers looking near South Norwood Country Park need to allocate £111,305 for a 30% deposit on home prices averaging £371,017.
Southern Croydon
- CR2 (including South Croydon): Investors looking near South Croydon station should be prepared to have a 30% deposit of £150,950 for properties with average prices of £503,167.
- CR3 (including Caterham): Buy-to-let landlords buying near the Surrey border should budget for a 30% deposit of £140,924 on properties typically priced around £469,746.
Western Croydon
- CR5 (including Coulsdon): The area near Coulsdon South station requires a 30% deposit of £190,893 on properties typically valued at £636,309.
- CR8 (including Purley): Investors can purchase properties near Purley station with a 30% down payment of £171,715 based on average house prices of £572,383.
- CR6 (including Warlingham): Property investment near the North Downs requires a 30% deposit of £175,209 for properties averaging £584,030.
If you’re new to property, or just starting out through a property training course, CR0 offers an excellent entry point with deposit requirements of £110,643 and direct trains to many stops in under 30 minutes, including New Cross Gate in just 22 minutes. With rental yields of 5.1% and proximity to major employers, it's a solid choice for new landlords and those growing portfolios.
How to Invest in Buy-to-Let in Croydon
For properties to buy in Croydon, including:
- Finding off-market properties
- Buy-to-lets
- Buying a Holiday let or investing in serviced accommodation
- HMOs (houses of multiple occupation)
- PBSA (purpose-built student accommodation)
- and other high-yielding opportunities
We have partnered with the best property investment agents we can find for 8+ years.
Here you can get access to the latest investment property opportunities from our network.
For more information about specific areas:
- If you're interested in the highest rental returns in Croydon, consider CR0 (including Croydon central) with yields of 5.1% and SE25 (including South Norwood) at 5.0%, both offering strong rental returns with direct rail links to London Bridge in 19 minutes and London Victoria in 17 minutes.
- For an alternative look at the local London housing market, with affordable entry prices, check out our guide to the cheapest areas to live in London.
- For different opportunities further afield, consider exploring buy-to-let in Brighton or buy-to-let in Reading.
