Where to Buy Property Investments in Bromley: Yields of 5.2%
Bromley's top gross rental yield is 5.2% in SE20 (Penge, Anerley), where the mean asking price is £378,231. That is the lowest entry price across all 15 Bromley postcodes. The borough's average sold price of £528,759 sits 82% above the England average of £290,437. Bromley's population grew 6.66% between the 2011 and 2021 censuses, from 309,392 to 329,992.
Asking prices across Bromley's 15 postcodes range from £378,231 in SE20 to £776,315 in BR7 (Chislehurst), a gap of £398,084. That spread matters because it creates distinct entry tiers within a single local authority. Thirteen of the 15 postcodes return rental data, with monthly rents from £1,548 in BR8 (Swanley) to £2,182 in BR6 (Orpington). Gross yields run from 2.9% to 5.2%. Two postcodes, BR4 (West Wickham) and TN16 (Biggin Hill), have insufficient rental data to calculate a yield.
Bromley is a London borough in south-east London. This guide covers the London Borough of Bromley (ONS code E09000006), the largest London borough by area at 57.97 square miles. The borough stretches from Crystal Palace and Penge in the north-west to Biggin Hill in the south, bordering Croydon, Lewisham, Greenwich and Bexley. Several postcodes are shared with neighbouring boroughs: BR3 straddles Croydon and Lewisham, BR8 crosses into Bexley and Kent, DA14 crosses into Bexley, SE9 into Greenwich, SE19 into Croydon and Lambeth, SE20 into Croydon, SE26 into Lewisham and Lambeth, and TN14/TN16 extend into Kent. All data presented here is for the Bromley local authority area. Bromley is part of London.
Article updated: April 2026
Bromley Buy-to-Let Market Overview 2026
London's largest borough by area, with above-London-average earnings and asking prices spanning a £398,084 range across 15 postcodes.
- Average sold price: £528,759 (82% above England's £290,437)
- Asking price range: £378,231 (SE20, Penge, Anerley) to £776,315 (BR7, Chislehurst)
- Rental yields: 2.9% (BR7) to 5.2% (SE20) across 13 postcodes with rental data
- Rental income: Monthly rents from £1,548 (BR8, Swanley) to £2,182 (BR6, Orpington)
- Price per sq ft: House prices from £447/sq ft (BR8) to £596/sq ft (SE19)
- Market activity: Sales ranging from 13 per month (BR4) to 46 per month (BR1)
- Deposit requirements: 30% deposits range from £113,469 (SE20) to £232,894 (BR7)
- Affordability ratios: Property prices from 7.4 to 15.2 times Bromley's median annual salary of £51,225
Contents

-
by Robert Jones, Founder of Property Investments UK
With two decades in UK property, Rob has been investing in buy-to-let since 2005, and uses property data to develop tools for property market analysis.

Property Data Sources
Our location guide relies on diverse, authoritative datasets including:
- HM Land Registry UK House Price Index
- Ministry of Housing, Communities and Local Government
- Ordnance Survey Data Hub
- Propertydata.co.uk
We update our property data quarterly to ensure accuracy. Last update: April 2026. All data is presented as provided by our sources without adjustments or amendments.
Why Invest in Bromley?
Bromley's median gross weekly earnings are £985.10, higher than both the London regional median of £892.60 and the Great Britain median of £752.40. That translates to an annual salary of £51,225. Above-average earnings in a London borough matter for buy-to-let investors because they underpin tenant affordability. Bromley has no London Underground stations. Transport links rely on 26 railway stations, mainly operated by Southeastern, plus Tramlink services in the west of the borough and London Overground in the north-west. Bromley South station offers express services to London Victoria in 16 minutes.
The borough's employment rate stands at 80.5%. The 2021 Census recorded a population of 329,992, up 6.66% from 309,392 in 2011. Bromley is the largest London borough by area at 57.97 square miles, which means the borough contains a wide mix of property types, from Victorian terraces in Penge and Beckenham to detached family houses in Chislehurst and rural properties on the Kent border. Princess Royal University Hospital (PRUH), operated by King's College Hospital NHS Foundation Trust, is the main hospital. London South East Colleges (LSEC) is the principal further and higher education provider, with campuses in Bromley and Orpington.
Bromley Economic Summary
- Population: 329,992 (2021 Census). Growth of 6.66% from 2011.
- Median annual salary: £51,225 (local), £46,415 (London), £39,125 (Great Britain)
- Employment rate: 80.5% (local)
- Key transport: 26 railway stations (Southeastern), Tramlink, London Overground. No tube stations.
Source: ONS Census 2021, Nomis Labour Market Profile (ASHE 2025)
Regeneration and Investment in Bromley
Three regeneration projects worth a combined £26.8 million or more are reshaping Bromley's built environment, concentrated around the town centre and Crystal Palace Park.
- Crystal Palace Park Regeneration (Underway, £26.8m total): A £5 million National Lottery Heritage Fund grant is funding the restoration of 30 Grade I-listed dinosaur sculptures, improved pathways and ecological habitats. A further £21.8 million from land sales for affordable housing adjacent to the park is funding wider park improvements. Works began in May 2025, with completion expected Autumn 2026. Updates at Bromley Council.
- One Westmoreland Road (Approved, 138 homes): A mixed-use development of three to nineteen storeys near Bromley South station, delivering 107 build-to-rent homes, 31 later-living apartments, commercial office space and public realm improvements. Planning permission was granted in September 2025. Updates at Bromley Council.
- Waitrose Site Redevelopment, Masons Hill (Approved, 353 homes): A residential development adjacent to Bromley South station delivering 353 new homes, including 30 affordable units. Approved in July 2024, with a 45-month construction programme scheduled to commence in 2025. Updates at Bromley Council.

Bromley Property Market Analysis
When was the last house price crash in Bromley?
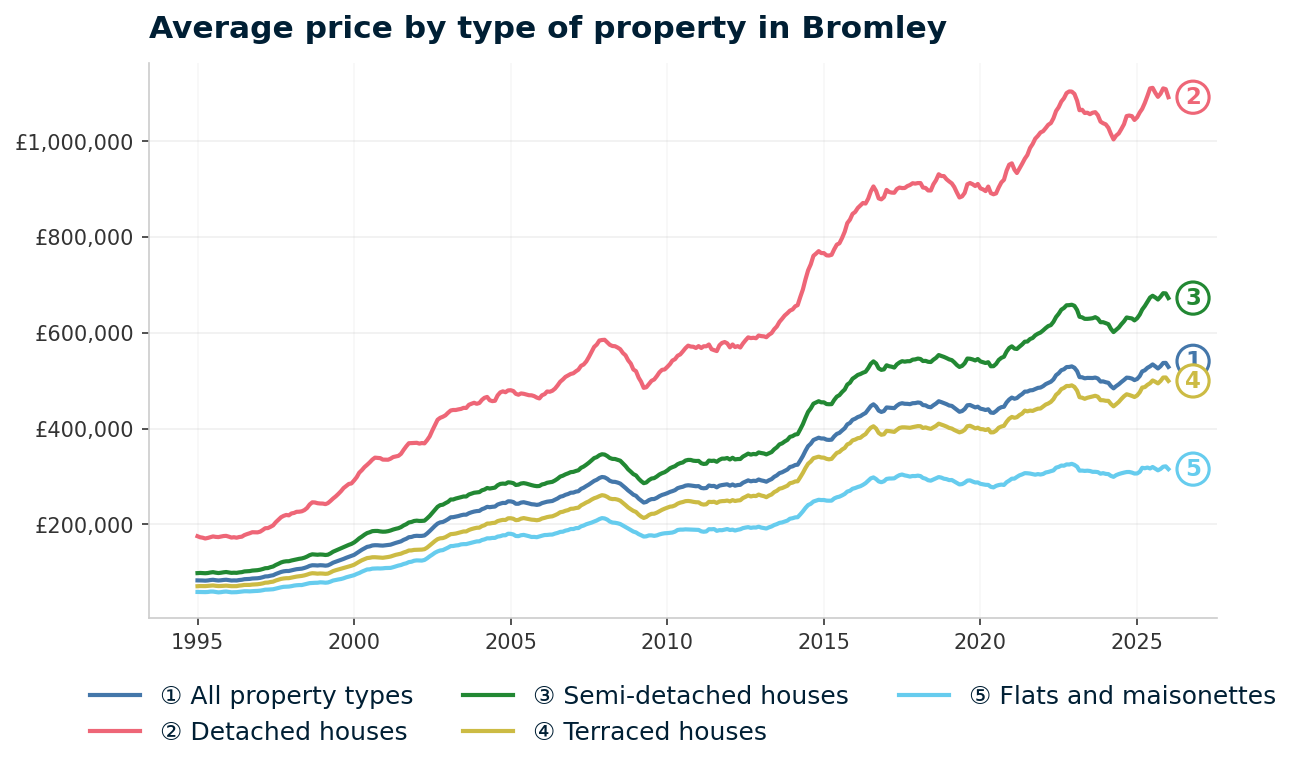
Bromley's average property price has risen from £83,082 in January 1995 to £528,759 in January 2026, a gain of 536.4% over 31 years. The Land Registry House Price Index tracks Bromley at borough level (London Borough of Bromley local authority area).
The early growth phase started from that £83,082 base. Over the following 12 years, prices rose sharply through two phases of growth.
- 1995 to 2000 (Early Growth): Prices rose from £83,082 to £136,311, a 64.1% increase in five years. The late-1990s London housing boom drove rapid gains across all outer boroughs.
- 2000 to 2007 (Extended Boom): Growth continued through low interest rates and buy-to-let mortgage expansion. By January 2007, the average price had reached £266,331, more than triple the 1995 starting point.
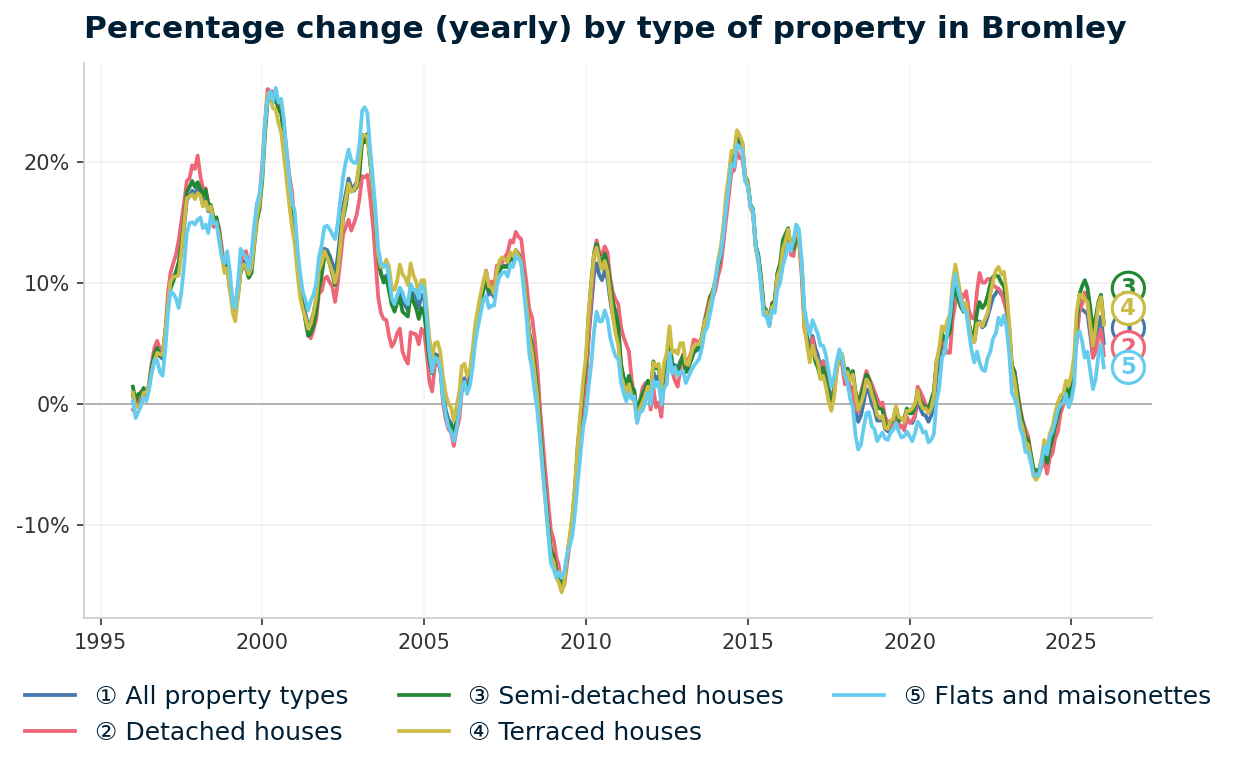
- 2007 to 2009 (The Financial Crisis): Bromley's pre-crash peak was £298,898 in December 2007. The trough came in April 2009 at £245,544, a decline of 17.9%. The worst annual change reading was -15.0% in April 2009. That decline was broadly in line with London as a whole (17.8% peak-to-trough) and close to England's 18.2% decline. Detached houses fell 17.1%, semi-detached 17.4%, terraced 18.2% and flats 18.1%, showing the correction hit all property types almost equally.
- 2009 to 2013 (Stagnation and Recovery): Prices began recovering slowly from mid-2009. By January 2011 the average had returned to £279,893. Growth stalled through 2012, with prices hovering between £280,000 and £292,000. Bromley first matched its pre-crash peak in June 2013 at £299,324, a recovery period of roughly four years and two months.
- 2014 to 2016 (Rapid Growth): Prices accelerated sharply once the pre-crash peak was cleared. January 2014 saw £321,161, rising 31% in just two years to £420,600 by January 2016. Help to Buy, low interest rates and strong London demand fuelled this phase.
- 2017 to 2019 (Plateau): Growth slowed. Prices rose from £444,077 in January 2017 to a brief dip at £448,233 in January 2019, a near-flat three-year period. Brexit uncertainty and stamp duty surcharge impacts weighed on London's outer boroughs.
- 2020 to 2022 (Pandemic Surge): The stamp duty holiday and the race for space lifted Bromley from £441,520 in January 2020 to £488,573 by January 2022, a 10.7% rise. Bromley's large houses and green space made it a pandemic beneficiary.
- 2023 (Rate Shock): Prices jumped to £526,961 in January 2023, then pulled back to £496,773 by January 2024 as mortgage rates rose sharply. That represents a 5.7% decline from the January 2023 reading.
- 2024 to 2026 (Current): The latest Land Registry figure is £528,759 in January 2026, a new record and a 5.0% year-on-year increase from January 2025's £503,544. The all-time high was £537,156 in December 2025.
What does 31 years of Bromley price data add up to?
- 5 years (2021-2026): 13.8% growth (£464,690 to £528,759)
- 10 years (2016-2026): 25.7% growth (£420,600 to £528,759)
- 15 years (2011-2026): 88.9% growth (£279,893 to £528,759)
- 20 years (2006-2026): 116.3% growth (£244,404 to £528,759)
- 30 years (1996-2026): 532.3% growth (£83,630 to £528,759)
Bromley's 17.9% crash decline was almost identical to the London and England averages. The recovery took just over four years. The 2023 rate-driven correction was shorter and shallower than 2008, and January 2026 prices have already surpassed the 2023 high.
Source: HM Land Registry House Price Index for Bromley, January 1995 to January 2026.
Thinking of Buying?
We have off-market investment properties averaging 8%+ annual yield.
View Property DealsSold House Prices in Bromley
The average sold price in Bromley is £528,759, which is 82% above the England average of £290,437. That premium runs across every property type, but the scale varies considerably. Flats carry the smallest gap. Detached and semi-detached houses carry the largest.
| Property Type | Bromley Average | England Average | Difference |
|---|---|---|---|
| Detached houses | £1,091,743 | £468,546 | +133.0% |
| Semi-detached houses | £672,408 | £288,046 | +133.4% |
| Terraced houses | £499,447 | £243,580 | +105.0% |
| Flats and maisonettes | £315,358 | £218,449 | +44.4% |
| All property types | £528,759 | £290,437 | +82.1% |
Detached houses in Bromley sell for an average of £1,091,743, more than double the England figure. This reflects the borough's stock of large period properties in postcodes like BR7 (Chislehurst) and TN14 (Cudham, Knockholt), where detached houses on substantial plots are common. The 133% premium is the kind of gap driven by scarcity: there is limited new detached supply in outer London, and Bromley's green belt land restricts further development.
Semi-detached houses show an almost identical premium at 133.4%, averaging £672,408. Bromley's semi-detached stock is concentrated in established suburban postcodes like BR2 (Hayes), BR5 (Petts Wood) and BR6 (Orpington), areas that attract families commuting into central London.
Terraced houses at £499,447 carry a 105% premium over England. The terraced stock sits mainly in the northern and western postcodes: BR1 (Bromley Town Centre), SE20 (Penge) and SE26 (Sydenham). These are the postcodes closer to Lewisham and Croydon, where Victorian terraces are more prevalent.
Flats and maisonettes at £315,358 show the narrowest premium at 44.4%. This is the property type where Bromley's prices come closest to the national average. For buy-to-let investors, flats represent the lowest absolute entry point in a borough where the average detached house is over £1 million.
Property Data Sources
Our location guide relies on diverse, authoritative datasets including:
- HM Land Registry UK House Price Index
- Ministry of Housing, Communities and Local Government
- Ordnance Survey Data Hub
- Propertydata.co.uk
We update our property data quarterly to ensure accuracy. Last update: April 2026. All data is presented as provided by our sources without adjustments or amendments.
Price Per Square Foot in Bromley
Sold prices per square foot in Bromley range from £447 in BR8 (Swanley) to £596 in SE19 (Crystal Palace), ranked cheapest first. Price per square foot strips out the effect of property size, so it measures what you pay for the physical space. The postcodes where price per square foot is highest are not the same as the postcodes with the highest asking prices, which tells you something about average property sizes in different parts of the borough.
| Rank | Area | Price Per Sq Ft |
|---|---|---|
| 1 | BR8 (Swanley) | £447 |
| 2 | TN16 (Biggin Hill) | £449 |
| 3 | DA14 (Sidcup, Foots Cray) | £480 |
| 4 | SE9 (Eltham, Mottingham) | £504 |
| 5 | BR1 (Bromley Town Centre, Bickley) | £513 |
| 6 | BR5 (St Mary Cray, Petts Wood) | £513 |
| 7 | BR4 (West Wickham) | £527 |
| 8 | TN14 (Cudham, Knockholt) | £527 |
| 9 | BR2 (Bromley Common, Hayes) | £542 |
| 10 | BR6 (Orpington, Chelsfield) | £548 |
| 11 | SE20 (Penge, Anerley) | £552 |
| 12 | BR3 (Beckenham) | £565 |
| 13 | BR7 (Chislehurst) | £574 |
| 14 | SE26 (Sydenham) | £575 |
| 15 | SE19 (Crystal Palace) | £596 |
SE19 (Crystal Palace) tops the table at £596 per square foot despite having only the ninth-highest asking price (£462,688). That combination points to smaller average property sizes in a postcode dominated by period conversions and purpose-built flats. Buyers in SE19 pay a premium per square foot for proximity to Crystal Palace Park and the north-west boundary with Lambeth and Lewisham.
BR8 (Swanley) at £447 per square foot is the least expensive per square foot and also the cheapest by asking price after SE20. Swanley sits at the borough's south-eastern edge, bordering Kent's Sevenoaks district. The lower price per square foot reflects its distance from central London and its larger average property sizes.
For Sale Asking Prices in Bromley
How far does price stretch across a single borough? From £378,231 in SE20 (Penge, Anerley) to £776,315 in BR7 (Chislehurst), a gap of £398,084. The mean asking price across all 15 postcodes is £539,178, pulled upward by the premium south and east postcodes. Eight postcodes sit below £500,000: SE20, DA14, BR8, SE19, SE26, SE9, BR5 and BR1.
| Rank | Area | Asking Price |
|---|---|---|
| 1 | SE20 (Penge, Anerley) | £378,231 |
| 2 | DA14 (Sidcup, Foots Cray) | £407,600 |
| 3 | BR8 (Swanley) | £445,631 |
| 4 | SE19 (Crystal Palace) | £462,688 |
| 5 | SE26 (Sydenham) | £474,613 |
| 6 | SE9 (Eltham, Mottingham) | £479,534 |
| 7 | BR5 (St Mary Cray, Petts Wood) | £492,145 |
| 8 | BR1 (Bromley Town Centre, Bickley) | £497,378 |
| 9 | BR3 (Beckenham) | £538,617 |
| 10 | TN16 (Biggin Hill) | £561,424 |
| 11 | BR2 (Bromley Common, Hayes) | £582,264 |
| 12 | BR6 (Orpington, Chelsfield) | £613,453 |
| 13 | TN14 (Cudham, Knockholt) | £654,251 |
| 14 | BR4 (West Wickham) | £723,520 |
| 15 | BR7 (Chislehurst) | £776,315 |
BR7 (Chislehurst) at £776,315 costs more than double SE20 (Penge, Anerley) at £378,231. That £398,084 gap within a single borough reflects the range from inner-suburban flat stock in the north-west to large detached houses in the leafy south-east. BR4 (West Wickham) and TN14 (Cudham, Knockholt) also sit above £650,000.
The sub-£500,000 tier contains eight postcodes, all located in the northern and western parts of the borough. These are the postcodes that share boundaries with Croydon, Lewisham, Greenwich and Bexley. For investors looking at buy-to-let properties, this tier offers the lowest entry deposits in the borough.

House Price Growth in Bromley
Five-year growth tells a different story from asking prices. The two postcodes with the strongest five-year growth are TN14 (Cudham, Knockholt) at 21.4% and BR8 (Swanley) at 19.2%. Both sit at the southern fringe of the borough, close to the Kent border. Meanwhile, DA14 (Sidcup, Foots Cray) is the standout negative at -1.7% over five years and -9.4% over one year.
| Area | 1 Year | 3 Years | 5 Years |
|---|---|---|---|
| TN14 (Cudham, Knockholt) | +5.8% | +5.6% | +21.4% |
| BR8 (Swanley) | +4.9% | +5.4% | +19.2% |
| BR7 (Chislehurst) | +7.1% | +5.1% | +16.5% |
| BR4 (West Wickham) | +4.3% | +2.2% | +12.6% |
| BR5 (St Mary Cray, Petts Wood) | +9.9% | +6.8% | +12.6% |
| BR6 (Orpington, Chelsfield) | -1.3% | +0.4% | +11.0% |
| TN16 (Biggin Hill) | +1.4% | -0.8% | +10.4% |
| SE9 (Eltham, Mottingham) | -0.1% | +2.5% | +10.3% |
| BR2 (Bromley Common, Hayes) | +1.7% | -0.1% | +9.8% |
| SE26 (Sydenham) | +9.5% | +11.1% | +7.5% |
| BR3 (Beckenham) | -0.4% | +0.5% | +6.7% |
| SE20 (Penge, Anerley) | -0.1% | +5.4% | +5.2% |
| BR1 (Bromley Town Centre, Bickley) | -0.6% | +2.2% | +4.8% |
| SE19 (Crystal Palace) | +2.8% | +9.1% | +1.1% |
| DA14 (Sidcup, Foots Cray) | -9.4% | -2.0% | -1.7% |
TN14 and BR8, the two fringe postcodes with the lowest price per square foot, have delivered the strongest five-year capital growth. One interpretation: these are the areas where affordability relative to the rest of the borough is still attracting buyers, pushing prices up from a lower base. BR5 (St Mary Cray, Petts Wood) shows a similar pattern, with 9.9% one-year growth and 12.6% over five years from a mid-range asking price of £492,145.
DA14 (Sidcup, Foots Cray) is the only Bromley postcode with negative growth across all three time windows. The -9.4% one-year reading is the sharpest single-year decline in the table. DA14 is shared with Bexley, and its data sits at the intersection of two local authority areas.
Monthly Property Sales in Bromley
Monthly sales volume and turnover rate tell you how liquid a postcode is. BR1 (Bromley Town Centre, Bickley) and SE9 (Eltham, Mottingham) record 46 and 45 sales per month respectively, but SE9's turnover rate of 16% is higher than BR1's 12%, meaning a larger share of SE9's stock changes hands each year.
| Area | Sales Per Month | Turnover | Asking Price |
|---|---|---|---|
| BR1 (Bromley Town Centre, Bickley) | 46 | 12% | £497,378 |
| SE9 (Eltham, Mottingham) | 45 | 16% | £479,534 |
| BR3 (Beckenham) | 44 | 13% | £538,617 |
| BR6 (Orpington, Chelsfield) | 44 | 11% | £613,453 |
| BR2 (Bromley Common, Hayes) | 42 | 9% | £582,264 |
| BR5 (St Mary Cray, Petts Wood) | 38 | 14% | £492,145 |
| SE19 (Crystal Palace) | 27 | 9% | £462,688 |
| SE26 (Sydenham) | 26 | 13% | £474,613 |
| BR7 (Chislehurst) | 22 | 15% | £776,315 |
| SE20 (Penge, Anerley) | 20 | 9% | £378,231 |
| DA14 (Sidcup, Foots Cray) | 20 | 13% | £407,600 |
| BR8 (Swanley) | 19 | 17% | £445,631 |
| TN16 (Biggin Hill) | 16 | 8% | £561,424 |
| TN14 (Cudham, Knockholt) | 15 | 8% | £654,251 |
| BR4 (West Wickham) | 13 | 16% | £723,520 |
BR8 (Swanley) has the highest turnover rate at 17%, despite recording only 19 sales per month. High turnover with moderate volume points to a smaller total housing stock turning over relatively quickly. BR4 (West Wickham) shows a similar pattern: 16% turnover but only 13 monthly sales, the lowest absolute volume in the borough.
TN14 and TN16, the two Kent-border postcodes, have the lowest turnover rates at 8%. Low turnover in high-value postcodes is typical of areas where owners hold properties for longer periods. These postcodes also have the lowest monthly sales volumes (15 and 16), which means less frequent transaction data.
Property Data Sources
Our location guide relies on diverse, authoritative datasets including:
- HM Land Registry UK House Price Index
- Ministry of Housing, Communities and Local Government
- Ordnance Survey Data Hub
- Propertydata.co.uk
We update our property data quarterly to ensure accuracy. Last update: April 2026. All data is presented as provided by our sources without adjustments or amendments.

Bromley Rental Market Analysis
For investors weighing up whether rental property is a worthwhile investment in Bromley, the data below breaks down average monthly rents and gross rental yields across the borough's postcodes.
Thirteen of Bromley's 15 postcodes return rental data. Monthly rents range from £1,548 in BR8 (Swanley) to £2,182 in BR6 (Orpington, Chelsfield). Gross yields span 2.9% to 5.2%. Two postcodes, BR4 (West Wickham) and TN16 (Biggin Hill), have insufficient rental transaction data. If you are looking to build a property portfolio in London, Bromley's combination of above-average local earnings and diverse postcode spread offers multiple entry points across different price bands.
Average Rent & Gross Rental Yields in Bromley
Where does the rental income actually stretch furthest relative to the purchase price? SE20 (Penge, Anerley) leads at 5.2%, driven by the combination of the lowest asking price in the borough (£378,231) and a monthly rent of £1,635. Gross rental yield is annual rent divided by asking price. For a detailed breakdown, see our guide to working out rental yield.
| Area | Monthly Rent | Asking Price | Gross Yield |
|---|---|---|---|
| SE20 (Penge, Anerley) | £1,635 | £378,231 | 5.2% |
| DA14 (Sidcup, Foots Cray) | £1,712 | £407,600 | 5.0% |
| SE9 (Eltham, Mottingham) | £1,889 | £479,534 | 4.7% |
| BR5 (St Mary Cray, Petts Wood) | £1,847 | £492,145 | 4.5% |
| SE19 (Crystal Palace) | £1,724 | £462,688 | 4.5% |
| BR1 (Bromley Town Centre, Bickley) | £1,801 | £497,378 | 4.3% |
| BR6 (Orpington, Chelsfield) | £2,182 | £613,453 | 4.3% |
| SE26 (Sydenham) | £1,701 | £474,613 | 4.3% |
| BR8 (Swanley) | £1,548 | £445,631 | 4.2% |
| BR3 (Beckenham) | £1,775 | £538,617 | 4.0% |
| BR2 (Bromley Common, Hayes) | £1,873 | £582,264 | 3.9% |
| TN14 (Cudham, Knockholt) | £1,782 | £654,251 | 3.3% |
| BR7 (Chislehurst) | £1,881 | £776,315 | 2.9% |
| BR4 (West Wickham) | Not enough data | £723,520 | Not enough data |
| TN16 (Biggin Hill) | Not enough data | £561,424 | Not enough data |
The yield table follows a clear pattern: every postcode with a yield of 4.5% or above has an asking price below £500,000. SE20, DA14, SE9, BR5 and SE19 form a cluster where rents between £1,635 and £1,889 produce yields of 4.5% to 5.2% on sub-£500,000 asking prices. Below that line, yields compress as asking prices rise faster than rents.
BR6 (Orpington, Chelsfield) commands the highest monthly rent at £2,182, but its £613,453 asking price pulls the yield down to 4.3%. BR7 (Chislehurst) shows the most extreme version of this: £1,881 rent on a £776,315 asking price produces the lowest yield in the borough at 2.9%. The rent is in line with the borough average, but the asking price is 44% above it.
Is Bromley Rent High?
Monthly rents in Bromley range from 36.3% to 51.1% of the local median gross monthly income. Rent as a percentage of income measures tenant affordability. Higher percentages mean tenants spend a larger share of their earnings on rent, which can affect payment reliability and void risk.
The median gross weekly salary in Bromley is £985.10, which equates to £4,269 per month or £51,225 per year. This is above the London regional median of £892.60 per week and the Great Britain median of £752.40 per week. Data from the Nomis Labour Market Profile (ASHE 2025).
| Rank | Area | Rent as % of Income |
|---|---|---|
| 1 | BR6 (Orpington, Chelsfield) | 51.1% |
| 2 | SE9 (Eltham, Mottingham) | 44.3% |
| 3 | BR7 (Chislehurst) | 44.1% |
| 4 | BR2 (Bromley Common, Hayes) | 43.9% |
| 5 | BR5 (St Mary Cray, Petts Wood) | 43.3% |
| 6 | BR1 (Bromley Town Centre, Bickley) | 42.2% |
| 7 | TN14 (Cudham, Knockholt) | 41.7% |
| 8 | BR3 (Beckenham) | 41.6% |
| 9 | SE19 (Crystal Palace) | 40.4% |
| 10 | DA14 (Sidcup, Foots Cray) | 40.1% |
| 11 | SE26 (Sydenham) | 39.9% |
| 12 | SE20 (Penge, Anerley) | 38.3% |
| 13 | BR8 (Swanley) | 36.3% |
| — | BR4 (West Wickham) | Not enough data |
| — | TN16 (Biggin Hill) | Not enough data |
BR6 (Orpington, Chelsfield) at 51.1% tops the table, pushed there by the borough's highest rent of £2,182 per month. Seven postcodes sit between 40% and 44%, forming a mid-range band. BR8 (Swanley) at 36.3% is the most affordable postcode for tenants, where £1,548 per month represents the smallest share of the local median income.
Thinking of Buying?
We have off-market investment properties averaging 8%+ annual yield.
View Property DealsBuy-to-Let Considerations
Are House Prices High? Price-to-Earnings Ratios
Purchasing a property in Bromley requires between 7.4 and 15.2 times the median annual salary. This is based on the Nomis Labour Market Profile for Bromley showing the median gross annual income for Bromley residents is £51,225. For context, the national benchmark (England average sold price of £290,437 divided by the Great Britain median salary of £39,125) sits at 7.4 times earnings.
| Rank | Area | Price-to-Earnings Ratio |
|---|---|---|
| 1 | SE20 (Penge, Anerley) | 7.4x |
| 2 | DA14 (Sidcup, Foots Cray) | 8.0x |
| 3 | BR8 (Swanley) | 8.7x |
| 4 | SE19 (Crystal Palace) | 9.0x |
| 5 | SE26 (Sydenham) | 9.3x |
| 6 | SE9 (Eltham, Mottingham) | 9.4x |
| 7 | BR5 (St Mary Cray, Petts Wood) | 9.6x |
| 8 | BR1 (Bromley Town Centre, Bickley) | 9.7x |
| 9 | BR3 (Beckenham) | 10.5x |
| 10 | TN16 (Biggin Hill) | 11.0x |
| 11 | BR2 (Bromley Common, Hayes) | 11.4x |
| 12 | BR6 (Orpington, Chelsfield) | 12.0x |
| 13 | TN14 (Cudham, Knockholt) | 12.8x |
| 14 | BR4 (West Wickham) | 14.1x |
| 15 | BR7 (Chislehurst) | 15.2x |
SE20 (Penge, Anerley) at 7.4 times earnings matches the national benchmark exactly. That is unusual for a London postcode. DA14 and BR8, at 8.0x and 8.7x respectively, are the next most affordable by this measure. All three are in the sub-£500,000 asking price tier and they are also the three postcodes with the lowest 30% deposits.
BR7 (Chislehurst) at 15.2 times earnings and BR4 (West Wickham) at 14.1x sit at the top of the table. At these ratios, the purchase price requires over 14 years of gross earnings. The gap between the top and bottom of this table, 7.8 times earnings, is one of the widest ranges in any London borough and reflects the diversity of Bromley's housing stock. For more on the costs involved in buy-to-let, see our guide to buy-to-let costs.
Deposit Requirements in Bromley
A 30% deposit is the standard assumption for buy-to-let mortgage calculations. Deposits in Bromley range from £113,469 in SE20 (Penge, Anerley) to £232,894 in BR7 (Chislehurst), a difference of £119,425. Use our stamp duty calculator to work out the full upfront costs including stamp duty land tax.
| Rank | Area | 30% Deposit Required |
|---|---|---|
| 1 | SE20 (Penge, Anerley) | £113,469 |
| 2 | DA14 (Sidcup, Foots Cray) | £122,280 |
| 3 | BR8 (Swanley) | £133,689 |
| 4 | SE19 (Crystal Palace) | £138,806 |
| 5 | SE26 (Sydenham) | £142,384 |
| 6 | SE9 (Eltham, Mottingham) | £143,860 |
| 7 | BR5 (St Mary Cray, Petts Wood) | £147,643 |
| 8 | BR1 (Bromley Town Centre, Bickley) | £149,213 |
| 9 | BR3 (Beckenham) | £161,585 |
| 10 | TN16 (Biggin Hill) | £168,427 |
| 11 | BR2 (Bromley Common, Hayes) | £174,679 |
| 12 | BR6 (Orpington, Chelsfield) | £184,036 |
| 13 | TN14 (Cudham, Knockholt) | £196,275 |
| 14 | BR4 (West Wickham) | £217,056 |
| 15 | BR7 (Chislehurst) | £232,894 |
The eight postcodes below £150,000 deposit (SE20, DA14, BR8, SE19, SE26, SE9, BR5 and BR1) are all in the northern and western parts of the borough. These are the same postcodes that produce yields of 4.3% or above. An investor entering at SE20's £113,469 deposit faces a 30% deposit that is less than half of the £232,894 required for BR7. For a broader view of entry costs and how to find properties below market value, see below market value properties. For strategies on reducing deposit requirements, see our guide on investing in property with no or little money.

What the Bromley Data Tells Buy-to-Let Investors
Bromley's yield and affordability data concentrate in the same band of postcodes. SE20 (5.2% yield, £113,469 deposit, 7.4x earnings), DA14 (5.0%, £122,280, 8.0x) and SE9 (4.7%, £143,860, 9.4x) top the yield table, require the lowest deposits, and sit at the most affordable end of the price-to-earnings range. BR5 (4.5%, £147,643, 9.6x) and SE19 (4.5%, £138,806, 9.0x) round out the group.
All five postcodes sit in the northern half of the borough, closer to the Lewisham, Croydon and Greenwich borders. Monthly rents in this band run from £1,635 to £1,889, and turnover rates of 9% to 16% indicate active resale markets. Investors looking for investment property in London at sub-£500,000 asking prices will find eight options in this tier.
The growth data points in a different direction. TN14 (21.4% five-year growth), BR8 (19.2%) and BR7 (16.5%) have delivered the strongest capital appreciation, but their yields are 3.3%, 4.2% and 2.9% respectively. These are the southern and eastern fringe postcodes where larger properties, lower density and green belt proximity drive prices rather than rental income. The five-year growth leaders and the yield leaders barely overlap. BR5, with 12.6% five-year growth and a 4.5% yield, is the closest to appearing in both lists.
DA14 (Sidcup, Foots Cray) presents the most mixed data profile in the borough. It has the second-highest yield at 5.0% and the second-lowest deposit at £122,280. But it also has -9.4% one-year growth, -2.0% three-year growth and -1.7% five-year growth. It is the only Bromley postcode with negative readings across all three growth windows. DA14 is shared with Bexley.
Two postcodes, BR4 (West Wickham) and TN16 (Biggin Hill), have no rental data. Both are in the upper half of the price table and cannot be assessed for yield.
Bromley has no selective licensing scheme in operation. Investors exploring off-market properties or repossessed houses for sale in the borough will find that the sub-£500,000 postcodes produce both the highest yields and the most affordable entry points, while the premium postcodes to the south deliver capital growth from a higher base.
How Bromley Compares
Bromley's mean asking price of £539,178 is £110,387 higher than the cheapest neighbouring borough (Bexley at £428,791), but Bromley produces the lowest top yield of all five boroughs.
| Location | Mean Asking Price | Mean Monthly Rent | Top Gross Yield |
|---|---|---|---|
| Bexley | £428,791 | £1,754 | 5.9% |
| Croydon | £464,760 | £1,717 | 5.4% |
| Greenwich | £464,891 | £1,956 | 5.9% |
| Lewisham | £490,253 | £1,905 | 5.8% |
| Bromley | £539,178 | £1,796 | 5.2% |
Bromley has the highest mean asking price of the five boroughs at £539,178, which is £110,387 above Bexley at £428,791. That price premium does not translate into higher yields. All four neighbouring boroughs produce top yields between 5.4% and 5.9%, compared with Bromley's 5.2%. Greenwich and Bexley share the highest top yield at 5.9%.
Lewisham and Greenwich both command higher mean monthly rents (£1,905 and £1,956) than Bromley's £1,796. Croydon has the lowest mean rent at £1,717 but also a lower mean asking price, which pushes its yield above Bromley's. Investors comparing south-east London boroughs will find that Bromley's sub-£500,000 postcodes (SE20, DA14, BR8) are priced in line with the mean asking prices of the neighbouring boroughs, while its premium postcodes push the borough-wide average well above. For a broader comparison of London investment opportunities, see best buy-to-let locations.
Frequently Asked Questions
Is Bromley expensive to buy property in?
The average sold price of £528,759 puts Bromley 82% above the England average of £290,437. Asking prices range from £378,231 in SE20 (Penge, Anerley) to £776,315 in BR7 (Chislehurst). Price-to-earnings ratios run from 7.4x in SE20 to 15.2x in BR7, based on the local median annual salary of £51,225. SE20's 7.4x ratio matches the national benchmark (England average price divided by the Great Britain median salary). Eight postcodes have asking prices below £500,000, while six sit above £550,000.
What is the average house price in Bromley in 2026?
£528,759, according to the HM Land Registry House Price Index for January 2026. That figure is up 5.0% year-on-year from £503,544 in January 2025. The all-time high was £537,156 in December 2025. By property type, detached houses average £1,091,743, semi-detached £672,408, terraced £499,447 and flats £315,358. Mean asking prices across the borough's 15 postcodes range from £378,231 to £776,315.
What is the average rent in Bromley?
Monthly rents range from £1,548 in BR8 (Swanley) to £2,182 in BR6 (Orpington, Chelsfield), based on 13 postcodes with sufficient rental data. Two postcodes, BR4 (West Wickham) and TN16 (Biggin Hill), have insufficient data to report. Rent as a percentage of the local median gross monthly income ranges from 36.3% in BR8 to 51.1% in BR6. The median gross annual salary for Bromley residents is £51,225 (ASHE 2025).
Is Bromley a nice place to live?
Bromley is London's largest borough by area at 57.97 square miles, with median earnings of £985.10 per week, above the London regional median of £892.60. The borough has extensive green space including Crystal Palace Park, which is undergoing a £26.8 million regeneration. Transport relies on 26 railway stations (mainly Southeastern services), Tramlink in the west and London Overground in the north-west. Bromley South station offers express services to London Victoria in 16 minutes. There are no London Underground stations. The 2021 Census recorded a population of 329,992. The borough spans from urban areas like Penge and Beckenham in the north to semi-rural areas around Biggin Hill and Cudham in the south.
How does Bromley compare with neighbouring boroughs for buy-to-let?
Bromley has the highest mean asking price (£539,178) but the lowest top yield (5.2%) of its five-borough cluster. The four neighbours are Bexley (£428,791), Croydon (£464,760), Greenwich (£464,891) and Lewisham (£490,253). All four neighbours produce higher top gross yields: Bexley and Greenwich at 5.9%, Lewisham at 5.8% and Croydon at 5.4%, compared with Bromley's 5.2% in SE20. Greenwich and Lewisham command higher mean monthly rents (£1,956 and £1,905) than Bromley's £1,796. Bromley's sub-£500,000 postcodes (SE20 at £378,231, DA14 at £407,600, BR8 at £445,631) are priced in line with the mean asking prices of the neighbouring boroughs.
Which Bromley postcodes have the strongest house price growth?
TN14 (Cudham, Knockholt) leads five-year growth at 21.4%. BR8 (Swanley) follows at 19.2% and BR7 (Chislehurst) at 16.5%. These are the southern and eastern fringe postcodes near the Kent border. For one-year growth, BR5 (St Mary Cray, Petts Wood) leads at 9.9%, followed by SE26 (Sydenham) at 9.5% and BR7 at 7.1%. DA14 (Sidcup, Foots Cray) is the only postcode with negative growth across all three time windows: -9.4% one-year, -2.0% three-year and -1.7% five-year.
What flats and houses are available to buy in Bromley?
Bromley's property mix ranges from Victorian terraced conversions and purpose-built flats in the north-west (SE20, SE19, SE26) to detached family houses in the south and east (BR7, TN14, BR8). The January 2026 Land Registry data shows detached houses averaging £1,091,743, semi-detached £672,408, terraced £499,447 and flats and maisonettes £315,358.
Flats account for the majority of rental stock in the northern postcodes, where the borough's highest yields are concentrated. Investors looking at renovation properties will find older housing stock in Penge, Beckenham and Crystal Palace, while newer builds are concentrated around Bromley town centre developments.