Where to Buy Property Investments in Isle of Wight: Yields of 4.9%
Isle of Wight gross rental yields reach 4.9% in PO30 (Newport), with average sold prices sitting 15.1% below the England average. The island's population grew 1.59% to 140,459 between the 2011 and 2021 censuses.
The Isle of Wight's average sold price of £247,936 sits 34.5% below the South East regional average of £378,800. That gap reflects the island's separation from the mainland rather than a lack of demand. Rental data is available for 6 of the island's 12 postcodes, with the remaining 6 being lower-volume areas where PropertyData cannot generate reliable rental estimates. Asking prices range from £242,951 in PO32 (East Cowes) to £482,867 in PO41 (Yarmouth).
The Isle of Wight is a unitary authority in the South East of England, located in the Solent and separated from the Hampshire coastline by a short ferry crossing. This guide covers all 12 postcodes from PO30 to PO41 (ONS code E06000046). Investors comparing options along the south coast may also consider Portsmouth, Southampton, or Chichester. Browse all our South East location guides.
Article updated: March 2026
Isle of Wight Buy-to-Let Market Overview 2026
The Isle of Wight offers a two-tier buy-to-let market: affordable town-centre postcodes with rental data and higher-value coastal postcodes where investor activity is lower.
- Average sold price: £247,936 (15.1% below England's £291,865)
- Asking price range: £242,951 (PO32, East Cowes) to £482,867 (PO41, Yarmouth)
- Rental yields: 3.4% (PO37) to 4.9% (PO30) across 6 postcodes with rental data
- Rental income: Monthly rents from £839 (PO37, Shanklin) to £1,117 (PO30, Newport)
- Price per sq ft: Sold prices from £262/sq ft (PO30) to £398/sq ft (PO35)
- Market activity: Sales ranging from 2 per month (PO41) to 33 per month (PO33)
- Deposit requirements: 30% deposits range from £72,885 (PO32) to £144,860 (PO41)
- Affordability ratios: Property prices from 7.8 to 15.5 times the Isle of Wight's median annual salary of £31,184
Contents

-
by Robert Jones, Founder of Property Investments UK
With two decades in UK property, Rob has been investing in buy-to-let since 2005, and uses property data to develop tools for property market analysis.

Property Data Sources
Our location guide relies on diverse, authoritative datasets including:
- HM Land Registry UK House Price Index
- Ministry of Housing, Communities and Local Government
- Ordnance Survey Data Hub
- Propertydata.co.uk
We update our property data quarterly to ensure accuracy. Last update: March 2026. All data is presented as provided by our sources without adjustments or amendments.
Why Invest on the Isle of Wight?
The Isle of Wight is the only island location in our UK property investment guide series. Its housing market operates independently from mainland South East England. A population of 140,459 lives across 12 postcode districts covering everything from the commercial centre of Newport (PO30) to premium coastal villages like Seaview (PO34) and Bembridge (PO35).
The island's economy centres on health and social work (20.8% of jobs), wholesale and retail (15.1%), and accommodation and food services (13.2%). That third sector is significant for buy-to-let investors. Tourism and hospitality employment drives demand for both long-term and seasonal rental accommodation. The employment rate of 74.3% sits below the South East average of 78.7%, while the unemployment rate of 3.6% is lower than the Great Britain figure of 4.3%.
Local earnings are considerably lower than both regional and national figures. The median annual salary for Isle of Wight residents is £31,184, compared to £41,616 for the South East and £39,125 for Great Britain. This earnings gap has a direct bearing on affordability ratios and rent-to-income calculations throughout this guide.
Isle of Wight Economic Summary
- Population: 140,459 (2021 Census). Growth of 1.59% from 2011.
- Median annual salary: £31,184 (local), £41,616 (South East), £39,125 (Great Britain)
- Employment rate: 74.3% (local), 78.7% (South East), 75.6% (Great Britain)
- Unemployment rate: 3.6% (local), 3.5% (South East), 4.3% (Great Britain)
- Key employment sectors: Health and social work, wholesale and retail, accommodation and food services, education
Source: ONS Census 2021, Nomis Labour Market Profile (ASHE 2025, Employment Oct 2023-Sep 2024)
Regeneration and Investment on the Isle of Wight
Over £35 million in confirmed public funding is directed at the Isle of Wight's towns. Most of the investment concentrates on Ryde and Newport, the two largest population centres.
- Ryde Long-Term Plan for Towns (Active, £20 million): Ryde is one of 55 towns receiving £20 million over ten years through the government's Long-Term Plan for Towns programme, with substantive funding expected from 2026 into the mid-2030s. The Town Board oversees investment across high street regeneration, safety, and transport connectivity in PO33. Updates at OnTheWight.
- Island Green Link (Funded, £13.6 million): Levelling Up Fund Round 3 is delivering cross-island sustainable transport infrastructure including a bus corridor between Ryde and Yarmouth, the 13-mile West Wight Greenway between Freshwater and Newport, and cycling improvements through Newport town centre. Updates at OnTheWight.
- Newport and Ryde Heritage Action Zones (Delivered, £2.36 million): Historic England's High Streets Heritage Action Zone programme funded shopfront restoration, heritage training, and repurposing of empty buildings in both town centres, with £1.4 million for Newport (PO30) and £960,000 for Ryde (PO33). Updates at OnTheWight.

Isle of Wight Property Market Analysis
When was the last house price crash on the Isle of Wight?
The Isle of Wight sits within its own unitary authority so all sold property prices from HM Land Registry are available at the Isle of Wight local authority level. The data below covers January 1995 to December 2025.
Isle of Wight house prices peaked at £181,967 in November 2007 before falling 19.1% to a trough of £147,185 by March 2009. That decline was steeper than England's 18.2% drop over a similar period but broadly in line with the South East's 19.9% fall. The island's worst annual change reading was -14.9% in March 2009.
- 1995-2007 (The Boom): Prices started at £43,282 in December 1995 and rose steadily through the early 2000s. The island benefited from the same credit-fuelled growth as mainland markets, with prices reaching £181,967 by November 2007.
- 2008-2009 (The Financial Crisis): The peak of £181,967 (November 2007) gave way to a trough of £147,185 (March 2009). A 19.1% decline over 16 months. The worst annual change reading hit -14.9% in March 2009, compared to England's worst of -15.5% in the same month.
- 2010-2013 (Stagnation): Prices drifted between £147,000 and £165,000. By December 2010 the average stood at £163,057. The island's recovery lagged behind faster-moving mainland markets.
- 2014-2016 (Turning Point): A gradual recovery brought prices back to pre-crash levels. The average first matched and exceeded the November 2007 peak in July 2016 at £182,347, a recovery period of roughly 7 years and 4 months from the trough.
- 2017-2019 (Pre-pandemic growth): Steady appreciation continued, with prices reaching £195,000-£215,000. The island attracted increasing retirement and lifestyle demand.
From pandemic boom to correction:
- 2020-2022 (Pandemic surge): Remote working and the search for lifestyle locations drove a pronounced surge. Prices rose from £226,347 in December 2020 to a pandemic peak of £273,014 in December 2022. A 20.6% increase in two years.
- 2023-2024 (Rate shock and correction): Higher mortgage rates cooled demand. Prices have fallen 9.2% from the December 2022 pandemic peak, a larger correction than many mainland locations.
- 2025 (Current): The average price in December 2025 stands at £247,936 with an annual change of -1.8%. The market is still adjusting from the pandemic-era highs.
Long-term growth summary:
- 5 years (2020-2025): 9.5% growth (£226,347 to £247,936)
- 10 years (2015-2025): 38.2% growth (£179,414 to £247,936)
- 15 years (2010-2025): 52.1% growth (£163,057 to £247,936)
- 20 years (2005-2025): 57.4% growth (£157,530 to £247,936)
- 30 years (1995-2025): 472.8% growth (£43,282 to £247,936)
The pandemic surge and subsequent correction are the defining feature of the Isle of Wight's recent price history. Island markets attracted disproportionate demand during 2020-2022 as buyers sought lifestyle relocations. That demand has normalised, and the current correction reflects a return to pre-pandemic growth trajectories rather than a structural decline.
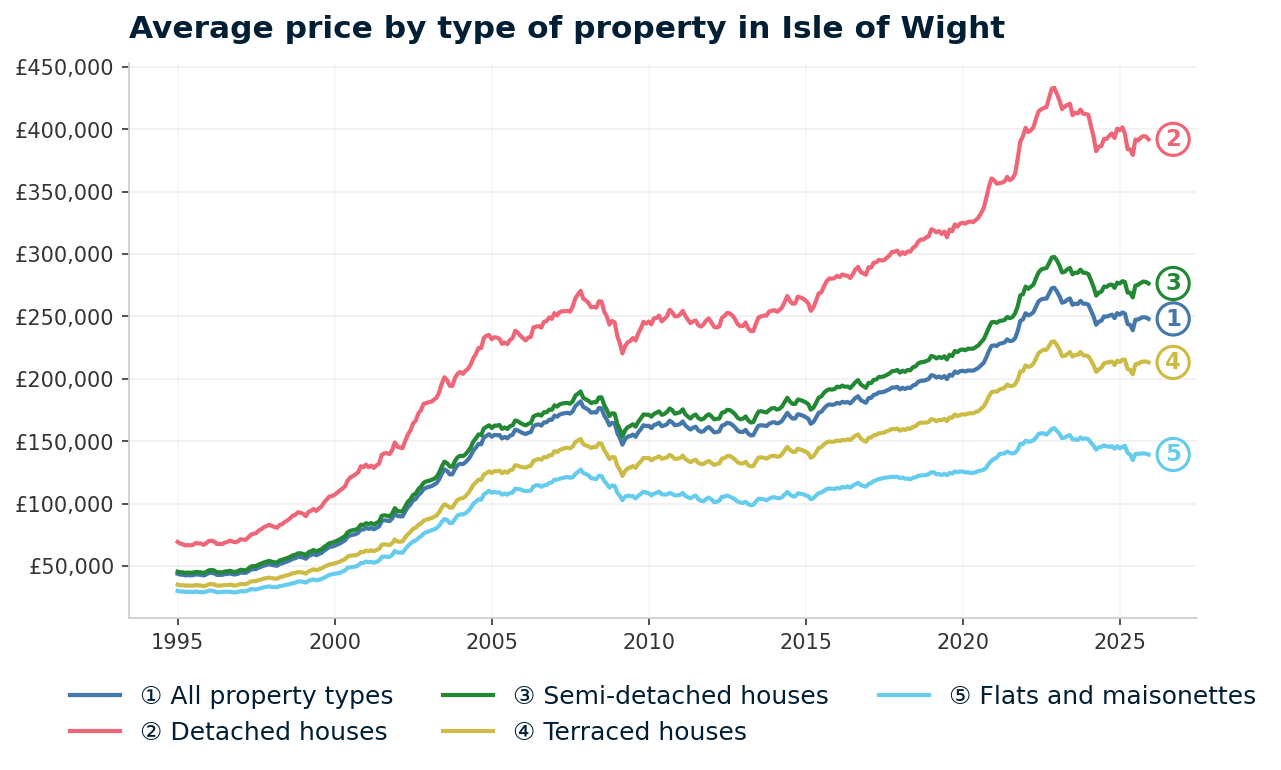
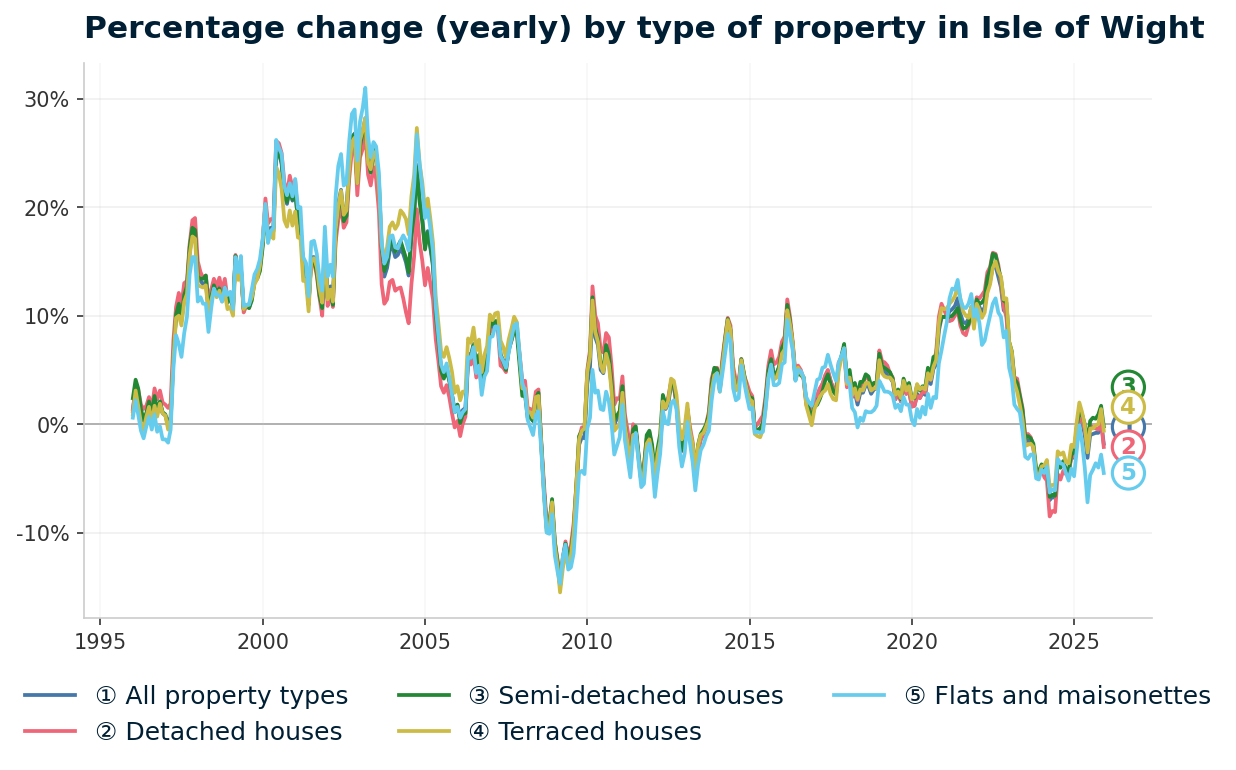
Source: HM Land Registry House Price Index for Isle of Wight, January 1995 to December 2025.
Thinking of Buying?
We have off-market investment properties averaging 8%+ annual yield.
View Property DealsSold House Prices on the Isle of Wight
The average sold property price on the Isle of Wight is £247,936, which is £43,929 (15.1%) below the England average of £291,865. The discount varies significantly by property type. Flats and maisonettes show the steepest discount at 36.5% below England, while semi-detached houses sit just 4.4% below.
| Property Type | Isle of Wight Average | England Average | Difference |
|---|---|---|---|
| Detached houses | £391,834 | £471,667 | -16.9% |
| Semi-detached houses | £276,336 | £289,135 | -4.4% |
| Terraced houses | £213,095 | £244,830 | -13.0% |
| Flats and maisonettes | £139,328 | £219,340 | -36.5% |
| All property types | £247,936 | £291,865 | -15.1% |
Semi-detached houses at £276,336 are only 4.4% below the England average. This is the narrowest gap of any property type. The island's semi-detached stock is predominantly in established residential streets across Newport, Ryde, and Cowes where prices track closer to mainland equivalents.
Flats and maisonettes at £139,328 carry the largest discount at 36.5% below England. The island's flat stock is concentrated in Sandown, Shanklin, and Ventnor along the eastern coast. Many of these are purpose-converted Victorian properties or retirement developments, which sell at materially lower prices than mainland equivalents.
Detached houses at £391,834 sit 16.9% below England's £471,667. This represents the island's premium market. Detached properties in Bembridge (PO35) and Seaview (PO34) can trade well above this average, while those in Newport and Sandown pull the figure down.
Terraced houses at £213,095 offer a 13.0% discount to England. Victorian terraces in Ryde and Newport's town centres make up much of this stock and represent a typical entry point for buy-to-let investors targeting the local rental market.
Property Data Sources
Our location guide relies on diverse, authoritative datasets including:
- HM Land Registry UK House Price Index
- Ministry of Housing, Communities and Local Government
- Ordnance Survey Data Hub
- Propertydata.co.uk
We update our property data quarterly to ensure accuracy. Last update: March 2026. All data is presented as provided by our sources without adjustments or amendments.
Price Per Square Foot on the Isle of Wight
Price per square foot strips out the effect of property size and reveals where buyers pay more for each square foot of living space. Isle of Wight prices range from £262/sq ft in PO30 (Newport) to £398/sq ft in PO35 (Bembridge), a gap of £136 per square foot between the cheapest and most expensive postcodes.
The table below ranks all 12 Isle of Wight postcodes by transaction-based sold price per square foot.
| Rank | Area | Price per sq ft |
|---|---|---|
| 1 | PO30 (Newport) | £262 |
| 2 | PO37 (Shanklin) | £267 |
| 3 | PO33 (Ryde) | £274 |
| 4 | PO36 (Sandown) | £278 |
| 5 | PO32 (East Cowes) | £282 |
| 6 | PO38 (Ventnor) | £292 |
| 7 | PO40 (Freshwater) | £309 |
| 8 | PO31 (Cowes) | £316 |
| 9 | PO39 (Totland Bay) | £328 |
| 10 | PO41 (Yarmouth) | £375 |
| 11 | PO34 (Seaview) | £387 |
| 12 | PO35 (Bembridge) | £398 |
The island splits cleanly into two tiers. Town-centre postcodes (PO30 Newport, PO33 Ryde, PO36 Sandown, PO37 Shanklin) cluster between £262 and £278 per square foot. Coastal and village postcodes (PO35 Bembridge, PO34 Seaview, PO41 Yarmouth, PO39 Totland Bay) sit between £328 and £398 per square foot.
That price-per-square-foot gap is driven by housing stock. The town postcodes contain more terraces, flats, and ex-council stock. The coastal postcodes are dominated by detached houses, many with sea views or proximity to sailing and walking amenities, which commands a premium per square foot regardless of overall property size.
For Sale Asking Prices on the Isle of Wight
How much does it actually cost to buy on the Isle of Wight right now? The mean asking price across all 12 postcodes is £338,391, but that figure hides a £239,916 gap between the cheapest and most expensive postcodes. PO32 (East Cowes) at £242,951 and PO41 (Yarmouth) at £482,867 are at opposite ends of the island's market. The mean sits above the Land Registry sold price average of £247,936 because premium coastal postcodes with large detached properties pull it upward.
| Rank | Area | Asking Price |
|---|---|---|
| 1 | PO32 (East Cowes) | £242,951 |
| 2 | PO33 (Ryde) | £271,900 |
| 3 | PO36 (Sandown) | £274,738 |
| 4 | PO30 (Newport) | £275,961 |
| 5 | PO37 (Shanklin) | £300,133 |
| 6 | PO39 (Totland Bay) | £334,514 |
| 7 | PO40 (Freshwater) | £334,892 |
| 8 | PO38 (Ventnor) | £343,612 |
| 9 | PO31 (Cowes) | £345,108 |
| 10 | PO35 (Bembridge) | £421,231 |
| 11 | PO34 (Seaview) | £432,783 |
| 12 | PO41 (Yarmouth) | £482,867 |
Four postcodes sit below £276,000: PO32 (East Cowes), PO33 (Ryde), PO36 (Sandown), and PO30 (Newport). These are the island's most accessible entry points for buy-to-let property investors. All four are town-centre postcodes with higher transaction volumes and, critically, all except PO32 have rental data available.
At the upper end, PO41 (Yarmouth) at £482,867 and PO34 (Seaview) at £432,783 reflect the premium coastal and village market. These postcodes have low transaction volumes (2 and 4 sales per month respectively) and no rental yield data from PropertyData, making them harder to underwrite from a buy-to-let perspective.

House Price Growth on the Isle of Wight
Which Isle of Wight postcodes have held their value since the pandemic surge? PO40 (Freshwater) leads with 20.1% five-year growth, but the three-year column tells a different story: 9 of 11 ranked postcodes show negative returns over that period.
PO41 (Yarmouth) is excluded from growth rankings due to extremely low transaction volume (2 sales per month), which produces statistically unreliable growth figures. All other 11 postcodes are ranked below.
| Area | 1 Year | 3 Years | 5 Years |
|---|---|---|---|
| PO40 (Freshwater) | 6.0% | -9.3% | 20.1% |
| PO31 (Cowes) | -0.8% | 1.9% | 19.4% |
| PO35 (Bembridge) | 0.9% | 1.3% | 18.0% |
| PO34 (Seaview) | -6.3% | -6.7% | 16.3% |
| PO39 (Totland Bay) | 11.0% | -1.2% | 15.8% |
| PO32 (East Cowes) | 4.1% | -3.2% | 15.7% |
| PO36 (Sandown) | 2.3% | -6.5% | 14.4% |
| PO33 (Ryde) | 0.8% | -3.9% | 8.8% |
| PO30 (Newport) | -0.1% | -0.7% | 6.0% |
| PO37 (Shanklin) | -4.3% | -5.8% | 2.3% |
| PO38 (Ventnor) | -1.3% | -6.6% | 1.0% |
| PO41 (Yarmouth) | Not enough data (2 sales/month) | ||
The three-year column tells the most important story. Nine of 11 ranked postcodes show negative three-year growth, confirming the post-pandemic correction is broad-based. Only PO31 (Cowes, +1.9%) and PO35 (Bembridge, +1.3%) have held their value over three years.
Five-year growth remains positive across all ranked postcodes because it captures the full pandemic surge. PO40 (Freshwater) at 20.1% and PO31 (Cowes) at 19.4% lead the island. At the bottom, PO38 (Ventnor) at 1.0% and PO37 (Shanklin) at 2.3% show the weakest five-year appreciation. Both are eastern coastal resort towns where the pandemic premium has almost entirely unwound.
Monthly Property Sales on the Isle of Wight
An island market with 12 postcodes and just 155 total sales per month. PO33 (Ryde) and PO30 (Newport) account for 63 of those between them, while the six smallest postcodes manage a combined 32. Ryde's 33 sales per month and 15% turnover rate reflect its position as the island's largest town, with a train link to the Portsmouth ferry terminal that gives it the closest mainland connection.
| Area | Sales per Month | Turnover | Asking Price |
|---|---|---|---|
| PO33 (Ryde) | 33 | 15% | £271,900 |
| PO30 (Newport) | 30 | 9% | £275,961 |
| PO31 (Cowes) | 22 | 10% | £345,108 |
| PO38 (Ventnor) | 14 | 13% | £343,612 |
| PO36 (Sandown) | 13 | 6% | £274,738 |
| PO37 (Shanklin) | 11 | 8% | £300,133 |
| PO32 (East Cowes) | 10 | 7% | £242,951 |
| PO40 (Freshwater) | 8 | 21% | £334,892 |
| PO35 (Bembridge) | 5 | 36% | £421,231 |
| PO34 (Seaview) | 4 | 6% | £432,783 |
| PO39 (Totland Bay) | 3 | 6% | £334,514 |
| PO41 (Yarmouth) | 2 | 4% | £482,867 |
PO40 (Freshwater) stands out with a 21% turnover rate despite only 8 sales per month. This suggests a smaller total housing stock relative to its transaction activity. PO35 (Bembridge) shows the highest turnover at 36%, but on just 5 sales per month, which reflects a very small total stock count.
The four postcodes with the highest sales volumes (PO33, PO30, PO31, PO38) account for 99 of the island's 155 monthly sales. These are the postcodes where buy-to-let investors will find the most liquid resale market. At the other end, PO41 (Yarmouth) at 2 sales per month is the least liquid postcode on the island.
Property Data Sources
Our location guide relies on diverse, authoritative datasets including:
- HM Land Registry UK House Price Index
- Ministry of Housing, Communities and Local Government
- Ordnance Survey Data Hub
- Propertydata.co.uk
We update our property data quarterly to ensure accuracy. Last update: March 2026. All data is presented as provided by our sources without adjustments or amendments.
Isle of Wight Rental Market Analysis
For investors weighing up whether rental property is a worthwhile investment on the Isle of Wight, the data below breaks down average monthly rents and gross rental yields across the island's postcodes.
Rental data is available for 6 of the island's 12 postcodes. The remaining 6 (PO32, PO34, PO35, PO39, PO40, PO41) lack sufficient rental transaction volume for PropertyData to generate reliable estimates. If you are looking to build a property portfolio in the South East, the Isle of Wight's combination of below-average prices and island-specific rental demand from tourism and lifestyle tenants creates a distinct market profile.
Average Rent & Gross Rental Yields on the Isle of Wight
Only 6 of the island's 12 postcodes generate enough rental transactions for PropertyData to produce yield estimates. Of those six, PO30 (Newport) leads at 4.9%, driven by a monthly rent of £1,117 against an asking price of £275,961. Newport's yield stands more than a full percentage point above the next postcode because it combines the island's highest rent with one of its lower asking prices.
| Area | Average Monthly Rent | Asking Price | Gross Yield |
|---|---|---|---|
| PO30 (Newport) | £1,117 | £275,961 | 4.9% |
| PO33 (Ryde) | £852 | £271,900 | 3.8% |
| PO31 (Cowes) | £1,074 | £345,108 | 3.7% |
| PO36 (Sandown) | £844 | £274,738 | 3.7% |
| PO38 (Ventnor) | £1,000 | £343,612 | 3.5% |
| PO37 (Shanklin) | £839 | £300,133 | 3.4% |
| PO32 (East Cowes) | Not enough data | ||
| PO34 (Seaview) | Not enough data | ||
| PO35 (Bembridge) | Not enough data | ||
| PO39 (Totland Bay) | Not enough data | ||
| PO40 (Freshwater) | Not enough data | ||
| PO41 (Yarmouth) | Not enough data | ||
The yield spread across the six postcodes with data is narrow: 1.5 percentage points from top to bottom. PO30 (Newport) at 4.9% is the clear leader, sitting more than a full percentage point above the next postcode. Newport's yield is driven by higher rents (£1,117/month) rather than lower prices. Its asking price of £275,961 is the fourth lowest on the island, but its rent is the highest.
PO31 (Cowes) and PO38 (Ventnor) both achieve rents above £1,000 per month but their higher asking prices (£345,108 and £343,612) compress their yields to 3.7% and 3.5% respectively. The eastern resort postcodes of PO36 (Sandown) and PO37 (Shanklin) have the lowest monthly rents (£844 and £839) and yields between 3.4% and 3.7%.
Is Isle of Wight Rent High?
Rent as a percentage of local income measures how much of a tenant's gross monthly earnings goes toward housing. Isle of Wight rents consume between 32.3% and 43.0% of the local median gross monthly salary, depending on postcode.
The median gross weekly salary on the Isle of Wight is £599.70, which equates to £2,599 per month or £31,184 per year. This is below the South East regional median of £800.30 per week and the Great Britain median of £752.40 per week. Data from the Nomis Labour Market Profile (ASHE 2025).
| Rank | Area | Rent as % of Income |
|---|---|---|
| 1 | PO30 (Newport) | 43.0% |
| 2 | PO31 (Cowes) | 41.3% |
| 3 | PO38 (Ventnor) | 38.5% |
| 4 | PO33 (Ryde) | 32.8% |
| 5 | PO36 (Sandown) | 32.5% |
| 6 | PO37 (Shanklin) | 32.3% |
| — | PO32 (East Cowes) | Not enough data |
| — | PO34 (Seaview) | Not enough data |
| — | PO35 (Bembridge) | Not enough data |
| — | PO39 (Totland Bay) | Not enough data |
| — | PO40 (Freshwater) | Not enough data |
| — | PO41 (Yarmouth) | Not enough data |
PO30 (Newport) at 43.0% has the highest rent-to-income ratio on the island. This is the same postcode that delivers the top yield of 4.9%. The two metrics are linked: higher rents as a share of income translate directly into higher gross yields for landlords. The island's low median salary of £31,184 pushes rent-to-income ratios higher than they would be in a mainland location with the same rent levels.
PO36 (Sandown) at 32.5% and PO37 (Shanklin) at 32.3% have the lowest ratios among postcodes with rental data. Their rents of £844 and £839 per month are the most affordable on the island in absolute terms, though even at this level the ratio remains elevated by the island's below-average earnings.
Thinking of Buying?
We have off-market investment properties averaging 8%+ annual yield.
View Property DealsBuy-to-Let Considerations
Are House Prices High on the Isle of Wight? Price-to-Earnings Ratios
Purchasing a property on the Isle of Wight requires between 7.8 and 15.5 times the median annual salary. This is based on the Nomis Labour Market Profile for Isle of Wight showing the median gross annual income for Isle of Wight residents is £31,184.
The mean price-to-earnings ratio across all 12 postcodes is 10.9x. For context, the England average sold price of £291,865 against the Great Britain median salary of £39,125 gives a national benchmark of approximately 7.5x.
| Rank | Area | Price-to-Earnings Ratio |
|---|---|---|
| 1 | PO32 (East Cowes) | 7.8x |
| 2 | PO33 (Ryde) | 8.7x |
| 3 | PO30 (Newport) | 8.8x |
| 4 | PO36 (Sandown) | 8.8x |
| 5 | PO37 (Shanklin) | 9.6x |
| 6 | PO39 (Totland Bay) | 10.7x |
| 7 | PO40 (Freshwater) | 10.7x |
| 8 | PO38 (Ventnor) | 11.0x |
| 9 | PO31 (Cowes) | 11.1x |
| 10 | PO35 (Bembridge) | 13.5x |
| 11 | PO34 (Seaview) | 13.9x |
| 12 | PO41 (Yarmouth) | 15.5x |
PO32 (East Cowes) at 7.8x is the only postcode close to the national benchmark of 7.5x. Five postcodes (PO32, PO33, PO30, PO36, PO37) sit below 10x. The remaining seven exceed 10x, with the three premium coastal postcodes (PO35, PO34, PO41) all above 13x.
These ratios are inflated by the island's low median salary of £31,184 rather than by exceptionally high property prices. If the Isle of Wight's earnings matched the South East median of £41,616, the mean ratio would drop from 10.9x to approximately 8.1x. The price-to-earnings data here reflects local affordability, not a comparison to mainland property markets with different earnings profiles.
Deposit Requirements on the Isle of Wight
Buy-to-let mortgages typically require a minimum 30% deposit. On the Isle of Wight, that means deposits ranging from £72,885 in PO32 (East Cowes) to £144,860 in PO41 (Yarmouth). The table below shows the 30% deposit requirement for all 12 postcodes, ranked from lowest to highest.
| Rank | Area | 30% Deposit Required |
|---|---|---|
| 1 | PO32 (East Cowes) | £72,885 |
| 2 | PO33 (Ryde) | £81,570 |
| 3 | PO36 (Sandown) | £82,421 |
| 4 | PO30 (Newport) | £82,788 |
| 5 | PO37 (Shanklin) | £90,040 |
| 6 | PO39 (Totland Bay) | £100,354 |
| 7 | PO40 (Freshwater) | £100,468 |
| 8 | PO38 (Ventnor) | £103,084 |
| 9 | PO31 (Cowes) | £103,532 |
| 10 | PO35 (Bembridge) | £126,369 |
| 11 | PO34 (Seaview) | £129,835 |
| 12 | PO41 (Yarmouth) | £144,860 |
Four postcodes require 30% deposits under £83,000: PO32 (East Cowes), PO33 (Ryde), PO36 (Sandown), and PO30 (Newport). The £9,903 difference between PO32 at £72,885 and PO30 at £82,788 is relatively small, but PO30 delivers a 4.9% yield while PO32 has no rental data. Of the four cheapest-entry postcodes, three (PO30, PO33, PO36) have rental data and yields between 3.7% and 4.9%.
In addition to the deposit, investors need to budget for buy-to-let running costs and stamp duty land tax. Investors purchasing below market value properties may reduce both their deposit and stamp duty liability.
What the Isle of Wight Data Tells Buy-to-Let Investors
PO30 (Newport) delivers the island's highest gross yield at 4.9% with an asking price of £275,961 and a 30% deposit of £82,788. As the island's administrative centre with 30 sales per month, Newport has the deepest rental market. The tenant base draws from health, retail, and education sector workers. Rents of £1,117 per month reflect Newport's role as the main employment hub.
PO33 (Ryde) at 3.8% yield combines accessible pricing (£271,900) with the island's highest transaction volume at 33 sales per month. Ryde's train link to the Portsmouth ferry gives it the closest mainland connection, supporting year-round tenant demand. The £20 million Long-Term Plan for Towns investment is focused on Ryde's town centre and transport connectivity.
Six of the island's 12 postcodes have no rental data from PropertyData: PO32, PO34, PO35, PO39, PO40, and PO41. These postcodes either have very low transaction volumes (PO41 at 2 sales/month, PO39 at 3 sales/month) or cater to owner-occupier and second-home markets where rental transactions are too few to generate reliable estimates. PO34 (Seaview) and PO35 (Bembridge) have asking prices above £420,000 and price-to-earnings ratios above 13x. Investors looking for investment property on the island will find the most complete data picture in the town-centre postcodes. Those sourcing off-market properties may find opportunities in the lower-volume postcodes where fewer listings reach the open market. The eastern resort towns also have older Victorian stock that features on renovation property listings.
The Isle of Wight does not currently appear on the selective licensing register. The island's local authority manages private rental standards through its own enforcement team.
How the Isle of Wight Compares
The Isle of Wight's mean asking price of £338,391 sits between Portsmouth (£284,807) and Bournemouth (£355,164) in the south coast hierarchy. The table below compares the island against four nearby locations using mean asking price, mean monthly rent, and top gross yield.
| Location | Mean Asking Price | Mean Monthly Rent | Top Gross Yield |
|---|---|---|---|
| Southampton | £260,724 | £1,362 | 9.0% |
| Portsmouth | £284,807 | £1,351 | 7.0% |
| Isle Of Wight | £338,391 | £954 | 4.9% |
| Bournemouth | £355,164 | £1,408 | 7.7% |
| Chichester | £509,470 | £1,598 | 4.5% |
At £954 per month, the island's mean rent is the lowest in this comparison by a significant margin. Portsmouth at £1,351 and Southampton at £1,362 both achieve substantially higher rents despite lower mean asking prices. That rent gap reflects lower local earnings (£31,184 vs £35,000-£38,000 for the mainland cities) and limited commuter connectivity to mainland employment centres.
The Isle of Wight's top yield of 4.9% sits between Chichester's 4.5% and the mainland port cities' 7.0-9.0%. The island is a different type of market: lower rents, a smaller tenant pool, seasonal tourism demand, and a housing stock split between buy-to-let-suitable town properties and premium coastal homes. Investors comparing the island to its mainland neighbours can find more detail in our guides to Portsmouth, Southampton, Bournemouth, and Chichester. For a broader view of top-performing areas, see our guide to the best buy-to-let locations in the UK.
Frequently Asked Questions
Where are the most active property markets on the Isle of Wight?
PO33 (Ryde) records 33 sales per month with a turnover rate of 15%, making it the island's most liquid postcode. PO30 (Newport) is close behind at 30 sales per month. Together these two postcodes account for over 40% of the island's total monthly transactions. At the other end, PO41 (Yarmouth) and PO39 (Totland Bay) average 2 and 3 sales per month respectively. Transaction volume matters for buy-to-let investors because it affects how quickly properties can be purchased and resold.
Is the Isle of Wight an expensive place to buy property?
The Isle of Wight's average sold price of £247,936 is 15.1% below the England average and 34.5% below the South East regional average. Asking prices in the four most affordable postcodes (PO32, PO33, PO36, PO30) range from £242,951 to £275,961. The premium coastal postcodes (PO34, PO35, PO41) with asking prices above £420,000 sit closer to South East mainland pricing, but the island-wide average reflects a substantial discount to the surrounding region.
How do Isle of Wight house prices compare to Portsmouth and Southampton?
The Isle of Wight's mean asking price of £338,391 is higher than both Portsmouth (£284,807) and Southampton (£260,724). The difference is driven by the island's premium postcodes pulling the mean upward. At the entry level, PO32 (East Cowes) at £242,951 and PO33 (Ryde) at £271,900 are comparable to or below the mainland cities' averages. Where the island falls behind is in rental income: a mean monthly rent of £954 compared to £1,351 in Portsmouth and £1,362 in Southampton. The mainland cities have larger tenant pools, higher local earnings, and direct rail links to London.
What is the cost of living on the Isle of Wight for tenants?
The median gross annual salary for Isle of Wight residents is £31,184, which is 20.3% below the Great Britain median of £39,125 and 25.1% below the South East median of £41,616. Monthly rents across the six postcodes with data range from £839 (PO37, Shanklin) to £1,117 (PO30, Newport), consuming between 32% and 43% of local gross monthly earnings. The island's housing costs are lower in absolute terms than mainland South East locations, but the lower salary base means tenants feel a comparable affordability pressure.
Are there holiday homes for sale on the Isle of Wight?
The Isle of Wight attracts over 2 million visitors annually, and accommodation and food services account for 13.2% of the island's jobs. This creates a tourism-driven rental market alongside the standard assured shorthold tenancy market. The rental data in this guide covers long-term tenancies only. Holiday let yields depend on occupancy rates, seasonal pricing, and running costs that differ significantly from standard buy-to-let metrics.
Coastal postcodes like PO36 (Sandown), PO37 (Shanklin), and PO38 (Ventnor) have established visitor economies, while PO30 (Newport) serves the year-round employment-based rental market. Search demand for "isle of wight property for sale with sea views" and "holiday let isle of wight" appears in the island's query data. Our guide to buying a holiday let covers the financial considerations in more detail.
Where is the best place to live on the Isle of Wight?
PO30 (Newport) is the island's administrative and commercial centre with the widest range of shops, services, and employment. PO33 (Ryde) has the island's only train link, connecting to the Portsmouth ferry terminal for mainland access, and records the highest transaction volume at 33 sales per month. PO31 (Cowes) attracts sailing and marina lifestyle residents with monthly rents of £1,074.
The eastern resort towns of PO36 (Sandown) and PO37 (Shanklin) have established visitor economies and asking prices between £274,738 and £300,133. For premium coastal living, PO34 (Seaview) and PO35 (Bembridge) have asking prices above £420,000 and price per square foot above £380. PO40 (Freshwater) on the west coast recorded the island's highest five-year price growth at 20.1%.