Where to Buy Property Investments in Enfield: Yields of 6.2%
Enfield's top postcode-level gross yield sits at 6.2% in EN3 (Enfield Lock, Ponders End), the highest reading of any adjacent London borough. Asking prices across the borough stretch from £369,044 in EN3 up to £804,042 in EN4 (Cockfosters), a 2.2-times spread between the cheapest and most expensive postcodes in the same borough. That gap is the single most important number in the Enfield investor dataset.
Enfield's mean asking price across 12 postcodes is £527,549, 81.6% above the England sold-price average of £290,437 but £164,269 below neighbouring Barnet. The population grew 5.61% between the 2011 and 2021 censuses, reaching 329,984, and the median resident earns £44,985 a year. The combination produces a price-to-earnings spread running from 8.2 times salary in EN3 up to 17.9 times in EN4, a wider range than most outer London boroughs deliver.
This guide covers the London Borough of Enfield (ONS code E09000010), using all 12 postcodes in the PropertyData borough attribution: EN1, EN2, EN3, EN4, EN8, N9, N11, N13, N14, N18, N21 and N22. Several of these postcodes cross borough or county boundaries and readers should treat the data accordingly. EN8 (Waltham Cross, Cheshunt) straddles the Enfield/Hertfordshire border and most of that housing stock actually sits in Broxbourne in Hertfordshire rather than the London Borough of Enfield, which is why EN8's rent and yield figures differ sharply from the central Enfield postcodes. N22 (Wood Green) sits mainly in Haringey, with only a sliver inside Enfield; N13 (Palmers Green) also crosses into Haringey and N11 (New Southgate, Arnos Grove) into both Haringey and Barnet. The other eight postcodes (EN1, EN2, EN3, EN4, N9, N14, N18, N21) are substantially inside the London Borough of Enfield. For a wider regional view, see the north London buy-to-let guide or the broader London property investment overview.
Article updated: April 2026
Enfield Buy-to-Let Market Overview 2026
Enfield covers 12 postcodes and is the only north London borough with a postcode (EN3) topping 6% gross yield, sitting directly adjacent to the 10,000-home Meridian Water regeneration.
- Average sold price: £472,725 (62.8% above England's £290,437)
- Asking price range: £369,044 (EN3, Enfield Lock) to £804,042 (EN4, Cockfosters)
- Rental yields: 3.2% (lowest, N14) to 6.2% (highest, EN3) across all 12 postcodes
- Rental income: Monthly rents from £1,511 (EN8, Waltham Cross) to £2,519 (EN4, Cockfosters)
- Price per sq ft: House prices from £461/sq ft (EN3, N9) to £648/sq ft (N22, Wood Green)
- Market activity: Sales ranging from 12 per month (N18, Edmonton) to 38 per month (EN1, Enfield Town)
- Deposit requirements: 30% deposits range from £110,713 (EN3) to £241,213 (EN4)
- Affordability ratios: Property prices from 8.2 to 17.9 times Enfield's median annual salary of £44,985
Contents

-
by Robert Jones, Founder of Property Investments UK
With two decades in UK property, Rob has been investing in buy-to-let since 2005, and uses property data to develop tools for property market analysis.

Property Data Sources
Our location guide relies on diverse, authoritative datasets including:
- HM Land Registry UK House Price Index
- Ministry of Housing, Communities and Local Government
- Ordnance Survey Data Hub
- Propertydata.co.uk
We update our property data quarterly to ensure accuracy. Last update: April 2026. All data is presented as provided by our sources without adjustments or amendments.
Why Invest in Enfield?
Enfield is home to 329,984 residents at the 2021 Census, a 5.61% increase on 2011. That absolute population feeds one of the larger outer-London housing markets by transaction volume, and the data below shows EN1 (Enfield Town) alone posting 38 sales per month, the highest in the borough. The borough stretches from Cockfosters and Hadley Wood in the north-west, down through Winchmore Hill and Palmers Green, across to Enfield Town and the Lea Valley in the east, ending at Lower Edmonton at the southern edge. Four Piccadilly line stations run through the western side of the borough at Arnos Grove (N11), Southgate (N14), Oakwood (N14) and Cockfosters (EN4, the line's northern terminus), while London Overground and Greater Anglia serve the eastern corridor through Enfield Town, Southbury, Enfield Lock, Ponders End and the new Meridian Water station.
The borough is split structurally into two markets that the data below makes plain. The western arc from EN4 through N14, N21 and N13 is the Piccadilly line trophy ring, where prices climb above £630,000 and yields drop below 3.8%. The eastern arc running through EN3, N9, N18 and EN8 follows the Lea Valley, sits on the Greater Anglia and London Overground lines into Stratford and Liverpool Street, and delivers the four cheapest postcodes in the borough. This is where the investable yield maths still work.
Median gross annual earnings for Enfield residents sit at £44,985, below the London regional median of £46,940 and well above the Great Britain median of £39,864. Employment runs at 74.6% and unemployment at 6.3%, both slightly weaker than the London averages of 75.0% employment and 5.6% unemployment. The top four employment sectors in Enfield are wholesale and retail trade (19.3% of jobs), human health and social work (15.6%), education (10.1%) and administrative and support services (10.1%). Chase Farm Hospital on The Ridgeway in Gordon Hill is run by the Royal Free London NHS Foundation Trust, which also acquired North Middlesex University Hospital at N18 Edmonton on 1 January 2025, giving the trust over 17,000 staff across a network that now covers the whole of Barnet, Enfield and Haringey. North Middlesex alone employs close to 4,000 staff and sits directly inside Enfield's lowest-priced postcode ring.
Enfield Economic Summary
- Population: 329,984 (2021 Census). Growth of 5.61% from 2011.
- Median gross weekly pay: £865.10 (Enfield), £902.70 (London), £766.60 (Great Britain)
- Employment rate: 74.6% (Enfield), 75.0% (London), 75.6% (Great Britain)
- Unemployment rate: 6.3% (Enfield), 5.6% (London), 4.3% (Great Britain)
- Key employment sectors: Wholesale and retail trade, human health and social work, education, administrative and support services
Source: ONS Explore Local Statistics for Enfield, Nomis Labour Market Profile for Enfield (ASHE 2025, Employment Oct 2024-Sep 2025)
Regeneration and Investment in Enfield
Three live regeneration programmes will add more than 11,000 new homes to the eastern side of Enfield over the next two decades, every one of them concentrated in the Lea Valley corridor through EN3, N9 and N18. That is not a coincidence. It is the same postcode cluster that already leads Enfield on yield and growth, and the new supply is being delivered in the places where the borough's investor maths still work.
- Meridian Water: A 20-year regeneration programme led by Enfield Council on 210 acres alongside the Lee Valley Regional Park in N18. The scheme targets 10,000 new homes and 6,000 jobs by the time the programme completes. Construction of Meridian One A finished in early 2026 with the final residents moving in, and Meridian Two is on track to complete its first two blocks in 2026, delivering 274 affordable homes managed by Metropolitan Thames Valley Housing. The new Meridian Water station opened on the Lea Valley line and now runs direct services to London Liverpool Street, Stratford, Stansted Airport and Cambridge, which materially changes the commuter catchment across N18, N9 and EN3.
- Edmonton Green Town Centre Regeneration: A 10-hectare redevelopment of the Edmonton Green Shopping Centre in N9, set to be delivered over 10 to 15 years and targeting more than 1,000 new homes alongside a new market, commercial space and refurbished public realm around the Overground station. The Green Pop-Up trading space opened on 19 March 2026, the first visible milestone of a longer programme that will reshape the rental catchment around Edmonton Green for the next decade. N9 already runs the second-highest yield in the borough at 6.0% on a £377,610 average asking price.
- Shaping Edmonton: A £11.9 million programme funded by the Ministry of Housing, Communities and Local Government, delivering nine public-realm projects across Edmonton over two years. The package includes a walking and cycling route connecting Edmonton into Meridian Water, a safer pedestrian crossing at Silver Street Station, improvements to Fore Street, an expanded Leeds Street Market and upgraded community facilities at Angel Community Centre and the Joyce and Snell's Estate. The programme is anchored in N9 and N18, the same postcodes that carry the borough's highest yields and lowest entry deposits.
Between them, Meridian Water, Edmonton Green and Shaping Edmonton concentrate thousands of new homes and committed public investment into a single east-Enfield corridor that already leads the borough on rental yield, five-year capital growth and entry price. The scale of that alignment is rare in outer London. Most boroughs that deliver yield have no regeneration pipeline; most boroughs with a regeneration pipeline deliver yield below 5%. Enfield is the one borough on the north-east London arc where the two stories land in the same postcodes.

Enfield Property Market Analysis
When was the last house price crash in Enfield?
Enfield is a London borough so all sold property prices from HM Land Registry are available at the borough level. The January 2026 borough average of £472,725 is down 2.8% from the December 2022 all-time high of £486,208 and down 0.4% year-on-year, a softer correction than the broader London region (-1.7% yoy) but slightly weaker than England, which has edged up 1.1% over the same period.
Zooming out across the full 31-year Land Registry record shows the pattern that investors should weigh against the current correction:
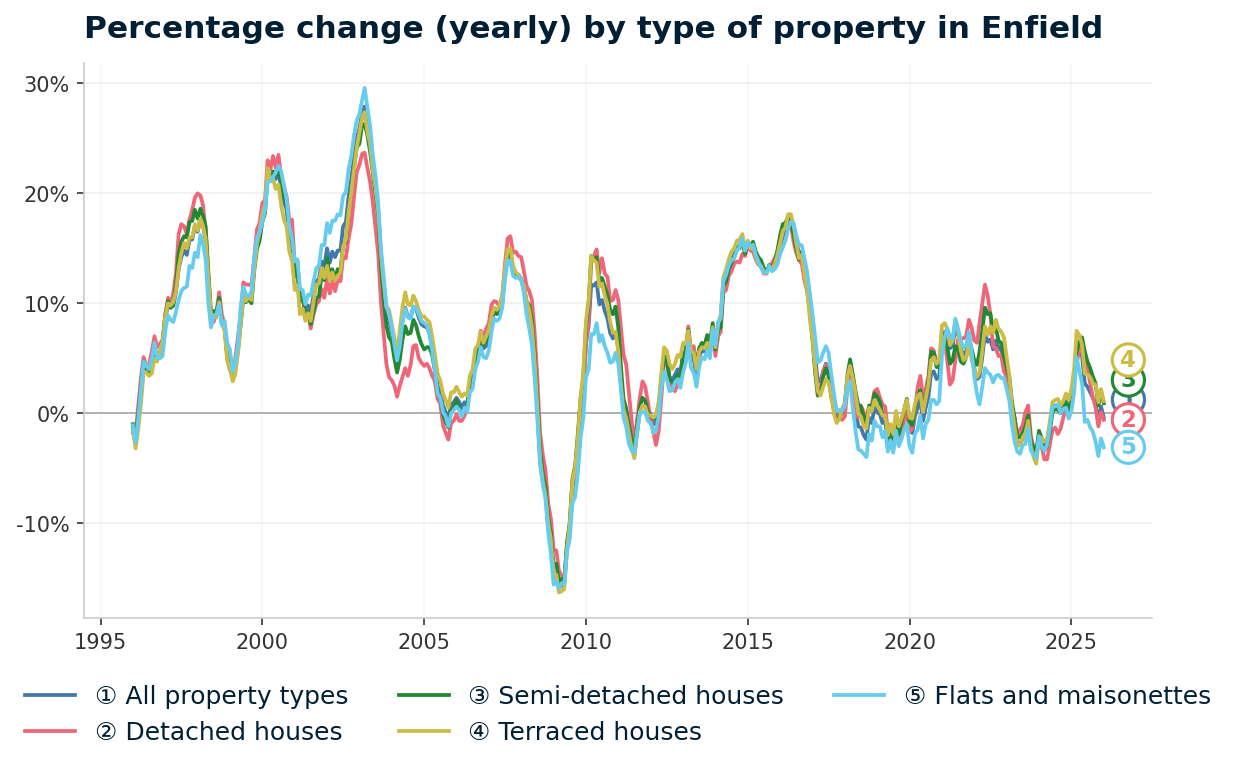
- 1995-2007 (The Boom): Enfield prices rose from £77,018 in January 1995 to a pre-crash peak of £273,135 in February 2008. That is a 254.6% uplift over thirteen years, driven by London's financial services expansion, rising owner-occupier demand and the gentrification of the Piccadilly line corridor through Southgate, Palmers Green and Winchmore Hill.
- 2008-2009 (The Financial Crisis): From the February 2008 peak of £273,135, Enfield prices fell to £226,787 by May 2009, a decline of 17.0% in fifteen months. The worst year-on-year reading came in March 2009 at -15.9%. London as a whole fell 17.8% from its own January 2008 peak to its April 2009 trough, so Enfield tracked the regional pattern almost exactly. England fell 18.2% over the same window. Flats were the hardest-hit segment in Enfield, down 17.6% from £206,727 to £170,280, closely followed by terraced houses at -16.8%.
- 2010-2013 (Stagnation and Slow Recovery): Prices moved sideways for three years, hovering between £227,000 and £275,000. The borough first matched its pre-crash peak in January 2013 at £273,998, three years and eight months after the trough.
- 2014-2016 (Turning Point): Recovery accelerated from 2014 as Help to Buy, ultra-low interest rates and spillover demand from inner London pushed Enfield through its pre-crash peak and into new territory. By January 2016 the borough average was £386,806, already 41% above the 2008 peak and the fastest three-year run in the borough's record.
- 2017-2019 (Pre-pandemic growth): Growth slowed as stamp duty reforms and Brexit uncertainty cooled inner London demand. Enfield drifted sideways, ending December 2019 at £423,700, a gain of less than 10% across the full three years.
- 2020-2022 (Pandemic surge): The stamp duty holiday and the rush for space produced a sharp uplift. Enfield climbed from £413,847 in January 2020 to £460,297 in January 2022 and peaked at £486,208 in December 2022, its all-time high.
- 2023 (Rate shock): Bank rate rises pushed monthly payments higher and cooled demand. Enfield's average slipped from £478,210 in January 2023 to £468,641 in January 2024, a 2.0% decline.
- 2024-2026 (Current): Prices steadied through 2025 and now sit at £472,725 in January 2026, 2.8% below the all-time high. The annual change reading of -0.4% places Enfield among the more resilient London boroughs, well ahead of Barnet (-4.2% yoy) and roughly in line with the London regional figure.
Over 31 years Enfield's average sold price has risen 513.8%, compounding at roughly 6.0% a year, and the journey has included one 17.0% crash and the current 2.8% correction. Investors assessing the current dip need to hold the long-term trajectory and the short-term correction in the same frame. The 5, 10, 15, 20 and 30 year windows all show positive growth: 5 years (+6.9%), 10 years (+22.2%), 15 years (+80.6%), 20 years (+107.9%), 30 years (+522.1%).
Source: HM Land Registry House Price Index for Enfield, January 1995 to January 2026.
Thinking of Buying?
We have off-market investment properties averaging 8%+ annual yield.
View Property DealsSold House Prices in Enfield
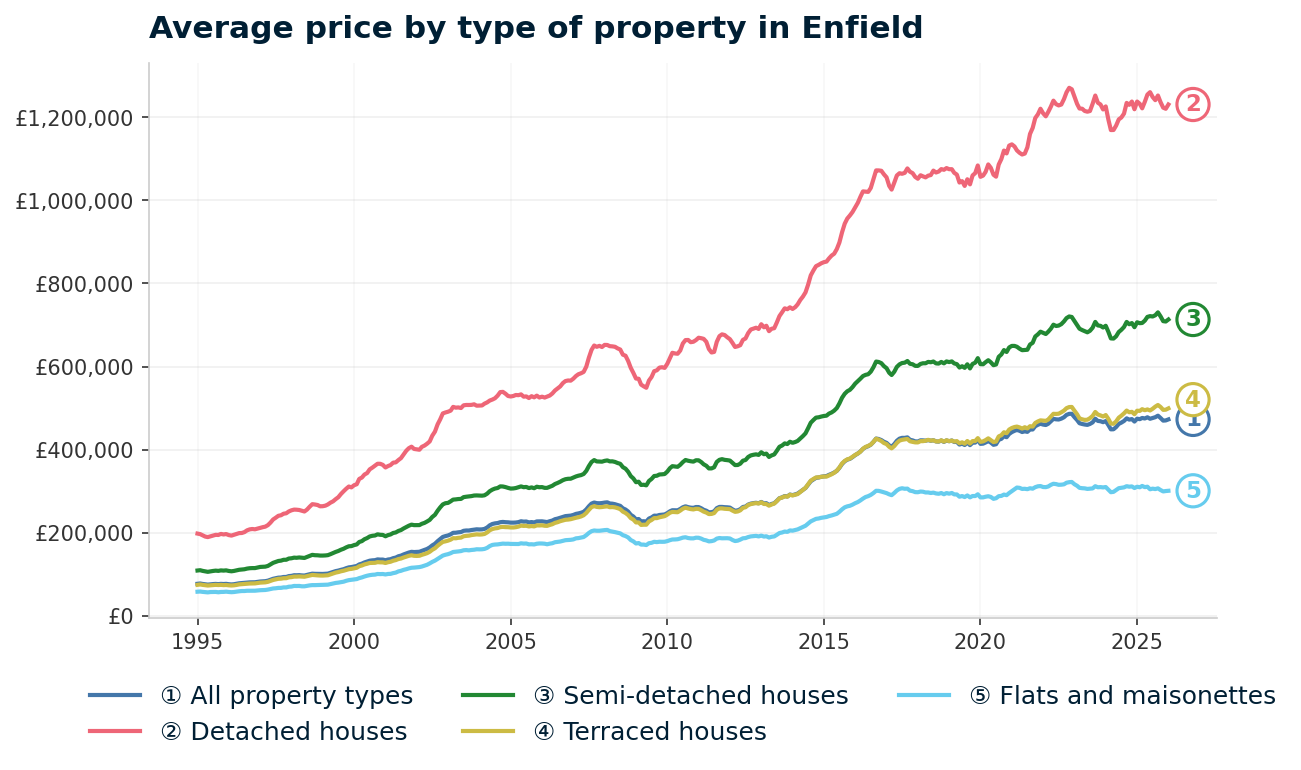
The January 2026 Land Registry figures put Enfield's average sold price at £472,725, 62.8% above the England average of £290,437. That headline is already substantial, but the gap widens sharply when you break it down by property type. Enfield's detached houses command more than two and a half times the national average for the same type, while flats trade at a far narrower 38% premium. This is the split that shapes what is actually investable in the borough for landlords working within realistic lending constraints.
| Property Type | Enfield Average | England Average | Difference |
|---|---|---|---|
| Detached houses | £1,230,824 | £468,546 | +£762,278 (+163%) |
| Semi-detached houses | £713,231 | £288,046 | +£425,185 (+148%) |
| Terraced houses | £499,275 | £243,580 | +£255,695 (+105%) |
| Flats and maisonettes | £300,902 | £218,449 | +£82,453 (+38%) |
| All property types | £472,725 | £290,437 | +£182,288 (+62.8%) |
Enfield's detached housing stock sits at £1.23m on average, more than two and a half times the England detached average. That reflects the borough's trophy ring through Hadley Wood (EN4), the larger plots in Winchmore Hill (N21) and the bigger houses along the Piccadilly line in Southgate (N14). This is the least investable tier for a yield-focused landlord. Annual change on detached stock is -0.6%, roughly in line with the borough average.
Semi-detached houses average £713,231, 148% above the England figure of £288,046. The semi market in Enfield runs across the 1930s suburban ring through Palmers Green, Winchmore Hill and Southgate, with older semis in Bush Hill Park and Enfield Town. Annual change on this segment is +0.9%, the second-best performer among the four property types, which is unusual in a year when most London semi markets are falling.
Terraced houses average £499,275, still 105% above England's £243,580. Terraced stock in Enfield concentrates heavily in Edmonton (N9, N18), Enfield Highway (EN3) and the older streets of Bush Hill Park (EN1). These are the postcodes most likely to deliver a single-let buy-to-let that actually meets lender stress tests, and at +1.1% year-on-year Enfield's terraced market is the strongest of the four segments.
Flats and maisonettes average £300,902, only 38% above the England average and the segment with the sharpest decline at -3.1%. The flat market is the most exposed to Enfield's current correction, partly because new-build supply from Meridian Water and the wider Edmonton programmes has added to resale competition and partly because rising mortgage costs have dampened first-time buyer demand. For investors, flats are also the segment where rental yields sit highest across the borough, particularly in the EN3 and N9 corridor next to Meridian Water.
Property Data Sources
Our location guide relies on diverse, authoritative datasets including:
- HM Land Registry UK House Price Index
- Ministry of Housing, Communities and Local Government
- Ordnance Survey Data Hub
- Propertydata.co.uk
We update our property data quarterly to ensure accuracy. Last update: April 2026. All data is presented as provided by our sources without adjustments or amendments.
Price Per Square Foot in Enfield
Price per square foot across Enfield's 12 postcodes runs from £461 in EN3 and N9 to £648 in N22 (Wood Green), a 41% spread within a single borough. Price per sq ft is the fairest way to compare postcodes because it strips out size. A cheap overall price can simply mean smaller stock. The table below shows the true ranking of stock value across Enfield, ordered from cheapest to most expensive.
| Rank | Area | Price per sq ft |
|---|---|---|
| 1 | EN3 (Enfield Lock, Ponders End) | £461 |
| 2 | N9 (Lower Edmonton) | £461 |
| 3 | EN8 (Waltham Cross, Cheshunt) | £462 |
| 4 | N18 (Edmonton) | £465 |
| 5 | EN1 (Enfield Town) | £510 |
| 6 | N13 (Palmers Green) | £535 |
| 7 | EN2 (Enfield Town North, Botany Bay) | £555 |
| 8 | N21 (Winchmore Hill) | £565 |
| 9 | N11 (New Southgate, Arnos Grove) | £573 |
| 10 | N14 (Southgate) | £581 |
| 11 | EN4 (Cockfosters, Hadley Wood) | £615 |
| 12 | N22 (Wood Green) | £648 |
EN3 and N9 tie at £461/sq ft, 29% below the borough's top postcode. These two postcodes sit in the Lea Valley corridor on the eastern side of the borough, straight along the Greater Anglia and London Overground lines into Stratford, Tottenham Hale and Liverpool Street. For investors looking for space per pound in an Enfield property, EN3 (Enfield Lock, Ponders End) and N9 (Lower Edmonton) deliver more square footage than anything else in the borough, and they sit directly next to the Meridian Water and Edmonton Green regeneration footprints.
The interesting twist is that N22 (Wood Green) tops the table at £648/sq ft rather than EN4 (Cockfosters) on its £804,042 asking price. N22 has the highest per-square-foot valuation in the borough despite not having the highest overall price. That reflects a flat-heavy stock base around the Piccadilly line at Wood Green and the smaller unit sizes in the new-build towers along the High Road. Smaller units produce higher per-square-foot values even when the overall price is lower. EN4 sits second at £615/sq ft on larger detached stock in Cockfosters and Hadley Wood, which is a genuinely premium market but trades at a lower per-foot value because the stock is bigger.
EN1, N13, EN2 and N21 form the borough's middle band at £510 to £565 per sq ft. These are the traditional suburban postcodes through Enfield Town, Palmers Green, Bush Hill Park and Winchmore Hill, where the housing mix leans toward semi-detached and terraced stock of 1920s-1940s vintage. Per-foot values here sit roughly 15-25% below N22 and EN4 and 10-20% above the Lea Valley cluster at the bottom of the table.
For Sale Asking Prices in Enfield
Mean asking prices across all 12 Enfield postcodes run from £369,044 in EN3 up to £804,042 in EN4, with a borough mean of £527,549. Where the sold-price table in the previous section reflects completed transactions, asking prices reflect what current sellers think their stock is worth. Enfield's asking price distribution is unusually bimodal for a London borough: four postcodes sit below £420,000 (EN3, N9, N18, EN8) and three postcodes sit above £630,000 (N21, N14, EN4), with the middle five filling the £470k-£560k band.
| Rank | Area | Average Asking Price |
|---|---|---|
| 1 | EN3 (Enfield Lock, Ponders End) | £369,044 |
| 2 | N9 (Lower Edmonton) | £377,610 |
| 3 | N18 (Edmonton) | £412,967 |
| 4 | EN8 (Waltham Cross, Cheshunt) | £417,914 |
| 5 | EN1 (Enfield Town) | £470,823 |
| 6 | N22 (Wood Green) | £522,116 |
| 7 | N11 (New Southgate, Arnos Grove) | £522,337 |
| 8 | EN2 (Enfield Town North, Botany Bay) | £554,199 |
| 9 | N13 (Palmers Green) | £559,810 |
| 10 | N21 (Winchmore Hill) | £630,853 |
| 11 | N14 (Southgate) | £688,866 |
| 12 | EN4 (Cockfosters, Hadley Wood) | £804,042 |
EN3 is the only Enfield postcode where the mean asking price sits under £370,000. At £369,044 it is 30% below the borough mean and 54% below EN4 at the top. This gap is the single most important number in the Enfield investor dataset because it determines which postcodes can deliver rental maths that stress-test at current mortgage rates. EN3 sits on the Lea Valley line directly adjacent to Meridian Water, and the new station opened on the same line in recent years, which has repositioned EN3's commuter catchment without yet repricing the housing stock.
The middle band from EN1 to N13 (£470k to £560k) covers five postcodes and absorbs most of Enfield's transaction volume. Enfield Town (EN1), Wood Green (N22), New Southgate (N11), Enfield Town North (EN2) and Palmers Green (N13) all sit here. For a landlord comparing Enfield against London's highest-yielding postcodes, this is the tier where the yield maths become borderline at current mortgage rates. The upper band from N21 through to EN4 runs from £631k to £804k, a range that sits above realistic buy-to-let territory for most leveraged investors and above the point where most lenders' stress tests will clear at the current borough yield profile.

House Price Growth in Enfield
Growth patterns across Enfield over one, three and five years tell a single story: the cheaper eastern postcodes have outperformed the expensive western postcodes on every window. EN3 leads the five-year table at +16.6%, followed by N11 at +14.7% and EN1 at +14.1%, while EN4 sits at the bottom with -1.8% over the same window. The table below ranks all 12 Enfield postcodes by five-year growth.
| Area | 1 Year | 3 Years | 5 Years |
|---|---|---|---|
| EN3 (Enfield Lock, Ponders End) | +2.7% | +9.9% | +16.6% |
| N11 (New Southgate, Arnos Grove) | -2.0% | -5.8% | +14.7% |
| EN1 (Enfield Town) | +2.5% | +1.9% | +14.1% |
| N22 (Wood Green) | +14.4% | +5.4% | +11.9% |
| EN8 (Waltham Cross, Cheshunt) | +1.6% | -0.4% | +11.5% |
| N21 (Winchmore Hill) | +1.1% | -0.2% | +9.7% |
| N9 (Lower Edmonton) | -0.9% | -0.2% | +9.7% |
| N13 (Palmers Green) | +5.1% | +6.9% | +7.9% |
| N18 (Edmonton) | -5.9% | -3.2% | +7.4% |
| N14 (Southgate) | +10.2% | -0.4% | +6.8% |
| EN2 (Enfield Town North, Botany Bay) | +5.9% | +1.8% | +5.7% |
| EN4 (Cockfosters, Hadley Wood) | -2.3% | -0.1% | -1.8% |
EN3 leads the five-year growth table at +16.6% and is one of five Enfield postcodes (EN1, EN2, EN3, N13 and N22) to post positive growth in every time window. At +16.6% over five years, a £350,000 property bought in April 2021 would now be worth around £408,000 on paper. The postcode sits on the Lea Valley line directly adjacent to the Meridian Water regeneration and the new Meridian Water station, a combination that has repositioned EN3's commuter catchment without yet repricing the housing stock. This is the one Enfield postcode where yield and growth land in the same ranking position at the top of both tables.
The top tier of five-year performers (EN3, N11, EN1, N22, EN8) sits across the affordable half of the borough. Four of these five postcodes have mean asking prices under £525k, which is the opposite of what investors see in most inner London boroughs where the premium postcodes have done the heavy lifting on capital growth. N22 is the outlier on the short term at +14.4% over 12 months. Note that the N22 figure is from the Enfield-attributed sliver of the postcode rather than the main Wood Green market, which sits in Haringey, so read this row alongside the Haringey guide before drawing conclusions.
EN4 is the only Enfield postcode showing negative growth over five years, at -1.8%. Cockfosters and Hadley Wood sit at the Piccadilly line's northern terminus in the borough's most expensive tier, and the same capital flight that has hit N2 (East Finchley) in Barnet and other large-detached postcodes along the northern London fringe has pulled EN4 back. It is down 2.3% over the past year on top of the five-year slide. For leveraged buy-to-let investors the slide matters less than the underlying yield (3.8%) and the £241,213 deposit floor, both of which sit near the bottom of the borough.
Monthly Property Sales in Enfield
EN1 records 38 sales a month against the borough low of 12 in N18, a 3.2x difference in transaction volume between the busiest and quietest postcodes. Sales volume tells investors two things at once: how liquid the market is (can you sell when you need to?) and how much comparable evidence lenders have for valuations. A postcode running 30+ sales a month has plenty of recent comparables. A postcode running 12 has thinner evidence and can move more abruptly on a single high or low sale.
| Area | Sales per month | Turnover | Asking Price |
|---|---|---|---|
| EN1 (Enfield Town) | 38 | 15% | £470,823 |
| EN3 (Enfield Lock, Ponders End) | 32 | 18% | £369,044 |
| EN8 (Waltham Cross, Cheshunt) | 29 | 13% | £417,914 |
| EN2 (Enfield Town North, Botany Bay) | 22 | 7% | £554,199 |
| N9 (Lower Edmonton) | 21 | 17% | £377,610 |
| N11 (New Southgate, Arnos Grove) | 18 | 10% | £522,337 |
| N14 (Southgate) | 18 | 9% | £688,866 |
| EN4 (Cockfosters, Hadley Wood) | 17 | 5% | £804,042 |
| N13 (Palmers Green) | 16 | 8% | £559,810 |
| N21 (Winchmore Hill) | 16 | 8% | £630,853 |
| N22 (Wood Green) | 16 | 7% | £522,116 |
| N18 (Edmonton) | 12 | 16% | £412,967 |
Three postcodes dominate Enfield's transaction volume: EN1, EN3 and EN8 all run between 29 and 38 sales a month. Together they account for 99 sales a month, roughly 42% of the borough total from 25% of the postcodes. These are the workhorse markets, and they share two characteristics: asking prices under £475,000 and a deep pool of 1930s and post-war stock that moves through the market regularly. EN1 leads on absolute volume and posts a 15% annual turnover, meaning roughly one in six Enfield Town properties changes hands each year. EN3 is close behind at 32 sales a month on an 18% turnover, the highest turnover rate in the borough.
EN3 and N9 share the borough's highest turnover rates at 18% and 17% despite sitting at the bottom of the asking price ladder. High turnover in cheap postcodes usually reflects active landlord repositioning and steady first-time buyer demand, and the Meridian Water/Edmonton Green development activity is adding to the churn. N18 (Edmonton) runs the quietest absolute volume at 12 sales a month but still posts a 16% turnover rate, which indicates a smaller stock base rather than a struggling market. For landlords watching for opportunity, high turnover postcodes tend to produce better buying evidence because there is more recent data to price off.
EN4, N13, N21 and N22 form the quieter tier at 16-17 sales a month with turnover between 5% and 8%. These are the premium or mixed postcodes where buying evidence is thinner and valuations can move more sharply. EN4 in particular runs the lowest turnover in the borough at 5% on 17 sales a month, which means a Cockfosters landlord has roughly 200 sales a year of comparable evidence to price against. That is fine in a stable market and difficult in a volatile one.
Property Data Sources
Our location guide relies on diverse, authoritative datasets including:
- HM Land Registry UK House Price Index
- Ministry of Housing, Communities and Local Government
- Ordnance Survey Data Hub
- Propertydata.co.uk
We update our property data quarterly to ensure accuracy. Last update: April 2026. All data is presented as provided by our sources without adjustments or amendments.

Enfield Rental Market Analysis
For investors weighing up whether rental property is a worthwhile investment in Enfield, the data below breaks down average monthly rents and gross rental yields across the borough's 12 postcodes. Readers comparing Enfield stock with wider UK opportunities can also scan current buy-to-let properties for sale across other regions where entry prices sit well below the London floor.
All 12 Enfield postcodes have active rental data, with monthly rents spanning from £1,511 in EN8 (Waltham Cross, Cheshunt) to £2,519 in EN4 (Cockfosters, Hadley Wood) and gross yields from 3.2% in N14 up to 6.2% in EN3. If you are looking to build a property portfolio in north London, Enfield's combination of the widest yield gradient of any adjacent borough and a deep commuter tenant pool along the Lea Valley line make the postcode-by-postcode read the only one that matters.
Average Rent & Gross Rental Yields in Enfield
EN3 (Enfield Lock, Ponders End) tops the borough at 6.2% gross yield, almost twice the lowest yield of 3.2% in N14 (Southgate). The Enfield yield table does something unusual for a London borough: every postcode has data, every postcode has a meaningful rent, and the gap between top and bottom is wide enough that it separates genuinely investable postcodes from trophy-asset ones. Three postcodes clear the 5.5% yield mark, a threshold that few London boroughs reach in any postcode.
| Area | Average Rent (PCM) | Asking Price | Gross Yield |
|---|---|---|---|
| EN3 (Enfield Lock, Ponders End) | £1,915 | £369,044 | 6.2% |
| N9 (Lower Edmonton) | £1,892 | £377,610 | 6.0% |
| N18 (Edmonton) | £1,908 | £412,967 | 5.5% |
| EN1 (Enfield Town) | £1,902 | £470,823 | 4.8% |
| EN8 (Waltham Cross, Cheshunt) | £1,511 | £417,914 | 4.3% |
| N11 (New Southgate, Arnos Grove) | £1,874 | £522,337 | 4.3% |
| N22 (Wood Green) | £1,820 | £522,116 | 4.2% |
| EN2 (Enfield Town North, Botany Bay) | £1,792 | £554,199 | 3.9% |
| N13 (Palmers Green) | £1,785 | £559,810 | 3.8% |
| EN4 (Cockfosters, Hadley Wood) | £2,519 | £804,042 | 3.8% |
| N21 (Winchmore Hill) | £1,814 | £630,853 | 3.4% |
| N14 (Southgate) | £1,844 | £688,866 | 3.2% |
EN3's yield advantage is driven by price, not rent. The £1,915 monthly rent in EN3 is almost identical to the £1,908 in N18, the £1,902 in EN1 and the £1,892 in N9. What sets EN3 apart is the £369,044 asking price, 22% below EN1 and 54% below EN4 despite commanding similar monthly rents. That price gap is the lever, not the rental income. Meridian Water's new supply and the Meridian Water station now running direct services into Liverpool Street, Stratford, Stansted and Cambridge has materially deepened the commuter tenant pool for EN3 without yet repricing the housing stock.
The 4.2% to 4.8% band covering EN1, EN8, N11 and N22 is where Enfield's middle-tier investor maths still work. Four postcodes sit in the 4.2% to 4.8% range. At current buy-to-let mortgage rates, 4.0% gross is the minimum floor most lenders will stress at, so this band represents the borough's genuinely mortgageable yield territory beyond the EN3/N9/N18 Lea Valley cluster. EN1 in particular combines an 4.8% yield with the highest absolute sales volume in the borough at 38 per month, which is an unusual pairing of income-grade yield and deep market liquidity.
The bottom of the table (N14, N21, EN4, N13, EN2) is trophy-asset and Piccadilly line territory, not rental territory. EN4 pulls the highest rent in the borough at £2,519 a month but against an £804,042 asking price that produces a 3.8% gross yield before costs. N14 at 3.2% is the lowest yield in the borough by a margin, and at that level a leveraged buy-to-let mortgage would fail most lenders' stress tests on the first pass. These postcodes are capital-preservation plays for buyers with a different investment thesis, not income plays for landlords.
Is Enfield Rent High?
Rents in Enfield consume a significant share of local earnings, and the range is narrower than the asking-price table suggests. EN4 (Cockfosters, Hadley Wood) rents swallow 67.2% of median local gross monthly income at £2,519 a month, while EN8 (Waltham Cross, Cheshunt) rents take the lowest share at 40.3% on £1,511 a month. Ten of the 12 postcodes sit inside a 4-percentage-point band between 47.6% and 51.1%, which is tighter than most London boroughs manage on rent-to-income.
The median gross weekly salary in Enfield is £865.10, which equates to £3,749 per month or £44,985 per year. This is below the London regional median of £902.70 per week and above the Great Britain median of £766.60 per week. Data from the Nomis Labour Market Profile for Enfield (ASHE 2025).
| Rank | Area | Rent as % of Income |
|---|---|---|
| 1 | EN4 (Cockfosters, Hadley Wood) | 67.2% |
| 2 | EN3 (Enfield Lock, Ponders End) | 51.1% |
| 3 | N18 (Edmonton) | 50.9% |
| 4 | EN1 (Enfield Town) | 50.7% |
| 5 | N9 (Lower Edmonton) | 50.5% |
| 6 | N11 (New Southgate, Arnos Grove) | 50.0% |
| 7 | N14 (Southgate) | 49.2% |
| 8 | N22 (Wood Green) | 48.5% |
| 9 | N21 (Winchmore Hill) | 48.4% |
| 10 | EN2 (Enfield Town North, Botany Bay) | 47.8% |
| 11 | N13 (Palmers Green) | 47.6% |
| 12 | EN8 (Waltham Cross, Cheshunt) | 40.3% |
Every Enfield postcode shows rents above the traditional 30% affordability benchmark, with EN4 the only one above 60%. That is a feature of London, not an Enfield anomaly. Tenant household incomes typically exceed individual resident earnings (two-earner households, dual-income professionals, sharers) so the ratio here should be read as a relative measure across postcodes, not as an absolute statement about affordability.
EN8 (Waltham Cross, Cheshunt) stands out at 40.3% rent-to-income, roughly 10 percentage points below the borough pack. EN8 sits at the northern edge of the borough crossing into Hertfordshire, and its £1,511 monthly rent is £281 below the next-lowest Enfield rent. The lower rent reflects a different tenant mix leaning more toward family rentals than commuter professionals, and a housing stock that is meaningfully cheaper per square foot than the central Enfield postcodes. Beyond EN8, ten of the remaining eleven postcodes cluster in a tight 47.6%-51.1% band, which is unusually consistent for an outer London borough and reflects the fact that rents in Enfield haven't spread as far as asking prices have.
Thinking of Buying?
We have off-market investment properties averaging 8%+ annual yield.
View Property DealsBuy-to-Let Considerations in Enfield
Are House Prices High? Price-to-Earnings Ratios
Purchasing a property in Enfield requires between 8.2 and 17.9 times the median annual salary. This is based on the Nomis Labour Market Profile for Enfield showing the median gross annual income for Enfield residents is £44,985. The table below ranks all 12 Enfield postcodes by price-to-earnings ratio, lowest first.
| Rank | Area | Price-to-Earnings Ratio |
|---|---|---|
| 1 | EN3 (Enfield Lock, Ponders End) | 8.2 |
| 2 | N9 (Lower Edmonton) | 8.4 |
| 3 | N18 (Edmonton) | 9.2 |
| 4 | EN8 (Waltham Cross, Cheshunt) | 9.3 |
| 5 | EN1 (Enfield Town) | 10.5 |
| 6 | N22 (Wood Green) | 11.6 |
| 7 | N11 (New Southgate, Arnos Grove) | 11.6 |
| 8 | EN2 (Enfield Town North, Botany Bay) | 12.3 |
| 9 | N13 (Palmers Green) | 12.4 |
| 10 | N21 (Winchmore Hill) | 14.0 |
| 11 | N14 (Southgate) | 15.3 |
| 12 | EN4 (Cockfosters, Hadley Wood) | 17.9 |
Four Enfield postcodes (EN3, N9, N18, EN8) sit below 10 times the median salary, and EN3 leads the borough at 8.2. That is the lowest P/E ratio of any postcode in an adjacent London borough, and it is meaningfully cheaper on a salary-multiple basis than anything Barnet offers (where NW9 sits at 9.4 times). These four postcodes all sit in the eastern half of Enfield along the Lea Valley. Everything else in the borough requires more than 10 times the median resident salary, and the top three (N21, N14, EN4) sit between 14.0 and 17.9 times, which is trophy-asset territory bought with capital from outside the borough's salary pool.
The median of the table sits between N22 and N11 (both at 11.6x), which puts Enfield's typical postcode at around 11.5 times the median salary. For context, the England average price-to-earnings ratio sits near 8.5 times in 2026. Enfield is more expensive on this measure, but it is also the cheapest adjacent London borough on salary multiples, with a floor (8.2 in EN3) that lands below the England average. The affordability stretch is why Enfield's investable postcodes cluster in the eastern Lea Valley corridor, where the price-to-earnings maths still allow middle-income buyers and tenants to participate without dual-income households or external capital. Investors comparing Enfield against the best buy-to-let areas in the UK should weight this ratio heavily: it is one of the few London-proximate markets where the salary multiple still meets conventional mortgage underwriting on single-income applications.
Deposit Requirements in Enfield
A 30% deposit on an average Enfield property ranges from £110,713 in EN3 to £241,213 in EN4. Buy-to-let mortgages typically require 25% to 30% deposits, and lenders stress-testing rental cover at current rates will in practice push most applicants toward the 30% figure. The table below shows the 30% deposit required for an average property in each postcode. See the stamp duty calculator and buy-to-let costs guides for the full upfront capital position.
| Rank | Area | 30% Deposit Required |
|---|---|---|
| 1 | EN3 (Enfield Lock, Ponders End) | £110,713 |
| 2 | N9 (Lower Edmonton) | £113,283 |
| 3 | N18 (Edmonton) | £123,890 |
| 4 | EN8 (Waltham Cross, Cheshunt) | £125,374 |
| 5 | EN1 (Enfield Town) | £141,247 |
| 6 | N22 (Wood Green) | £156,635 |
| 7 | N11 (New Southgate, Arnos Grove) | £156,701 |
| 8 | EN2 (Enfield Town North, Botany Bay) | £166,260 |
| 9 | N13 (Palmers Green) | £167,943 |
| 10 | N21 (Winchmore Hill) | £189,256 |
| 11 | N14 (Southgate) | £206,660 |
| 12 | EN4 (Cockfosters, Hadley Wood) | £241,213 |
The £110,713 entry point in EN3 is the lowest any Enfield buyer can access, 54% less than the £241,213 required in EN4. Stepping up one rank from EN3 into N9 costs another £2,570 in deposit, then £10,607 more into N18, and £1,484 more into EN8. The first four postcodes on the table (EN3, N9, N18, EN8) sit within a £14,661 deposit spread, which is the realistic choice set for most Enfield buy-to-let buyers comparing entry options in the same sub-£420k asking price band. Investors working with tighter capital might find additional value examining below market value properties across the wider north-east London catchment, where the entry deposit can sit well below the £110,000 floor even within the same postcode ring.
The top three deposit figures (N14, EN4 and N21) all require over £189,000 in cash. At that capital level, most Enfield investors either pay cash outright or spread the same capital across multiple properties in cheaper postcodes. A £241,213 deposit on one EN4 property could alternatively deliver two £400,000 properties in Enfield's Lea Valley cluster with 30% deposits of roughly £120,000 each, producing two rental income streams instead of one. This is one reason the investable stock in Enfield concentrates so heavily in EN3, N9 and N18.

What the Enfield Data Tells Buy-to-Let Investors
Enfield's investable yield band sits in EN3, N9, N18, EN1, EN8, N11 and N22, with gross yields between 4.2% and 6.2%. Seven of Enfield's 12 postcodes clear the 4.0% floor that buy-to-let stress tests typically require. EN3 at 6.2% and N9 at 6.0% are the only two postcodes offering meaningful headroom above that floor, and both sit in the Lea Valley corridor where Meridian Water and Edmonton Green are concentrating new supply. Deposits in this band range from £110,713 up to £156,701, and the tenant pool is deepest where the Meridian Water station and Edmonton Green Overground catchments meet existing stock. Single-let and small-HMO strategies work best in this band, and investment property and off-market property sourcing options can often beat the open-market entry price in these postcodes.
The growth postcodes in Enfield are EN3, N11, EN1, N22 and EN8, with five-year gains between 11.5% and 16.6%. Four of these five postcodes also sit in the investable yield band, which is the rare Enfield characteristic that investors should weigh heavily: EN3 is the only London-proximate postcode that leads its borough on both yield (6.2%) and five-year growth (16.6%). N11 leads on pure growth at +14.7% over five years but sits at 4.3% yield, a reasonable pairing in a market where inner-London yields more typically drop below 3.5%. The data points to the eastern Lea Valley cluster as the postcodes most likely to deliver both streams in the next cycle, which is consistent with the regeneration pipeline being delivered immediately adjacent.
Three postcodes sit at the weaker end of the Enfield data: EN4, N21 and N14. EN4 (Cockfosters, Hadley Wood) delivers 3.8% gross yield, has fallen 1.8% over five years and 2.3% over the past year, and requires a £241,213 deposit. N21 (Winchmore Hill) combines 3.4% yield with slower five-year growth of 9.7% on a £189,256 deposit floor. N14 (Southgate) is the lowest yield in the borough at 3.2%, with 10.2% one-year growth softening the picture but a £206,660 deposit requirement. These are the three postcodes where the investor maths work hardest, and all three sit on the Piccadilly line's northern branch on the western side of the borough.
Licensing in Enfield is tighter than most London boroughs. Enfield Council operates a borough-wide additional HMO licensing scheme that started on 1 September 2025 and runs to 31 August 2030, capturing any HMO let to three or four people from more than one household under one or more tenancies, with a £1,450 fee payable in two parts. A separate selective licensing scheme covering 14 wards (Bowes, Chase, Edmonton Green, Enfield Highway, Enfield Lock, Haselbury, Jubilee, Lower Edmonton, Palmers Green, Ponders End, Southbury, Southgate Green, Turkey Street and Upper Edmonton) is in force until 31 August 2026 and requires a £735 licence for most privately rented properties in those wards. The council consulted on an extended 17-ward scheme that closed on 28 December 2025, with a decision expected in Spring 2026. Landlords targeting EN1, EN3, N9 or N18 stock need to factor the additional licence cost into buy-to-let maths from day one. See selective licensing schemes in England for a broader primer.
How Enfield Compares
Enfield's £527,549 mean asking price is the second cheapest of its five compared neighbours, £17,707 above Waltham Forest at the low end and £164,269 below Barnet at the top. Its 6.2% top yield is the highest of any adjacent London borough, matched only by Hertfordshire at 6.6% (which sits outside Greater London). The table below shows how Enfield stacks up against Waltham Forest, Hertfordshire, Haringey and Barnet.
| Location | Mean Asking Price | Mean Rent (PCM) | Top Yield |
|---|---|---|---|
| Waltham Forest | £509,842 | £1,988 | 5.9% |
| Enfield | £527,549 | £1,881 | 6.2% |
| Hertfordshire | £537,337 | £1,679 | 6.6% |
| Haringey | £590,130 | £2,065 | 5.7% |
| Barnet | £691,818 | £2,114 | 5.7% |
Waltham Forest is the cheapest of the five and delivers a 5.9% top yield on a mean £509,842. It sits south of Enfield across the North Circular, and its Walthamstow, Leyton and Leytonstone rental markets draw on a different Underground corridor that does not serve Enfield itself. For an investor choosing between the two boroughs, the top yield in Enfield (6.2% in EN3) is 30 basis points higher at a £17,707 higher mean asking price, which is a finer margin than most comparisons deliver.
Hertfordshire sits just above Enfield on mean asking price at £537,337 and delivers the highest top yield of the five at 6.6%. Hertfordshire's mean rent is £202 a month below Enfield's, which reflects a broader county-wide dataset covering towns from Watford through St Albans to Stevenage rather than a tight borough boundary. It competes directly with Enfield's EN3 corridor through Cheshunt and Hoddesdon, which sit immediately north of EN8. Enfield retains the London-borough designation and transport connectivity into central London that Hertfordshire postcodes cannot match.
Haringey and Barnet both sit above Enfield on price, with Barnet £164,269 higher and Haringey £62,581 higher. Haringey tops out at 5.7% gross yield, 50 basis points below Enfield's EN3, on a mean rent of £2,065 that is £184 higher than Enfield's. Haringey's tenant pool skews toward Tottenham, Wood Green and Crouch End commuter professionals on the Piccadilly and Victoria lines. Barnet's 5.7% top yield at £691,818 mean requires roughly £50,000 more cash deposit than Enfield's EN3 entry point to access similar yield territory. For yield-first investors, Enfield is materially better positioned than either neighbour on the cheapest postcode across all three boroughs.
For investors comparing at the London-wide level, the cheapest areas of London and the highest-yielding London postcodes provide wider context for Enfield's position. Enfield comes in below the mean on price and above the mean on yield for its immediate neighbour set, with EN3 as its single strongest entry point.
Frequently Asked Questions
Which Enfield postcodes work best for buy-to-let investors?
EN3 (Enfield Lock, Ponders End) and N9 (Lower Edmonton) are the only Enfield postcodes with gross yields above 5.5%, at 6.2% and 6.0% respectively. Five more postcodes (N18, EN1, EN8, N11, N22) sit between 4.2% and 5.5%, the band where most buy-to-let mortgage stress tests clear. Deposits in this band range from £110,713 in EN3 up to £156,701 in N11. The top three postcodes by five-year growth are EN3 (+16.6%), N11 (+14.7%) and EN1 (+14.1%), and EN3 is the single postcode that leads on both yield and five-year growth at the same time. The data points to EN3 and N9 for yield-led strategy, EN1 for yield-plus-growth with the highest sales volume in the borough, and N11 or N22 for a growth-focused strategy in the middle band.
Is Enfield in Essex?
No. Enfield is a London borough, officially the London Borough of Enfield with ONS code E09000010, and it sits inside Greater London. It was historically part of Middlesex, not Essex, before Middlesex was absorbed into the Greater London authority area in 1965. The borough shares its eastern boundary with Waltham Forest (a London borough) and its northern boundary with Hertfordshire (a separate county). The confusion sometimes arises because the EN postcode area also covers parts of Hertfordshire, including Waltham Cross and Hoddesdon, but the London Borough of Enfield itself is entirely within Greater London.
Does Enfield require an HMO licence for buy-to-let landlords?
Yes, and the Enfield rules are tighter than the national mandatory scheme. Enfield Council runs a borough-wide additional HMO licensing scheme that started on 1 September 2025 and runs to 31 August 2030. It applies to any HMO let to three or four people from more than one household sharing amenities, a lower threshold than the five-person rule in the national mandatory scheme. The additional licence fee is £1,450 payable in two parts.
On top of that, a separate selective licensing scheme covers 14 wards (Bowes, Chase, Edmonton Green, Enfield Highway, Enfield Lock, Haselbury, Jubilee, Lower Edmonton, Palmers Green, Ponders End, Southbury, Southgate Green, Turkey Street and Upper Edmonton) to 31 August 2026 with a £735 fee. The council has consulted on an extension covering 17 wards from September 2026. For an investor-grade primer on the underlying rules, see selective licensing schemes in England. Landlords targeting EN1, EN3, EN8, N9 or N18 stock are likely to fall inside one of the two schemes.
What is the average house price in Enfield?
The Land Registry January 2026 figure for Enfield is £472,725, down 0.4% year-on-year and down 2.8% from the December 2022 all-time high of £486,208. That compares with £290,437 for England (up 1.1% yoy) and £554,422 for the London region (down 1.7% yoy). Enfield's average is 62.8% above the England figure and 14.7% below the London regional figure. Within the borough, asking prices range from £369,044 in EN3 up to £804,042 in EN4, a 2.2-times spread across 12 postcodes. The current correction has hit flats hardest (-3.1% yoy) while semi-detached and terraced stock are both slightly positive year-on-year.
Will Meridian Water affect Enfield property prices?
Meridian Water is a 20-year regeneration led by Enfield Council on 210 acres next to the Lee Valley Regional Park in N18, targeting 10,000 new homes and 6,000 jobs. Meridian One A completed in early 2026, and Meridian Two is on track to complete its first two blocks in 2026 with 274 affordable homes managed by Metropolitan Thames Valley Housing. The new Meridian Water station is open and runs direct services to Liverpool Street, Stratford, Stansted Airport and Cambridge.
For investors, the direct effect is on rental demand in N18, N9 and EN3, where the station catchment meets existing stock. EN3 already leads the borough on both yield (6.2%) and five-year growth (+16.6%), and the five-year numbers show EN3 outperforming every other Enfield postcode since the programme ramped up. The supply side of the equation matters too: several thousand new homes over the next decade will add to local comparables and may cap short-term capital growth in the immediate new-build corridor. The net effect on existing resale stock will depend on how quickly the new commercial space fills and on how much of the 10,000-home target is actually delivered on schedule.
What are the main areas in the London Borough of Enfield?
The 12 postcodes in this guide split broadly into three zones. The west runs along the Piccadilly line through Arnos Grove (N11), Southgate (N14), Oakwood and Cockfosters (EN4, the line's northern terminus), together with Palmers Green (N13), Winchmore Hill (N21) and Hadley Wood at the Hertfordshire border. The centre covers Enfield Town (EN1) and Enfield Town North and Botany Bay (EN2). The east follows the Lea Valley corridor through Lower Edmonton and Edmonton (N9, N18), Enfield Lock and Ponders End (EN3), and Waltham Cross and Cheshunt (EN8), which is where Meridian Water and Edmonton Green are concentrated and where the highest yields sit.
N22 (Wood Green) is a partial postcode that sits mainly in Haringey, with only a small sliver inside Enfield. The borough's most affordable entry points are in EN3, N9, N18 and EN8; the most expensive are in EN4, N14 and N21.
Where can I find property for sale in Enfield?
The 12 postcodes in this guide collectively account for 255 residential sales per month, led by EN1 (Enfield Town) at 38 per month, EN3 (Enfield Lock, Ponders End) at 32 and EN8 (Waltham Cross, Cheshunt) at 29. Asking prices range from £369,044 in EN3 to £804,042 in EN4 (Cockfosters, Hadley Wood). Turnover rates run highest in the Lea Valley cluster, where EN3 and N9 each see roughly one property in six change hands per year.
Buyer-focused investors will find the deepest open-market liquidity in EN1 and EN3. For off-market and below-market-value opportunities that sit outside the main portals, see our below market value properties, investment property and off-market property listings, which are often the only way to beat the open-market entry prices in the sub-£420k Lea Valley band.