South London Buy-to-Let Investment: Hotspots and Opportunities
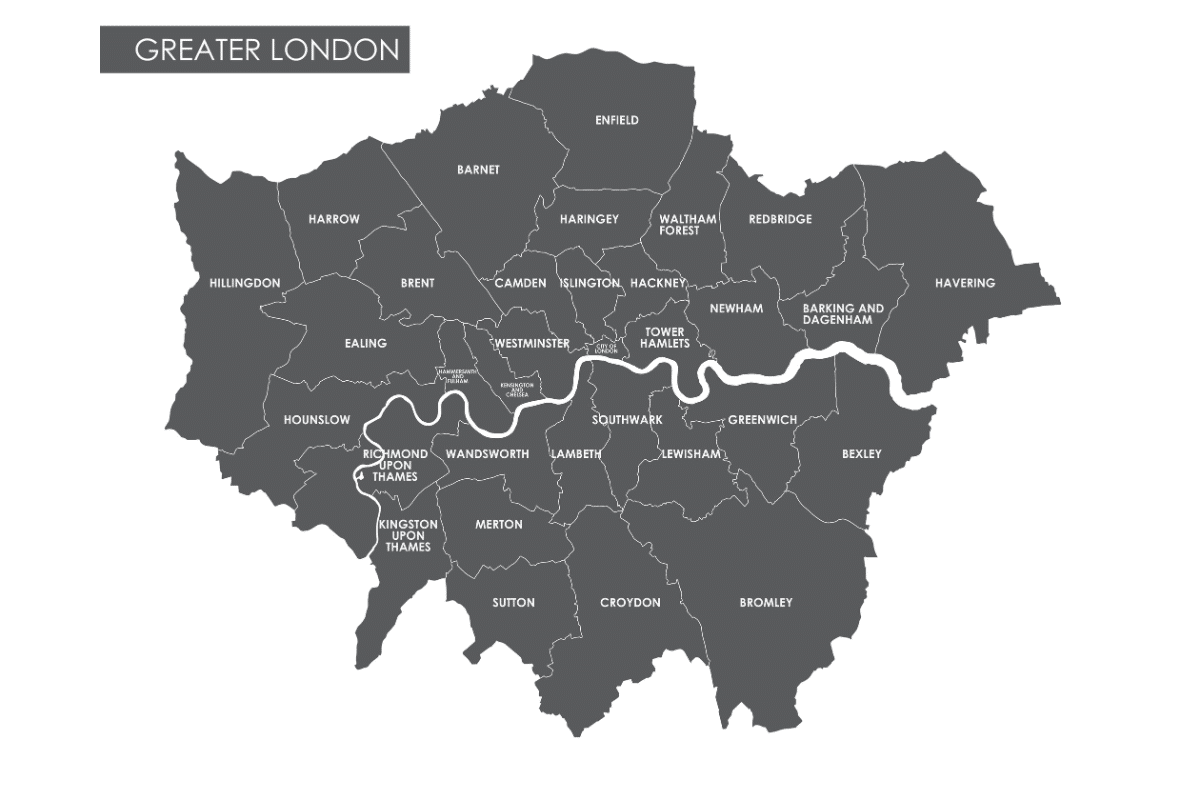
South London is a diverse region, stretching from the bustling banks of the Thames to the leafy suburbs of Bromley. This part of London offers a wide range of options for landlords, homeowners and speculative investors looking at property investment tips that position South London as both an option for current demand and the potential for continued growth.
The property landscape in South London is marked by significant variations in average house prices, from £347,148 in SE28 (Thamesmead) to £887,954 in SW11 (Battersea). This diversity extends to rental yields, which range from 3.8% in BR7 (Chislehurst) to an impressive 6.3% in DA18 (Thamesmead). The price per square foot also shows considerable variation, from £412.30 in BR8 (Swanley) to £950.60 in SW11 (Battersea), reflecting the diverse property types and local market conditions across the region.
South London's investment appeal is further enhanced by its varied population densities and property sales rates. Areas like SW9 have high population densities of 41,762 people per square mile, in stark contrast to BR8 at just 2,786 people per square mile. This spectrum caters to different tenant preferences, from bustling urban environments to quieter suburban settings.
Monthly property sales also vary considerably, from as low as 6 in SE28 to as high as 53 in SW19 , indicating diverse levels of market activity. These varied statistics demonstrate South London's capacity to accommodate a range of investment strategies, whether focused on high rental yields in areas like DA18 (Thamesmead) with 6.3%, or on properties in high-demand locations like SW19 (Wimbledon) with 53 sales per month.
This selection of options allows investors to tailor their portfolios to specific goals, be it maximising rental income, targeting capital appreciation, or achieving a balance between the two.

-
by Robert Jones, Founder of Property Investments UK
With two decades in UK property, Rob has been investing in buy-to-let since 2005, and uses property data to develop tools for property market analysis.
Property Data Sources
Our location guide relies on diverse, authoritative datasets including:
- HM Land Registry UK House Price Index
- Ministry of Housing, Communities and Local Government
- Ordnance Survey Data Hub
- Propertydata.co.uk
We update our property data quarterly to ensure accuracy. Last update: September 2024. All data is presented as provided by our sources without adjustments or amendments.
Top Buy-to-Let Hotspots in South London
Bromley
Bromley, known for its green spaces and excellent schools, offers a suburban environment with good connections to central London. Key areas include BR1 (Bromley), the borough's main commercial hub, and BR6 (Orpington), a popular residential area.
BR1 (Bromley) benefits from direct rail links to London Victoria and Blackfriars, while BR6 (Orpington) offers fast services to London Bridge and Charing Cross. The suburban nature of BR2 (Hayes) and BR4 (West Wickham) attracts families looking for larger homes and good schools.
Bromley postcode districts include: BR1, BR2, BR3, BR4, BR5, BR6, BR7, BR8, and SE20.
Discover more about Bromley buy-to-let.
Bromley Property Prices
| Postcode | Average House Price £ | Average £ per sq ft | Average Rental Yield % |
|---|---|---|---|
| BR7 | £713,942 | £601.90 | 3.8% |
| BR6 | £652,837 | £557.60 | 4.0% |
| BR4 | £610,478 | £562.75 | 4.1% |
| BR2 | £584,113 | £536.90 | 4.2% |
| BR1 | £545,672 | £521.80 | 4.3% |
| BR3 | £529,846 | £548.50 | 4.5% |
| BR5 | £428,773 | £428.20 | 4.6% |
| BR8 | £394,582 | £412.30 | 4.7% |
| SE20 | £394,064 | £553.60 | 4.6% |
Bromley Housing Market
| Postcode | Population | Density per square mile | Average Property Sales per Month |
|---|---|---|---|
| BR1 | 55,931 | 12,245 | 22 |
| BR3 | 47,349 | 9,901 | 20 |
| BR6 | 46,065 | 3,174 | 15 |
| BR5 | 45,923 | 9,054 | 17 |
| BR2 | 44,903 | 5,563 | 18 |
| SE20 | 22,821 | 22,881 | 14 |
| BR8 | 22,044 | 2,786 | 8 |
| BR4 | 19,349 | 5,118 | 11 |
| BR7 | 17,322 | 4,437 | 9 |
Croydon
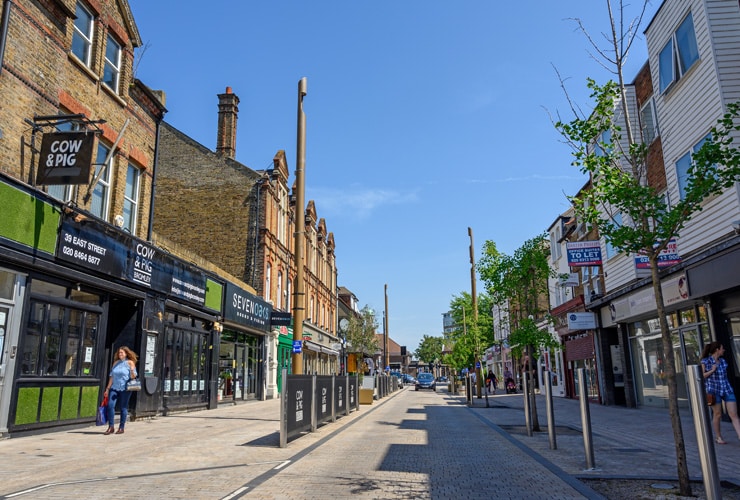
Croydon, a diverse South London borough, offers varied investment opportunities across its postcode districts. In CR0, East Croydon station's 15-minute connection to London Bridge attracts young professionals to new developments like Ruskin Square and Saffron Square. CR2's leafy streets, home to Whitgift and Trinity schools, appeal to families seeking larger properties. CR7's Thornton Heath, with its Victorian terraces and proximity to Selhurst Park stadium, offers more affordable options and potential for higher yields.
CR8 Purley, known for its 1920s and 1930s detached houses, attracts long-term family tenants with its good schools and 23-minute train ride to London Bridge. CR5 Coulsdon, bordering green belt land, offers a mix of period and modern homes, while CR3 Kenley is popular for it's direct trains to Victoria.
Croydon postcode districts include: CR0, CR2, CR3, CR5, CR6, CR7, CR8, SE19, and SE25.
Discover more about Croydon buy-to-let.
Croydon Property Prices
| Postcode | Average House Price £ | Average £ per sq ft | Average Rental Yield % |
|---|---|---|---|
| CR8 | £615,428 | £524.10 | 3.9% |
| CR6 | £563,782 | £453.60 | 4.1% |
| CR5 | £520,462 | £489.20 | 4.5% |
| CR2 | £485,912 | £477.60 | 4.7% |
| CR3 | £468,182 | £439.50 | 4.8% |
| SE19 | £465,066 | £583.15 | 4.5% |
| CR0 | £386,572 | £469.80 | 5.2% |
| CR7 | £382,950 | £455.90 | 5.3% |
| SE25 | £379,298 | £486.45 | 5.1% |
Croydon Housing Market
| Postcode | Population | Density per square mile | Average Property Sales per Month |
|---|---|---|---|
| CR0 | 153,954 | 13,094 | 48 |
| CR2 | 48,320 | 7,694 | 19 |
| CR7 | 44,620 | 26,378 | 17 |
| SE25 | 34,574 | 19,840 | 23 |
| CR8 | 32,301 | 6,422 | 15 |
| CR5 | 28,761 | 3,352 | 14 |
| CR3 | 28,756 | 2,616 | 12 |
| SE19 | 27,638 | 16,238 | 20 |
| CR6 | 9,960 | 1,257 | 6 |
Kingston upon Thames
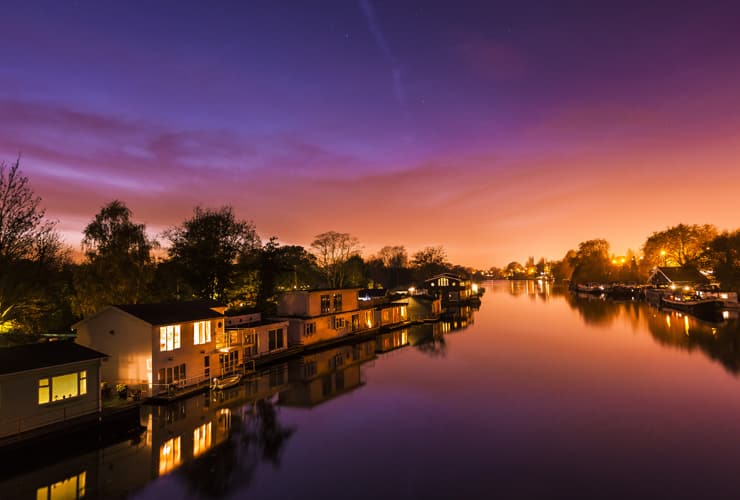
Kingston upon Thames, a riverside borough in southwest London, offers diverse investment opportunities across its postcode districts. KT1, home to the town centre and Kingston University, attracts students and young professionals with its bustling high street and 30-minute train ride to Waterloo. KT2 Kingston Hill, with its mix of Victorian villas and 1930s houses, appeals to families due to proximity to Richmond Park and well-regarded schools like Kingston Grammar.
KT5 Berrylands, a quieter residential area, offers more affordable options with its 1930s semi-detached houses, while still benefiting from a 25-minute train journey to Waterloo. KT6 Surbiton, known for its Art Deco architecture and fast 17-minute train to Waterloo, is popular among commuters.
Kingston upon Thames postcode districts include: KT1, KT2, KT3, KT4, KT5, and KT6.
Kingston upon Thames Property Prices
| Postcode | Average House Price £ | Average £ per sq ft | Average Rental Yield % |
|---|---|---|---|
| KT2 | £685,927 | £648.20 | 3.8% |
| KT5 | £594,361 | £582.10 | 3.9% |
| KT1 | £565,284 | £604.90 | 4.0% |
| KT6 | £564,178 | £563.50 | 4.1% |
| KT3 | £543,186 | £556.50 | 4.2% |
| KT4 | £509,872 | £522.70 | 4.3% |
Kingston upon Thames Housing Market
| Postcode | Population | Density per square mile | Average Property Sales per Month |
|---|---|---|---|
| KT3 | 38,066 | 13,216 | 18 |
| KT2 | 31,551 | 13,502 | 13 |
| KT6 | 31,350 | 15,037 | 14 |
| KT4 | 28,687 | 12,504 | 11 |
| KT1 | 21,972 | 14,645 | 15 |
| KT5 | 20,884 | 14,814 | 9 |
Lambeth
Lambeth, a diverse central London borough, offers varied investment opportunities across its postcode districts. The quick tube ride to the City appeals to financial sector workers. SE11 Kennington, known for its Georgian squares and proximity to the Oval cricket ground, offers a mix of period properties and ex-council flats, popular among young families and professionals. SW9 and SW2 Brixton, with its vibrant multicultural atmosphere, famous market, and Victoria line connection (12 minutes to Oxford Circus), appeals to a trendy, younger demographic.
SW8 South Lambeth encompasses the Nine Elms regeneration area and Battersea Power Station development, offering high-end investment opportunities. SW16 Streatham, with its mix of Victorian and Edwardian houses, provides more affordable options and potential for higher yields, benefiting from direct trains to London Bridge and Victoria (around 20 minutes). SE27 West Norwood, an up-and-coming area, offers period properties and new developments like The Paperworks, with a 20-minute train ride to London Bridge.
Lambeth postcode districts include: SE11, SE21, SE24, SE27, SW2, SW4, SW8, SW9, and SW16.
Discover more about Lambeth buy-to-let.
Lambeth Property Prices
| Postcode | Average House Price £ | Average £ per sq ft | Average Rental Yield % |
|---|---|---|---|
| SW8 | £822,470 | £928.65 | 4.4% |
| SE24 | £672,163 | £792.85 | 4.0% |
| SE11 | £672,001 | £854.80 | 4.7% |
| SW4 | £639,076 | £811.70 | 4.9% |
| SW2 | £541,045 | £674.90 | 5.0% |
| SE27 | £540,217 | £625.15 | 4.2% |
| SE21 | £539,863 | £700.55 | 5.4% |
| SW9 | £532,763 | £732.20 | 5.3% |
| SW16 | £490,339 | £569.80 | 4.9% |
Lambeth Housing Market
| Postcode | Population | Density per square mile | Average Property Sales per Month |
|---|---|---|---|
| SW16 | 81,538 | 22,787 | 39 |
| SW2 | 54,188 | 36,763 | 29 |
| SW9 | 41,998 | 41,762 | 11 |
| SW4 | 39,667 | 27,511 | 21 |
| SW8 | 35,120 | 33,648 | 19 |
| SE11 | 21,589 | 33,051 | 11 |
| SE27 | 21,381 | 24,814 | 12 |
| SE24 | 18,744 | 18,473 | 12 |
| SE21 | 15,257 | 8,634 | 7 |
Merton
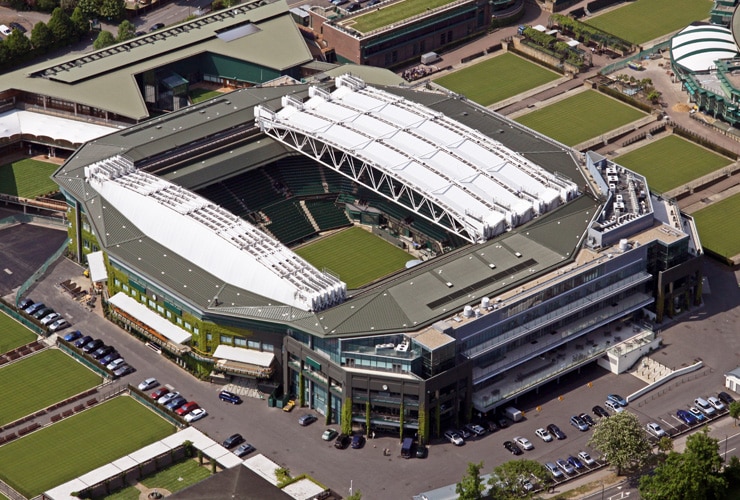
Merton, a southwest London borough, offers diverse investment opportunities across its postcode districts. SW19 Wimbledon, famous for its tennis championships, attracts a mix of professionals and families. The Village area, with its period properties and boutique shops, appeals to high-end renters, while the town centre offers more affordable options near the District line station (17 minutes to Earl's Court).
SW20 Raynes Park, with its mix of Edwardian and inter-war semi-detached houses, attracts families and commuters with its quick 21-minute train ride to Waterloo. SM4 Morden, at the southern end of the Northern line, provides more budget-friendly options with its 1930s semi-detached houses. Its 30-minute tube ride to London Bridge appeals to cost-conscious commuters.
Merton postcode districts include: SM4, SW17, SW19, and SW20.
Discover more about Merton buy-to-let.
Merton Property Prices
| Postcode | Average House Price £ | Average £ per sq ft | Average Rental Yield % |
|---|---|---|---|
| SW20 | £717,614 | £706.30 | 4.6% |
| SW19 | £695,281 | £754.00 | 4.1% |
| SW17 | £620,203 | £736.95 | 4.6% |
| SM4 | £506,665 | £556.70 | 4.4% |
Merton Housing Market
| Postcode | Population | Density per square mile | Average Property Sales per Month |
|---|---|---|---|
| SW19 | 77,441 | 13,839 | 53 |
| SW17 | 64,566 | 27,655 | 33 |
| SM4 | 36,292 | 15,553 | 18 |
| SW20 | 28,398 | 13,505 | 17 |
Southwark
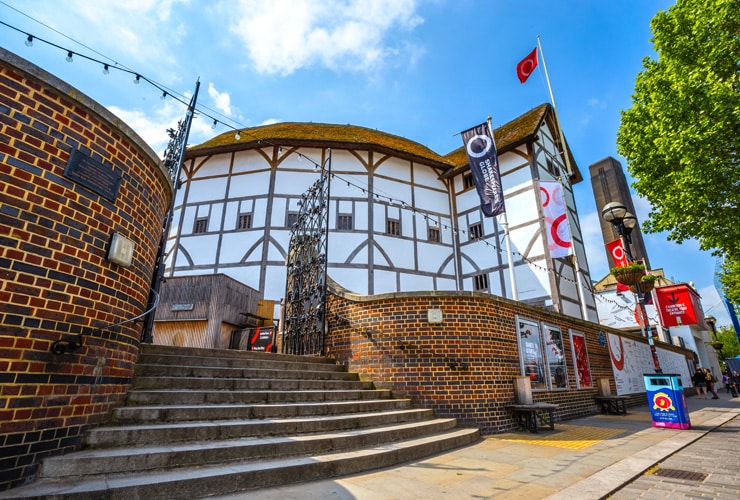
SE1, encompassing London Bridge and Bankside, is a prime area with iconic developments like The Shard and One Blackfriars. Its proximity to the City (London Bridge to Bank in 2 minutes by tube) attracts financial sector professionals. SE16 includes the regenerated Rotherhithe and Canada Water, where the £3.3 billion Canada Water Masterplan is creating a new town centre. The Jubilee line connection (Canada Water to Canary Wharf in 2 minutes) appeals to Docklands workers. SE17 Elephant and Castle is undergoing a £3 billion regeneration, including the Elephant Park development, offering potential for capital growth with its Zone 1 location and quick links to the West End.
SE22 East Dulwich, known for its Victorian and Edwardian houses, attracts families with its village-like atmosphere and proximity to Dulwich Park. Its rail connection to London Bridge (14 minutes) appeals to city workers seeking a quieter home life. SE5 Camberwell, home to Camberwell College of Arts, offers a mix of Georgian houses and new developments like Camberwell on the Green, attracting a creative crowd and young professionals. SE15 Peckham, with its trendy reputation and multicultural vibe, provides more affordable options and potential for higher yields. The recent arrival of the Overground (Peckham Rye to Shoreditch High Street in 15 minutes) has boosted its appeal to young renters
Southwark postcode districts include: SE1, SE5, SE16, SE17, and SE22.
Southwark Property Prices
| Postcode | Average House Price £ | Average £ per sq ft | Average Rental Yield % |
|---|---|---|---|
| SE1 | £769,837 | £929.00 | 4.4% |
| SE22 | £632,399 | £758.85 | 4.3% |
| SE17 | £551,711 | £749.10 | 5.9% |
| SE16 | £514,315 | £697.85 | 5.6% |
| SE5 | £505,348 | £671.50 | 5.2% |
Southwark Housing Market
| Postcode | Population | Density per square mile | Average Property Sales per Month |
|---|---|---|---|
| SE1 | 66,767 | 31,600 | 31 |
| SE5 | 46,443 | 31,200 | 20 |
| SE16 | 45,919 | 32,163 | 18 |
| SE17 | 31,461 | 48,700 | 11 |
| SE22 | 29,684 | 26,738 | 18 |
Sutton
SM1, the town centre, has undergone significant regeneration, including the development of Sutton Point, a mixed-use scheme near the station, appealing to young professionals with its 30-minute train ride to Victoria.
SM2 Cheam, known for its historic village and period properties, attracts families with its good schools and its quieter atmosphere and direct trains to Victoria (35 minutes) and London Bridge (40 minutes) appeal to commuters seeking a suburban lifestyle.
SM3 Worcester Park offers a mix of 1930s semi-detached houses, popular among families and professionals. Its 25-minute train journey to Waterloo makes it attractive for city workers. SM5 Carshalton, with its conservation areas and historic ponds, provides a range of properties from Victorian terraces to modern apartments.
SM7 Banstead, bordering green belt land, attracts families with its larger properties and boosted by Sutton's status as London's first low-carbon borough and its ongoing sustainability initiatives.
Sutton postcode districts include: SM1, SM2, SM3, SM5, SM6, and SM7.
Sutton Property Prices
| Postcode | Average House Price £ | Average £ per sq ft | Average Rental Yield % |
|---|---|---|---|
| SM7 | £652,304 | £532.60 | 3.9% |
| SM3 | £535,370 | £544.35 | 4.6% |
| SM5 | £482,682 | £523.90 | 4.2% |
| SM1 | £440,302 | £515.65 | 4.6% |
| SM6 | £434,701 | £482.55 | 4.6% |
| SM2 | £430,025 | £500.60 | 4.7% |
Sutton Housing Market
| Postcode | Population | Density per square mile | Average Property Sales per Month |
|---|---|---|---|
| SM1 | 38,266 | 19,369 | 23 |
| SM5 | 37,954 | 9,491 | 17 |
| SM6 | 36,204 | 13,995 | 18 |
| SM2 | 28,243 | 10,302 | 17 |
| SM3 | 21,072 | 14,471 | 9 |
| SM7 | 18,502 | 4,129 | 9 |
Wandsworth
Wandsworth, a riverside borough in southwest London. SW11 Battersea has seen significant transformation with the £9 billion redevelopment of Battersea Power Station, creating a new riverside quarter with high-end apartments and commercial spaces. SW18 Wandsworth Town, centred around the historic Ram Brewery site's £600 million redevelopment, offers a mix of period properties and new-build apartments.
SW15 Putney, known for its starting point of the Oxford-Cambridge Boat Race, attracts a mix of young professionals and families with its riverside setting and green spaces like Putney Heath. The area offers a range of properties from Victorian terraces to modern riverside developments like Putney Wharf, with East Putney tube station providing direct access to the District Line. SW17 Tooting has gained popularity among young renters for its affordability and vibrant atmosphere, centred around Tooting Market and Tooting Bec Common. The Northern Line connection at Tooting Broadway (30 minutes to Bank) makes it attractive for city workers. SW12 Balham, with its mix of Victorian and Edwardian houses, appeals to young families and professionals, offering both Northern Line and overground connections to central London.
Wandsworth postcode districts include: SW11, SW12, SW15, and SW18.
Discover more about Wandsworth buy-to-let.
Wandsworth Property Prices
| Postcode | Average House Price £ | Average £ per sq ft | Average Rental Yield % |
|---|---|---|---|
| SW11 | £887,954 | £950.60 | 4.8% |
| SW12 | £719,579 | £834.20 | 4.2% |
| SW18 | £664,256 | £798.50 | 4.8% |
| SW15 | £624,148 | £740.90 | 4.8% |
Wandsworth Housing Market
| Postcode | Population | Density per square mile | Average Property Sales per Month |
|---|---|---|---|
| SW11 | 70,155 | 32,329 | 52 |
| SW15 | 60,344 | 16,850 | 35 |
| SW18 | 59,806 | 24,772 | 43 |
| SW12 | 31,261 | 28,238 | 22 |
Conclusion
South London's buy-to-let market presents a diverse landscape of opportunities, with each borough offering unique characteristics for buy-to-let investors. The region's property prices span a wide range, from £299,690 in DA18 (Thamesmead) to £887,954 in SW11 (Battersea), catering to various investment budgets. This price variation is complemented by a spectrum of rental yields, from 3.8% in BR7 (Chislehurst) to 6.3% in DA18 (Thamesmead) which compare favourably to the wider Greater London rental yields. For instance, an investor purchasing a property in DA18 at the average price of £299,690 could potentially generate an annual gross rental income of approximately £18,880 before expenses, based on the area's 6.3% yield.
The investment potential across South London is further highlighted by the varied population densities and property sales rates. The region has some of the most affordable postcodes in London and impressive recent house price growth statistics.
For landlords seeking high tenant demand, SW9 (Stockwell) in Lambeth boasts the highest population density at 41,762 people per square mile, suggesting a high demand for rental properties. Property sales activity also varies significantly, with SW19 (Wimbledon) in Merton showing the highest average monthly sales at 53, indicating a liquid market where investors might find it easier to buy or sell properties and find available buy-to-let investment opportunities.
The data presents a clear picture of a market where investors can tailor their strategies to specific goals, whether prioritising rental income in areas like DA18 or focusing on potential long-term value growth in premium locations like SW11.
The next step on the property checklist for landlords is to see which rental strategy they prefer for the region, with demand from tenants for every type of housing including Houses of Multiple Occupation, Purpose Built Student Accomodation and even short term rentals.
To get a comprehensive view of London's buy-to-let market, be sure to explore our companion guides on North London, East London, and West London investment opportunities, which offer insights into the unique characteristics and potential of each region.
