Where to Buy Property Investments in Bangor: Yields of 4.3%
Bangor is a university city in Gwynedd, North Wales, positioned between Snowdonia and the Menai Strait. Its top gross rental yield reaches 4.3% in LL57, where average asking prices sit at £252,837. Gwynedd sold prices are 32.8% below the England average at £196,260. The 2021 Census recorded a population of 117,393 across Gwynedd, down 3.7% from 2011.
LL57 posted 13.6% asking price growth over the past 12 months, with five-year growth at 18.0%. This is a compact two-postcode market shaped by Bangor University, which anchors tenant demand in the city centre. LL59 covers Menai Bridge and Beaumaris on the fringes of Anglesey and has no published rental or yield data. That leaves LL57 as the only postcode with a measurable buy-to-let profile for your analysis.
Bangor sits within the Gwynedd local authority (ONS code W04000046) on the North Wales coast between Snowdonia and the Menai Strait. This guide analyses property data across both Bangor postcodes and compares the city to Cardiff, Swansea, Newport, and Wrexham elsewhere in Wales. The full range of buy-to-let property data for Bangor is below, from sold prices and rental yields to deposit requirements and price-to-earnings ratios.
Article updated: April 2026
Bangor Buy-to-Let Market Overview 2026
Bangor is a compact two-postcode market in Gwynedd where university-driven rental demand concentrates in LL57, with entry prices 32.8% below the England average.
- Average sold price: £196,260 (32.8% below England's £291,865)
- Asking price range: £252,837 (LL57) to £299,340 (LL59)
- Rental yields: 4.3% in LL57 (rental data available for 1 of 2 postcodes)
- Rental income: £899 per month in LL57 (1 of 2 postcodes with rental data)
- Price per sq ft: House prices from £201/sq ft (LL57) to £274/sq ft (LL59)
- Market activity: Sales ranging from 5 per month (LL59) to 16 per month (LL57)
- Deposit requirements: 30% deposits range from £75,851 (LL57) to £89,802 (LL59)
- Affordability ratios: Property prices from 7.3 to 8.6 times Bangor's median annual salary of £34,798
Contents

-
by Robert Jones, Founder of Property Investments UK
With two decades in UK property, Rob has been investing in buy-to-let since 2005, and uses property data to develop tools for property market analysis.

Property Data Sources
Our location guide relies on diverse, authoritative datasets including:
- HM Land Registry UK House Price Index
- Ministry of Housing, Communities and Local Government
- Ordnance Survey Data Hub
- Propertydata.co.uk
We update our property data quarterly to ensure accuracy. Last update: April 2026. All data is presented as provided by our sources without adjustments or amendments.
Why Invest in Bangor?
Gwynedd's population fell by 3.7% between the 2011 and 2021 Census, from 121,874 to 117,393. That decline sits against a backdrop of Wales-wide population growth of 1.4% over the same period. Bangor itself is the largest settlement in Gwynedd, a university city of roughly 18,000 people at the northern tip of the county.
Bangor University, founded in 1884, is one of the city's two major employers alongside Ysbyty Gwynedd hospital. The university brings a rotating student population that sustains rental demand in the LL57 postcode, while the hospital provides stable public-sector employment. Tourism, retail, and public administration account for much of the remaining local economy.
The local employment rate is 72.0%, with unemployment at 6.3%. The median gross weekly salary for Gwynedd residents is £669.20, below the Wales median of £719.30 and the Great Britain median of £766.60. That translates to an annual salary of £34,798.
Bangor Economic Summary
- Population: 117,393 (2021 Census). Decline of 3.7% from 2011.
- Median annual salary: £34,798 (local), £37,404 (Wales), £39,863 (Great Britain)
- Employment rate: 72.0%
- Unemployment rate: 6.3%
- Key employment sectors: Education (Bangor University), Healthcare (Ysbyty Gwynedd), Public administration, Tourism, Retail
Source: ONS Census 2021, Nomis Labour Market Profile (ASHE 2025, Employment Oct 2024-Sep 2025)
Regeneration and Investment in Bangor
Over £32 million of public investment is committed or delivered across three Bangor projects, targeting High Street vacancy and healthcare consolidation. These span active delivery, planning approval, and a completed conversion.
- £2.25M High Street Regeneration / BEPI (Active, £2.25 million): The Bangor Empty Property Initiative pilot scheme provides grants of up to £200,000 to High Street property owners for mixed-use refurbishment, combining ground-floor commercial units with apartments above. Funded by Welsh Government's Transforming Towns programme, Cyngor Gwynedd's Town Centre Loans Fund, and private sector contributions, the scheme targets the vacant units that have accumulated since the pandemic. Updates at Cyngor Gwynedd.
- £30M Health and Wellbeing Hub (Planning, £30 million): Betsi Cadwaladr University Health Board, Cyngor Gwynedd, and Welsh Government plan to consolidate community health and social care services in the Menai Centre on Bangor High Street. The first-stage business case has been submitted to Welsh Government for detailed design approval. Updates at Betsi Cadwaladr University Health Board.
- Tŷ Cyfle Community Learning Centre (Complete, opened March 2025): Grŵp Llandrillo Menai transformed the former Topshop building into a community learning hub with four classrooms offering free courses in employability, computing, and ESOL. Funded through Welsh Government's Sustainable Communities for Learning Programme and Transforming Towns, the conversion replaces a long-vacant retail unit with daily footfall. Updates at Grŵp Llandrillo Menai.

Bangor Property Market Analysis
When was the last house price crash in Bangor?
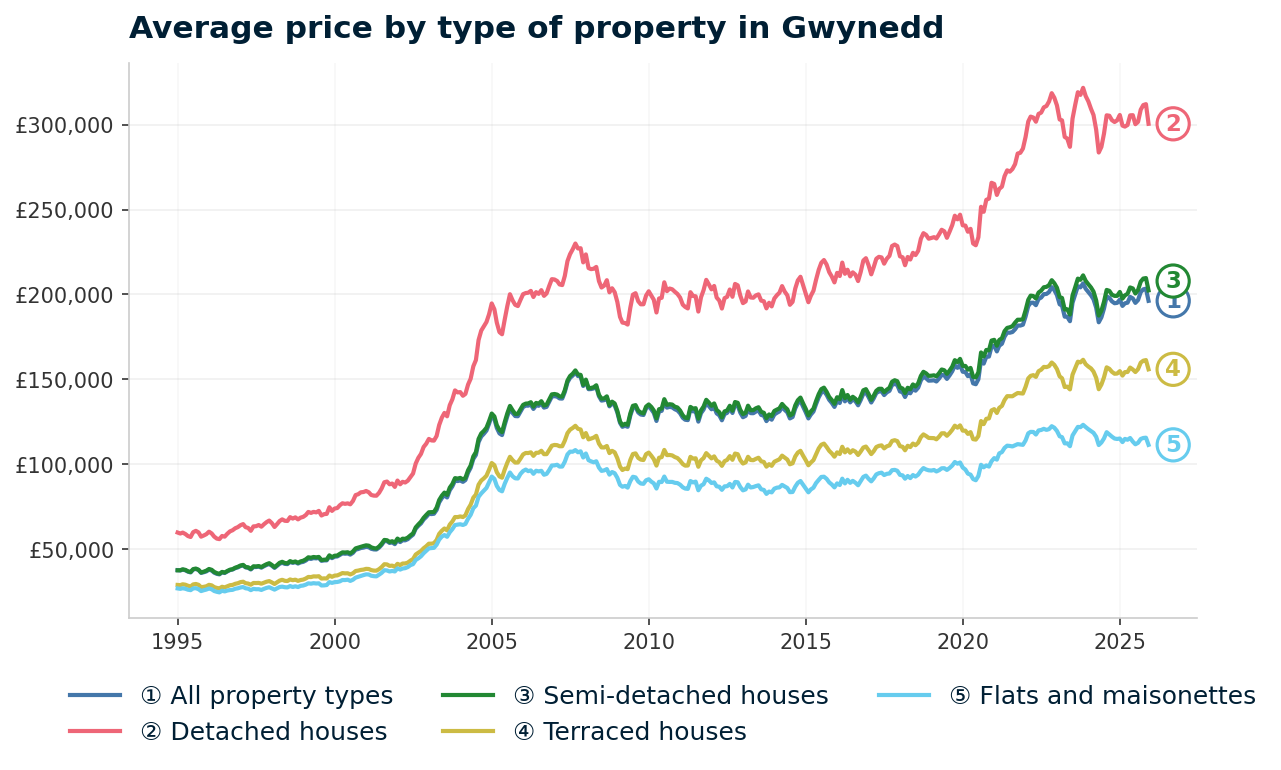
Gwynedd property prices peaked at £154,168 in September 2007 and fell 20.8% to £122,155 by March 2009. Bangor sits within the Gwynedd local authority, so all sold property data from HM Land Registry is recorded at county level.
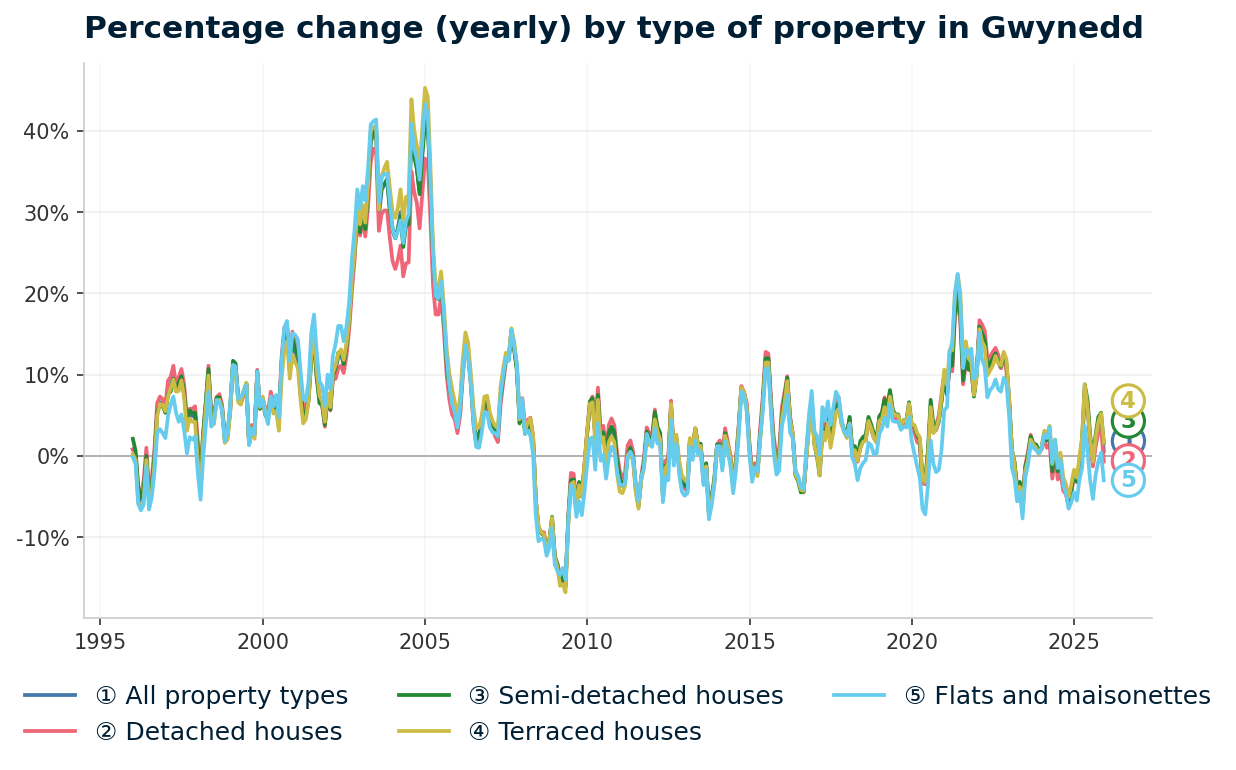
The worst single annual change reading hit -16.2% in May 2009. For context, Wales as a whole declined 18.1% from its August 2007 peak, and England fell 18.2% from its September 2007 peak. Gwynedd's crash was steeper than both national benchmarks.
Here is the full cycle-by-cycle breakdown of Gwynedd house prices since HM Land Registry records began:
- 1995-2007 (The Boom): Gwynedd house prices started at £37,786 in January 1995 and rose steadily through the early 2000s, passing £51,063 by December 2000. Growth accelerated in the mid-2000s, with annual increases above 15% in 2007, reaching the pre-crash peak of £154,168 in September 2007. Prices quadrupled in twelve years.
- 2008-2009 (The Financial Crisis): From the September 2007 peak of £154,168, prices fell 20.8% to a trough of £122,155 in March 2009. The worst annual change reading was -16.2% in May 2009. Wales fell 18.1% from peak to trough over the same period. England declined 18.2%.
- 2010-2013 (Stagnation): Prices drifted sideways in the low £120,000s to mid £120,000s. By December 2013, the average sat at £126,324 with an annual change of -3.2%, still showing occasional year-on-year declines four years after the trough.
Gwynedd took 12 years to recover the 2007 peak, one of the longest recoveries in Wales.
- 2014-2016 (Turning Point): Growth returned in 2014, with December 2014 at £134,027 (+6.1%). By December 2016, prices had reached £142,371 (+6.4%), but remained £12,000 below the 2007 peak.
- 2017-2019 (Pre-pandemic recovery): Steady growth continued. Gwynedd prices finally passed the pre-crash peak in September 2019 at £154,835, twelve years after the 2007 high. By December 2019, prices had reached £158,598.
- 2020-2022 (Pandemic surge): The stamp duty holiday and demand for rural and coastal property drove sharp gains. December 2020 reached £169,319 (+6.8%), December 2021 hit £182,224 (+7.6%), and December 2022 peaked at £202,612 (+11.2%). Gwynedd prices rose 27.8% in three years.
- 2023 (Rate shock): Growth stalled. December 2023 recorded £203,367, an annual change of just +0.4%.
- 2024-2025 (Correction and stabilisation): December 2024 dropped to £195,072 (-4.1%), giving back some of the pandemic gains. By December 2025, prices had edged up to £196,260 (+0.6%), stabilising but remaining below the 2022-2023 highs.
Long-term growth summary for Gwynedd:
- 5 years (2020-2025): +15.9% (£169,319 to £196,260)
- 10 years (2015-2025): +46.6% (£133,849 to £196,260)
- 15 years (2010-2025): +48.9% (£131,803 to £196,260)
- 20 years (2005-2025): +49.8% (£131,023 to £196,260)
- 30 years (1995-2025): +429.4% (£37,069 to £196,260)
Low transaction volumes and a rural housing market meant prices took significantly longer to rebuild than in cities like Cardiff or Swansea. The 2020-2022 pandemic surge finally pushed prices well past the old peak, but the 2024 correction shows this market remains sensitive to rate changes.
Source: HM Land Registry House Price Index for Gwynedd, January 1995 to December 2025.
Thinking of Buying?
We have off-market investment properties averaging 8%+ annual yield.
View Property DealsSold House Prices in Bangor
The average sold price across all property types in Gwynedd is £196,260, which is 32.8% below the England average of £291,865. Every property type in Gwynedd sells for less than the England average. The discount ranges from 30.0% for semi-detached houses to 49.2% for flats and maisonettes.
| Property Type | Gwynedd Average | England Average | Difference |
|---|---|---|---|
| Detached houses | £300,420 | £471,667 | -36.3% |
| Semi-detached houses | £202,394 | £289,135 | -30.0% |
| Terraced houses | £155,962 | £244,830 | -36.3% |
| Flats and maisonettes | £111,526 | £219,340 | -49.2% |
| All property types | £196,260 | £291,865 | -32.8% |
Detached houses in Gwynedd average £300,420, a 36.3% discount to England's £471,667. Detached properties dominate the Gwynedd housing stock, particularly in rural areas outside Bangor, which pulls the county average down relative to England where terraced and flat-heavy cities inflate the national figure.
Semi-detached houses show the smallest gap at 30.0%, with Gwynedd averaging £202,394 versus England's £289,135. This reflects strong demand for family-sized homes in Bangor and the surrounding towns where semis are the most common type for owner-occupiers and landlords alike.
Terraced houses average £155,962, a 36.3% discount matching detached properties. Victorian and Edwardian terraces in central Bangor and the surrounding quarrying villages form the core of the lower-value stock in Gwynedd.
Flats and maisonettes show the deepest discount at 49.2%, with Gwynedd averaging £111,526 against England's £219,340. Gwynedd has a limited flat stock compared to English cities. The flats that do exist tend to be smaller conversions in Bangor and coastal towns, priced well below the England average where London and the South East pull the national figure higher.
Property Data Sources
Our location guide relies on diverse, authoritative datasets including:
- HM Land Registry UK House Price Index
- Ministry of Housing, Communities and Local Government
- Ordnance Survey Data Hub
- Propertydata.co.uk
We update our property data quarterly to ensure accuracy. Last update: April 2026. All data is presented as provided by our sources without adjustments or amendments.
Price Per Square Foot in Bangor
How far does your money go in Bangor? LL57 records £201 per square foot based on 302 transactions, while LL59 sits 36.3% higher at £274.
LL57 draws on 302 transactions over the measurement period. LL59 uses a smaller sample of 83 transactions, reflecting lower sales volumes in the Menai Bridge and Beaumaris area.
| Rank | Area | Price per sq ft |
|---|---|---|
| 1 | LL57 (Bangor City Centre) | £201 |
| 2 | LL59 (Menai Bridge, Beaumaris) | £274 |
The £73 per square foot gap between LL57 and LL59 reflects the different character of each postcode. LL57 is the university city centre with a mix of terraces, student conversions, and older stock. LL59 covers the Menai Bridge area and the Beaumaris end of Anglesey, where larger detached coastal properties command premium prices per square foot. An investor buying a 600 sq ft flat in LL57 would pay roughly £120,600 based on the average price per square foot, compared to £164,400 for the same size in LL59.
Houses for Sale in Bangor, North Wales: Asking Prices
Average asking prices in Bangor range from £252,837 in LL57 to £299,340 in LL59. The mean asking price across both postcodes is £276,089. Both postcodes sit above the Gwynedd Land Registry average of £196,260, which reflects the wider county including lower-priced rural areas outside Bangor.
| Rank | Area | Asking Price |
|---|---|---|
| 1 | LL57 (Bangor City Centre) | £252,837 |
| 2 | LL59 (Menai Bridge, Beaumaris) | £299,340 |
LL59's £299,340 asking price is 18.4% above LL57's £252,837. The gap is driven by Menai Bridge and Beaumaris, which attract lifestyle buyers and second-home purchasers drawn to Anglesey's coastline. LL57 is more accessible for below market value properties, with a higher proportion of terraces and smaller units priced below the postcode average.

House Price Growth in Bangor
Two postcodes, two directions. LL57 has returned 18.0% growth over five years, accelerating to 13.6% in the most recent 12 months. LL59 has declined 3.7% over five years, with a 9.5% drop in the past year alone.
| Area | 1 Year | 3 Years | 5 Years |
|---|---|---|---|
| LL57 (Bangor City Centre) | 13.6% | 13.1% | 18.0% |
| LL59 (Menai Bridge, Beaumaris) | -9.5% | -14.0% | -3.7% |
LL57's 13.6% one-year growth stands out in a market where Gwynedd's Land Registry average grew just 0.6% over the same period. The university city centre has seen sustained demand, particularly for affordable terraces and semis that appeal to both buy-to-let investors and first-time buyers. LL57's 16 sales per month give it enough transaction volume for the growth figures to be meaningful.
LL59's negative growth across all three time horizons reflects the constraints of a low-volume, premium market. At just 5 sales per month, individual high-value or low-value transactions can swing the average significantly. The -14.0% three-year figure covers the period of sharpest rate rises, which hit discretionary purchasers in coastal and lifestyle locations harder than city-centre markets.
Monthly Property Sales in Bangor
LL57 records 16 property sales per month with a 10% turnover rate, compared to LL59's 5 sales per month and 6% turnover. The combined total of 21 sales per month across both postcodes makes Bangor a low-volume market by UK standards.
| Area | Sales per month | Turnover | Asking Price |
|---|---|---|---|
| LL57 (Bangor City Centre) | 16 | 10% | £252,837 |
| LL59 (Menai Bridge, Beaumaris) | 5 | 6% | £299,340 |
LL57's 10% turnover rate means roughly one in ten properties changes hands each year. That is consistent with an active rental and resale market, where student lets, young professionals, and owner-occupiers create regular stock movement. LL59's 6% turnover reflects a more settled ownership pattern in Menai Bridge and Beaumaris, where many properties are second homes or long-term owner-occupied.
If you're buying in a low-volume market, expect longer transaction times. Individual sales carry more weight in average price calculations. The growth and price data for LL59 in particular should be read alongside its 5-sales-per-month baseline.
Property Data Sources
Our location guide relies on diverse, authoritative datasets including:
- HM Land Registry UK House Price Index
- Ministry of Housing, Communities and Local Government
- Ordnance Survey Data Hub
- Propertydata.co.uk
We update our property data quarterly to ensure accuracy. Last update: April 2026. All data is presented as provided by our sources without adjustments or amendments.

Bangor Rental Market Analysis
For investors weighing up whether rental property is a worthwhile investment in Bangor, the data below breaks down average monthly rents and gross rental yields across the city's postcodes.
Rental data is available for 1 of Bangor's 2 postcodes. LL57 (Bangor City Centre) returns an average monthly rent of £899 and a gross yield of 4.3%. LL59 (Menai Bridge, Beaumaris) has no published rental data. For those looking to build a property portfolio in Wales, Bangor's university-driven demand creates a rental market concentrated around the city centre.
Average Rent & Gross Rental Yields in Bangor
LL57 (Bangor City Centre) returns a gross rental yield of 4.3% on an average monthly rent of £899 and an asking price of £252,837. LL59 has no published rental or yield data. This means Bangor's entire measurable buy-to-let profile rests on a single postcode.
| Area | Average Monthly Rent | Asking Price | Gross Yield |
|---|---|---|---|
| LL57 (Bangor City Centre) | £899 | £252,837 | 4.3% |
| LL59 (Menai Bridge, Beaumaris) | Not enough data | £299,340 | Not enough data |
LL57's 4.3% yield reflects the balance between Bangor's relatively affordable asking prices and a modest rental income. At £899 per month, rents in LL57 are lower than in larger Welsh cities such as Cardiff (averaging £1,223) and Swansea (£1,233), but the lower entry price keeps the yield competitive with the national average. Bangor University's student intake provides a recurring tenant base, particularly for houses in multiple occupation and shared lets near the campus.
LL59's missing rental data is consistent with its profile as a low-volume, owner-occupier and second-home market. Menai Bridge and Beaumaris properties tend to be larger detached homes that are less commonly let on the open market.
Is Bangor Rent High?
Rent as a percentage of gross monthly income measures how much of a tenant's salary goes toward housing costs. In LL57, average rent of £899 per month represents 31.0% of the local median gross monthly salary of £2,900. LL59 has no rental data.
The median gross weekly salary in Bangor is £669.20, which equates to £2,900 per month or £34,798 per year. This is below the Wales regional median of £719.30 per week and the Great Britain median of £766.60 per week. Data from the Nomis Labour Market Profile (ASHE 2025).
| Rank | Area | Rent as % of Income |
|---|---|---|
| 1 | LL57 (Bangor City Centre) | 31.0% |
| — | LL59 (Menai Bridge, Beaumaris) | Not enough data |
LL57's 31.0% rent-to-income ratio places Bangor in line with the conventional 30% affordability benchmark. Tenants in LL57 are spending roughly a third of gross income on rent, which is typical for a UK university city. The lower local salary (£34,798 versus the Great Britain median of £39,863) is the main driver. Rents do not need to be high in absolute terms to absorb a significant share of income when earnings are below the national median.
Thinking of Buying?
We have off-market investment properties averaging 8%+ annual yield.
View Property DealsBuy-to-Let Considerations
Are House Prices High? Price-to-Earnings Ratios
Purchasing a property in Bangor requires between 7.3 and 8.6 times the median annual salary. This is based on the Nomis Labour Market Profile for Gwynedd showing the median gross annual income for Gwynedd residents is £34,798.
The national benchmark price-to-earnings ratio (England average sold price divided by the Great Britain median salary) is 7.3x. The Wales benchmark (Wales average sold price divided by Wales median salary) is 5.7x.
| Rank | Area | Price-to-Earnings Ratio |
|---|---|---|
| 1 | LL57 (Bangor City Centre) | 7.3x |
| 2 | LL59 (Menai Bridge, Beaumaris) | 8.6x |
LL57's 7.3x ratio matches the national benchmark exactly. Property in the Bangor city centre is priced in line with typical UK affordability levels when measured against local earnings. LL59 at 8.6x sits above both the national and Wales benchmarks, reflecting the premium positioning of Menai Bridge and Beaumaris where property prices are driven by lifestyle demand rather than local salary levels.
Both postcodes sit above the Wales benchmark of 5.7x. Gwynedd's median salary of £34,798 is 7.0% below the Wales median of £37,404, which means properties absorb a larger multiple of local income even when absolute prices are lower than in Cardiff or Swansea.
Deposit Requirements in Bangor
A 30% deposit on an average-priced property in Bangor ranges from £75,851 in LL57 to £89,802 in LL59. That £13,951 gap is the difference between the city centre postcode with all the rental data, and the premium Menai Bridge and Beaumaris postcode with higher capital values but no published yield.
| Rank | Area | 30% Deposit Required |
|---|---|---|
| 1 | LL57 (Bangor City Centre) | £75,851 |
| 2 | LL59 (Menai Bridge, Beaumaris) | £89,802 |
LL57's £75,851 deposit is among the lowest of any city covered in our Welsh location guides. Investors should factor in additional buy-to-let costs including arrangement fees, legal costs, and the higher-rate stamp duty surcharge on second properties in Wales (Land Transaction Tax). These costs add to the total capital required beyond the deposit figure.
What the Bangor Data Tells Buy-to-Let Investors
LL57 (Bangor City Centre) returns a 4.3% gross yield on an asking price of £252,837, with a 30% deposit of £75,851. The university provides a recurring tenant base, and the postcode's 10% turnover rate and 16 monthly sales indicate an active market. Rental demand in LL57 is driven by students, hospital workers, and public-sector employees rather than the corporate relocations that underpin larger city markets.
LL57 has also posted the strongest growth figures: 13.6% over one year and 18.0% over five years. These gains are concentrated in the lower-value stock within the postcode. At £201 per square foot, LL57 is significantly cheaper than LL59's £274. The combination of yield, growth, and lower entry costs in a single postcode is unusual for a two-postcode location. Investors looking for investment property in North Wales will find most of Bangor's measurable buy-to-let data concentrated here.
LL59 (Menai Bridge, Beaumaris) has no published rental or yield data and has returned -9.5% one-year and -3.7% five-year growth. At 5 sales per month, it is a low-liquidity market where average prices are influenced by small numbers of transactions. The 8.6x price-to-earnings ratio and £89,802 deposit place it above both national and Wales affordability benchmarks. This is a lifestyle and second-home market rather than a conventional buy-to-let postcode.
Gwynedd operates under standard council tax rules. Investors should check the current position on second-home premiums with Cyngor Gwynedd, as Welsh local authorities have the power to charge premiums of up to 300% on second homes and long-term empty properties. Landlords with off-market properties in Bangor can list through our network.
How Bangor Compares
Bangor's mean asking price of £276,089 positions it mid-table among Welsh cities, with a top yield of 4.3% that trails the larger urban markets. The comparison below uses mean asking price, mean monthly rent, and the top single-postcode gross yield for each location.
| Location | Mean Asking Price | Mean Monthly Rent | Top Gross Yield |
|---|---|---|---|
| Swansea | £250,854 | £1,233 | 8.8% |
| Wrexham | £259,235 | £780 | 3.9% |
| Newport | £272,487 | £1,037 | 5.5% |
| Bangor | £276,089 | £899 | 4.3% |
| Cardiff | £308,726 | £1,223 | 7.3% |
Bangor's 4.3% top yield exceeds Wrexham's 3.9% but falls below Newport (5.5%), Cardiff (7.3%), and Swansea (8.8%). The gap is partly structural. Cardiff and Swansea are larger cities with more diverse rental markets and multiple high-yielding postcodes. Bangor has one postcode with rental data.
At £899 per month, Bangor's mean rent is the second lowest in this table, above Wrexham's £780. Wrexham's lower asking prices (£259,235) produce a lower yield because the rent-to-price ratio is less favourable. Newport offers a middle ground at £272,487 with a 5.5% top yield and £1,037 monthly rent.
For investors comparing Welsh locations, the data in Bangor's favour is its 13.6% one-year growth and 18.0% five-year growth in LL57, which exceeds most Welsh postcodes. The data against is its single-postcode rental profile and lower absolute rent. A broader view of the best buy to let areas in the UK puts Bangor in context alongside higher-yielding English markets.
Frequently Asked Questions
Is there demand for student accommodation in Bangor?
Bangor University generates recurring student rental demand concentrated in the LL57 postcode. The university is one of the oldest in Wales, and its student population anchors the city's rental market. The university campus sits within walking distance of the city centre, which concentrates student lets in terraced houses and shared accommodation around the High Street and upper Bangor. Seasonal void risk applies: demand is highest from September to June, with reduced occupancy over summer. Investors considering purpose-built student accommodation should note that Bangor's rental market is dominated by converted houses rather than large PBSA developments.
How does Bangor compare to Wrexham for property investment?
Bangor's top gross yield of 4.3% in LL57 exceeds Wrexham's 3.9%. Bangor's mean asking price (£276,089) is higher than Wrexham's (£259,235), but Bangor's mean rent (£899) also exceeds Wrexham's (£780). The key difference is growth: LL57 in Bangor has returned 13.6% one-year growth and 18.0% over five years, driven by university demand. Wrexham is a larger market with more postcodes and higher sales volumes. Both are North Wales cities with different economic profiles: Bangor is university-anchored, Wrexham is more industrially diversified with proximity to the English border.
What are the different areas of Bangor?
Bangor has two postcodes with distinct investment profiles. LL57 (Bangor City Centre) covers the university area, the High Street, and the residential streets climbing the hillside above the Menai Strait. It's the more affordable postcode (£252,837 average asking price, £201 per square foot) with all the published rental data (£899 per month, 4.3% yield).
LL59 covers Menai Bridge and Beaumaris, stretching across the Menai Strait onto Anglesey. This is a premium area (£299,340 average asking price, £274 per square foot) with no published rental data and lower sales volumes of 5 per month. LL57 is the buy-to-let postcode; LL59 is the lifestyle and second-home postcode.
Is Bangor a good place to live?
Bangor sits between Snowdonia and the Menai Strait on the North Wales coast, with direct rail links to Chester. The city has a university, a major hospital (Ysbyty Gwynedd), and a High Street undergoing regeneration with £2.25 million of public investment. Gwynedd's population fell 3.7% between the 2011 and 2021 Census, from 121,874 to 117,393.
The local median salary is £34,798, below the Wales median of £37,404 and the Great Britain median of £39,863. Employment sits at 72.0% with unemployment at 6.3%. Snowdonia National Park and the Anglesey coastline are both accessible from the city, supporting tourism but also contributing to second-home demand in the LL59 postcode.
How much does a house cost in Bangor?
Average asking prices range from £252,837 in LL57 to £299,340 in LL59. Gwynedd's Land Registry average across all property types is £196,260, which is 32.8% below the England average of £291,865. By property type, terraced houses average £155,962 and flats average £111,526 at the Gwynedd level. A 30% deposit on the cheapest postcode (LL57) requires £75,851. Price per square foot ranges from £201 in LL57 to £274 in LL59, based on 302 and 83 transactions respectively.