Where to Buy Property Investments in Swansea: Yields of 8.8%
Swansea's gross rental yields range from 4.1% to 8.8% across postcodes with rental data, with SA1 delivering the highest returns. Average sold prices sit 28.4% below the England average, and the city's population was 238,490 at the 2021 census.
Swansea's average sold price of £208,872 is 2.8% below the Wales national average of £214,883 and 28.4% below England's £291,865. That discount creates entry points from £47,512 at 30% deposit in SA1, the city centre. Rental data is available for 4 of the city's 9 postcodes, with yields spread across a 4.7 percentage point range. For investors looking at buy-to-let property in Wales, Swansea's combination of low prices and high yields in the city centre sits alongside a coastal premium market in the Gower and Mumbles.
This guide covers all 9 Swansea postcodes from SA1 to SA8 plus SA99 under the City and County of Swansea unitary authority (ONS code W06000011). Swansea is the second-largest city in Wales, sitting on the south coast where the River Tawe meets Swansea Bay. Investors comparing options may also consider Cardiff, Newport, or Bristol. Browse all our Wales location guides.
Article updated: April 2026
Swansea Buy-to-Let Market Overview 2026
Swansea offers some of the lowest entry prices in Wales, backed by a £1.3 billion City Deal, strong university demand, and an 8.8% top yield in the city centre.
- Average sold price: £208,872 (28.4% below England's £291,865)
- Asking price range: £158,372 (SA1) to £399,049 (SA3)
- Rental yields: 4.1% (SA3) to 8.8% (SA1) across postcodes with rental data
- Rental income: Monthly rents from £868 (SA5) to £1,537 (SA2)
- Price per sq ft: Sold prices from £161/sq ft (SA1) to £326/sq ft (SA3)
- Market activity: Sales ranging from 9 per month (SA8) to 47 per month (SA4)
- Deposit requirements: 30% deposits range from £47,512 (SA1) to £119,715 (SA3)
- Affordability ratios: Property prices from 4.3 to 10.9 times Swansea's median annual salary of £36,586
Contents

-
by Robert Jones, Founder of Property Investments UK
With two decades in UK property, Rob has been investing in buy-to-let since 2005, and uses property data to develop tools for property market analysis.

Property Data Sources
Our location guide relies on diverse, authoritative datasets including:
- HM Land Registry UK House Price Index
- Ministry of Housing, Communities and Local Government
- Ordnance Survey Data Hub
- Propertydata.co.uk
We update our property data quarterly to ensure accuracy. Last update: April 2026. All data is presented as provided by our sources without adjustments or amendments.
Why Invest in Swansea?
Swansea's two universities bring around 25,000 students to the city each year, and the DVLA headquarters employs around 6,000 people. Those two pillars shape the rental market. Swansea University and the University of Wales Trinity Saint David create permanent, structural tenant demand concentrated in SA1 and SA2. The DVLA in Morriston and Morriston Hospital anchor the public sector. Government employment does not disappear in a downturn.
Between the 2011 and 2021 censuses, Swansea's population edged down from 239,023 to 238,490, a decline of 0.22%. That is essentially flat. But population figures alone miss the £1.3 billion Swansea Bay City Deal investment programme and the £750 million Urban Splash partnership that are reshaping the city centre. The people may not have arrived yet. The money has.
Earnings in Swansea sit below the national average. The median annual salary is £36,586, compared to £36,353 across Wales and £39,125 for Great Britain. Lower local wages combined with some of the cheapest property in southern Britain create the conditions for high yields. SA1 at 8.8% gross is among the highest single-postcode yields on any PIUK location guide.
Swansea Bay's coastline is the other factor investors need to understand. The Gower Peninsula was the first Area of Outstanding Natural Beauty designated in the UK (1956). That coastal premium is why SA3 (Mumbles, Gower) commands asking prices of £399,049, over 2.5 times SA1's £158,372. Two markets in one city. The data in this guide covers both.
Swansea Economic Summary
- Population: 238,490 (2021 Census). Decline of 0.22% from 2011.
- Median annual salary: £36,586 (Swansea), £36,353 (Wales), £39,125 (Great Britain)
- Employment rate: 65.1% (Swansea), data not available (Wales), 75.6% (Great Britain)
- Unemployment rate: 9.9% (Swansea), data not available (Wales), 4.3% (Great Britain)
- Key employment sectors: Public administration (DVLA), healthcare, higher education, financial services, manufacturing
Source: ONS Census 2021, Nomis Labour Market Profile (ASHE 2025, Employment Oct 2024-Sep 2025)
Swansea's employment rate of 65.1% is well below Great Britain's 75.6%. The unemployment rate of 9.9% is more than double the national 4.3%. Those headline figures reflect a combination of student population (not in the labour force), early retirees, and higher economic inactivity rates common across south Wales. For buy-to-let investors, the key question is whether tenants can pay. The DVLA, Morriston Hospital, and two universities provide secure employment bases that underpin rental demand regardless of the wider labour market statistics.
Regeneration and Investment in Swansea
Swansea has a £1.3 billion City Deal investment programme and a £750 million Urban Splash partnership reshaping the city centre. Add the completed Copr Bay arena and Kingsway Digital District, and the combined regeneration pipeline exceeds £2 billion. The question is no longer whether investment is coming. It is whether prices have caught up with it.
- Copr Bay and Porth Copr Office Development (Phase 1 complete, £135 million): Phase 1 delivered a 3,500-capacity arena, 1.1-acre coastal park, hotel, and residential units in 2022. Phase 2 proposes 300,000 sq ft of Grade A office and mixed-use commercial space on the Porth Copr site. Updates at Copr Bay Swansea.
- Swansea City Waterfront and Urban Splash Partnership (masterplanning, £750 million): A 20-year partnership agreement between Swansea Council and Urban Splash covering seven strategic sites across the city centre and waterfront. The programme aims to transform underused land into residential, commercial, and public realm. Updates at Urban Splash Swansea.
- 71/72 Kingsway Digital District (complete, £32.6 million annual economic impact): Part of the Swansea Bay City Deal, this office development on the former Oceana nightclub site provides Grade A workspace for tech and digital businesses. JLL and Avison Young are joint letting agents. The project contributes to the wider digital economy cluster forming around Swansea's city centre. Updates at Swansea Bay City Deal.

Swansea Property Market Analysis
When Was the Last House Price Crash in Swansea?
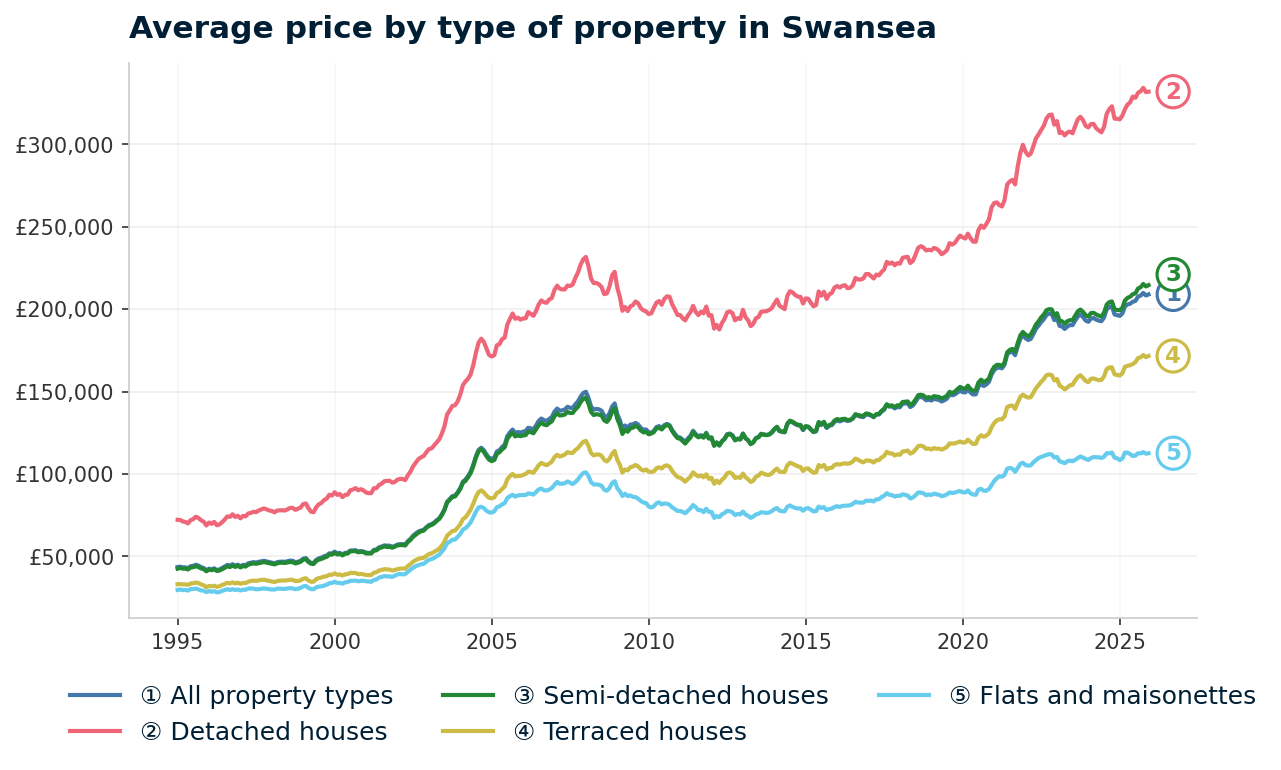
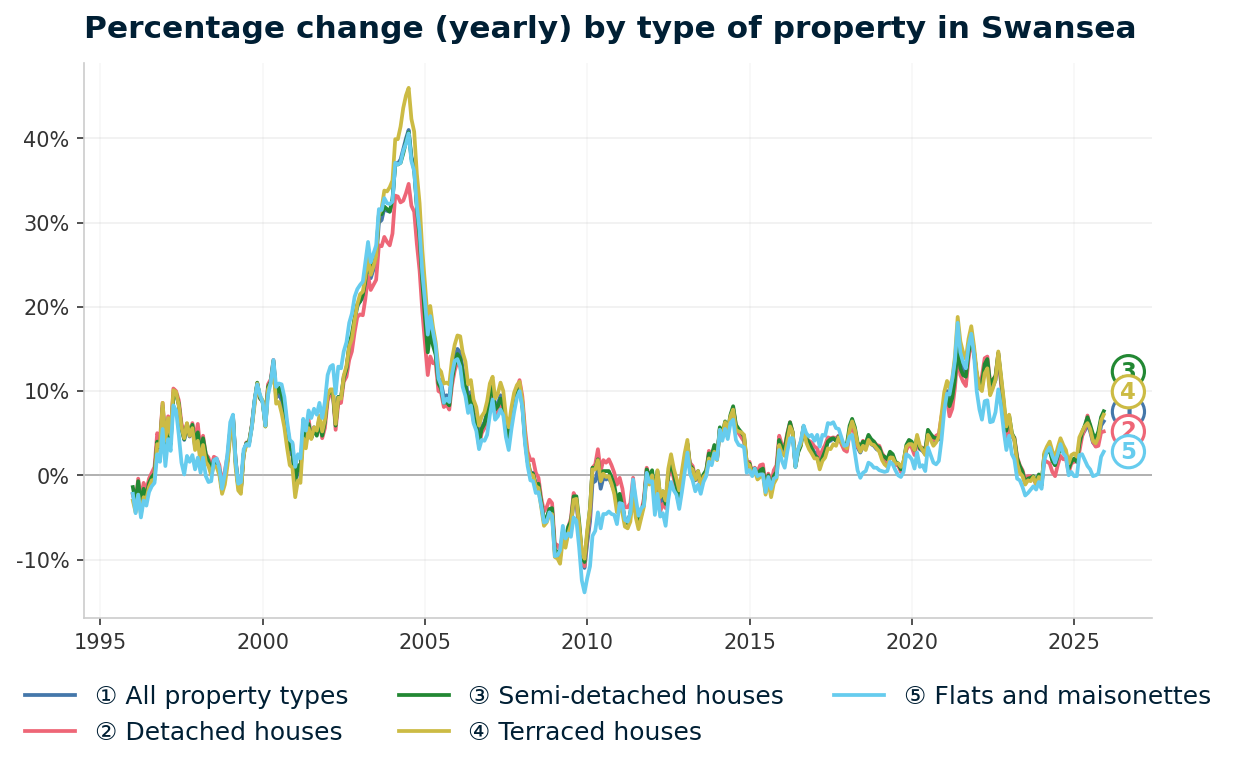
Swansea property prices have risen 379.4% since January 1995, from £43,573 to £208,872, with one major crash of 21.8% between 2008 and 2012. The full HM Land Registry House Price Index for Swansea runs from January 1995 to December 2025. The data shows a prolonged stagnation after the crash, and a delayed but powerful recovery.
- 1995-2000 (Flat start): Swansea began 1995 at £43,573. Prices drifted sideways through the mid-1990s, falling to £41,588 by December 1995. By January 2000, the average had only reached £52,918. While London surged through the late 1990s, Swansea barely moved.
- 2000-2007 (The boom): Swansea caught the wave late but hard. Prices rose from £52,918 in January 2000 to £149,051 by December 2007. That is 182% growth in eight years. Annual growth exceeded 10% through much of this period. Cheap credit and rising public sector employment pushed prices well beyond what local wages could sustain.
- 2008-2012 (The financial crisis and stagnation): From the peak of £149,858 in January 2008 to the trough of £117,230 in February 2012, Swansea lost 21.8% of its value over 49 months. The worst annual change reading was -11.0% in December 2009. Swansea's decline of 21.8% was deeper than Wales overall (-14.6% worst annual change) and deeper than England (-15.5% worst annual change). The stagnation lasted longer too. Prices did not find a floor until early 2012, well after the rest of the UK had begun recovering.
- 2012-2016 (Slow recovery): Growth returned at a crawl. Annual changes hovered between -3% and +4% for four years. By December 2015, the average was £131,642. Still 12.2% below the pre-crash peak. Swansea was one of the last places in southern Britain to recover, reflecting weaker economic fundamentals than Cardiff or Bristol.
- 2017-2019 (Steady growth): Prices rose from £135,952 in January 2017 to £150,459 by December 2019. The pre-crash peak of £149,858 was finally passed in late 2019. That recovery took nearly 12 years from the January 2008 peak. Slow, but it came.
- 2020-2022 (Pandemic surge): The stamp duty holiday equivalent (Land Transaction Tax in Wales) and the remote working shift transformed Swansea's market. Prices jumped from £151,401 in March 2020 to £197,216 by October 2022. That is 30.3% growth in under three years. Swansea's coastal location and affordability made it a beneficiary of the lifestyle relocation trend. Annual growth peaked at 16.8% in November 2021.
- 2023 (Cooling): Interest rate rises slowed momentum. Prices oscillated between £187,933 and £196,672 through 2023. Annual change turned briefly negative from July to December 2023, reaching -1.0% in July and November. A mild correction compared to 2008.
- 2024-2025 (Recovery resumes): Prices stabilised through early 2024 and began climbing again from mid-year. By December 2025, the average reached £208,872 with annual growth of 6.4%. Swansea now sits 39.4% above its pre-crash peak.
Long-Term Property Value Growth in Swansea
- 5 years (2020-2025): +30.3% (£160,307 to £208,872)
- 10 years (2015-2025): +58.7% (£131,642 to £208,872)
- 15 years (2010-2025): +70.6% (£122,416 to £208,872)
- 20 years (2005-2025): +66.9% (£125,140 to £208,872)
- 30 years (1995-2025): +379.4% (£43,573 to £208,872)
The 2008 crash is the reference point for Swansea investors assessing downside. A 21.8% decline took nearly 12 years to recover. That is longer than most UK cities. But the recovery has accelerated since 2020, and the £1.3 billion City Deal investment pipeline did not exist in 2007. The structural picture today is different, even if property prices carry the same inherent uncertainty they always have.
Source: HM Land Registry House Price Index for Swansea, January 1995 to December 2025.
Thinking of Buying?
We have off-market investment properties averaging 8%+ annual yield.
View Property DealsSold House Prices in Swansea
Swansea sits in Wales, where property prices have historically tracked below England. But the scale of the discount depends on what type of property you are looking at. The headline figure of £208,872 is 28.4% below England's £291,865 and 2.8% below the Wales average of £214,883. Swansea is cheaper than Wales as a whole, which tells you something about where the city sits in the national picture.
Flats in Swansea average £112,579. That is 48.7% below the England average of £219,340. Nearly half the price. That gap is the widest of any property type and reflects a mix of city-centre student stock, purpose-built blocks near the marina, and older conversion flats. It also creates the entry point that drives SA1's 8.8% yield.
| Property Type | Swansea Average | England Average | Difference |
|---|---|---|---|
| Detached houses | £331,777 | £471,667 | -29.7% |
| Semi-detached houses | £214,512 | £289,135 | -25.8% |
| Terraced houses | £171,548 | £244,830 | -29.9% |
| Flats and maisonettes | £112,579 | £219,340 | -48.7% |
| All property types | £208,872 | £291,865 | -28.4% |
Semi-detached houses show the narrowest discount at 25.8%. Semis are the core family stock in Swansea's suburban postcodes like SA4 (Gorseinon), SA6 (Morriston), and SA7 (Llansamlet). Owner-occupier demand in these areas keeps semi prices closer to the national average than other types.
Detached houses at £331,777 sit 29.7% below England. Swansea's detached stock is concentrated in the outer suburbs and the SA3 Gower fringe. The Gower's AONB designation supports premiums within that postcode, but the Swansea-wide average still reflects a market well below English pricing.
Terraced houses average £171,548, a 29.9% discount. Victorian and Edwardian terraces in the SA1 city centre, SA5 Fforestfach, and SA6 Morriston form the backbone of Swansea's rental stock. These are the properties most buy-to-let investors are buying. The discount on terraced stock is almost identical to detached, which means the proportional value is consistent across the market.
Flats at £112,579 and a 48.7% discount represent the lowest entry point by property type. City centre and marina flats in SA1 drive this average. For investors targeting yield over capital growth, the flat market in SA1 is where the numbers start.
Property Data Sources
Our location guide relies on diverse, authoritative datasets including:
- HM Land Registry UK House Price Index
- Ministry of Housing, Communities and Local Government
- Ordnance Survey Data Hub
- Propertydata.co.uk
We update our property data quarterly to ensure accuracy. Last update: April 2026. All data is presented as provided by our sources without adjustments or amendments.
Price Per Square Foot in Swansea
Swansea's price per square foot ranges from £161 in SA1 to £326 in SA3, with data available for 8 of the city's 9 postcodes. Price per square foot strips out the size bias in headline asking prices. A postcode might look expensive simply because it has larger properties. This metric shows what you are actually paying for space.
SA99 (DVLA, Swansea Vale) has no residential data and is excluded. The spread of just over 2x reflects the gulf between Swansea's affordable city centre and the Gower coastal premium.
| Rank | Area | Price Per Sq Ft |
|---|---|---|
| 1 | SA1 (City Centre, Marina, Port Tennant) | £161 |
| 2 | SA5 (Fforestfach, Manselton) | £163 |
| 3 | SA6 (Morriston, Plasmarl) | £194 |
| 4 | SA8 (Pontardawe) | £220 |
| 5 | SA4 (Gorseinon, Loughor) | £222 |
| 6 | SA7 (Llansamlet, Birchgrove) | £231 |
| 7 | SA2 (Sketty, Uplands) | £245 |
| 8 | SA3 (Mumbles, Gower) | £326 |
| — | SA99 (DVLA, Swansea Vale) | Not enough data |
SA1 and SA5 are virtually identical at £161 and £163 per square foot. SA1 is the city centre and marina with student flats and new-build apartments. SA5 is Fforestfach and Manselton with older terraced and semi-detached stock. Different housing types, same underlying cost of space.
For investors, SA1 at £161/sq ft delivers the highest yield (8.8%) while SA5 at £163/sq ft delivers 5.8%. The yield gap comes from SA5's lower absolute rents, not from a meaningful price difference.
SA3 at £326 per square foot is double the city centre rate. That premium is the Gower effect. Mumbles and the Gower coast command prices that have more in common with affluent English seaside towns than with the rest of Swansea. Investors here are buying coastal amenity, not rental yield.
The mid-range cluster of SA6, SA8, SA4, and SA7 (£194 to £231) covers Swansea's suburban and semi-rural postcodes. These areas offer more space per pound than the city centre or coast but lack the rental data to assess yields directly.
Figures reflect averages across all property types and ages. Individual values depend on condition, location within the postcode, and building age.
For Sale Asking Prices in Swansea
Swansea's average asking price of £250,854 sits 20.1% above the Land Registry sold price of £208,872. That gap between what sellers expect and what buyers pay narrows in a rising market and widens when conditions cool. The premium varies by postcode.
Swansea's asking prices range from £158,372 in SA1 to £399,049 in SA3. The £240,677 gap between those two tells the story of this city. SA1 is a city centre rebuilding itself through the City Deal. SA3 is an established coastal market with inherited wealth and lifestyle demand. Everything in between falls on a spectrum.
| Rank | Area | Average Asking Price |
|---|---|---|
| 1 | SA1 (City Centre, Marina, Port Tennant) | £158,372 |
| 2 | SA5 (Fforestfach, Manselton) | £180,266 |
| 3 | SA6 (Morriston, Plasmarl) | £192,678 |
| 4 | SA8 (Pontardawe) | £239,076 |
| 5 | SA7 (Llansamlet, Birchgrove) | £240,874 |
| 6 | SA4 (Gorseinon, Loughor) | £281,761 |
| 7 | SA2 (Sketty, Uplands) | £314,754 |
| 8 | SA3 (Mumbles, Gower) | £399,049 |
| — | SA99 (DVLA, Swansea Vale) | Not enough data |
Three postcodes cluster below £200,000: SA1, SA5, and SA6. These are the areas where most buy-to-let activity concentrates. SA1 at £158,372 is the cheapest, and it delivers the highest yield. SA5 at £180,266 and SA6 at £192,678 both offer sub-£200,000 entry with strong five-year growth (27.6% and 30.9% respectively).
The decision between them comes down to whether rental data matters now. SA5 has yield data (5.8%). SA6 does not.
SA2 at £314,754 reflects the Sketty and Uplands premium. This is the university belt where student houses and professional family homes sit side by side. SA2 commands the highest rents in Swansea at £1,537 per month, but asking prices absorb most of that into a 5.9% yield. The per-room HMO income that experienced landlords achieve here is not captured in these headline figures.
The mean asking price across all 8 Swansea postcodes with data is £250,854. That figure appears in the comparison section later, where Swansea is measured against Cardiff, Newport, and Bristol.

House Price Growth in Swansea
All 8 Swansea postcodes with data delivered positive five-year growth, with SA2 leading at 35.8%. Five-year growth captures a full market cycle and filters out the noise of individual transactions. One-year growth can swing on a handful of sales.
An investor who bought a £232,000 property in SA2 five years ago would now be sitting on a property with an asking price of £314,754. That is over £82,000 in equity growth from a university-belt postcode.
| Area | 1 Year | 3 Years | 5 Years |
|---|---|---|---|
| SA2 (Sketty, Uplands) | 7.1% | 13.6% | 35.8% |
| SA7 (Llansamlet, Birchgrove) | 8.4% | 10.8% | 33.9% |
| SA6 (Morriston, Plasmarl) | 0.8% | 10.0% | 30.9% |
| SA4 (Gorseinon, Loughor) | 3.3% | 6.8% | 30.6% |
| SA8 (Pontardawe) | 3.8% | 18.3% | 28.4% |
| SA5 (Fforestfach, Manselton) | 6.0% | 8.1% | 27.6% |
| SA1 (City Centre, Marina, Port Tennant) | 5.5% | 8.3% | 18.9% |
| SA3 (Mumbles, Gower) | -5.3% | -3.2% | 15.3% |
| SA99 (DVLA, Swansea Vale) | Not enough data | Not enough data | Not enough data |
The suburban postcodes have outgrown the city centre and coast. SA2 (35.8%), SA7 (33.9%), SA6 (30.9%), and SA4 (30.6%) all beat SA1 (18.9%) on five-year growth. These are working and middle-class residential areas where demand from first-time buyers and growing families has pushed prices up from a low base. The city centre's regeneration investment has not yet translated into proportional price growth.
SA3 is the only postcode showing negative one-year (-5.3%) and three-year (-3.2%) growth. The Mumbles and Gower market is a premium, low-volume segment. It surged during the pandemic lifestyle boom and has since corrected. At £399,049, SA3 has the highest asking prices in Swansea but the weakest recent momentum. Five-year growth of 15.3% is still positive, but the trend is downward.
SA7 Llansamlet stands out for current momentum. Its 8.4% one-year growth is the highest in Swansea and sits alongside 33.9% over five years. Llansamlet benefits from proximity to the Swansea Enterprise Park and the SA1 waterfront development, with more affordable housing stock than the city centre itself.
Monthly Property Sales in Swansea
Swansea's monthly sales range from 9 in SA8 to 47 in SA4, with a combined total of 213 transactions per month across all postcodes with data. For buy-to-let investors, transaction volume is the exit strategy question. High volume means you can sell when you need to. Low volume means you wait.
Turnover rates vary dramatically. SA8 (Pontardawe) turns over 150% of its listed stock per month. SA3 (Mumbles, Gower) turns over just 11%.
| Area | Sales Per Month | Turnover | Asking Price |
|---|---|---|---|
| SA4 (Gorseinon, Loughor) | 47 | 99% | £281,761 |
| SA1 (City Centre, Marina, Port Tennant) | 40 | 25% | £158,372 |
| SA6 (Morriston, Plasmarl) | 30 | 29% | £192,678 |
| SA2 (Sketty, Uplands) | 28 | 17% | £314,754 |
| SA3 (Mumbles, Gower) | 24 | 11% | £399,049 |
| SA5 (Fforestfach, Manselton) | 24 | 46% | £180,266 |
| SA7 (Llansamlet, Birchgrove) | 11 | 52% | £240,874 |
| SA8 (Pontardawe) | 9 | 150% | £239,076 |
| SA99 (DVLA, Swansea Vale) | Not enough data | Not enough data | Not enough data |
SA1 has 40 sales per month but a turnover of just 25%. That low turnover relative to high volume tells you there is a large pool of stock that rarely comes to market. Landlords and owner-occupiers hold. City centre properties in Swansea change hands frequently enough for liquidity, but the market is not churning. If you are buying to hold, that stability is a signal that other investors are doing the same.
SA8 Pontardawe's 150% turnover on 9 sales per month is a small-market effect. When only a handful of properties are listed at any time, a few transactions create extreme turnover percentages. The absolute volume of 9 sales per month means you are looking at a thin market. Selling quickly in SA8 depends on pricing correctly.
SA4 at 47 sales per month leads on volume. Gorseinon and Loughor attract families and commuters. The 99% turnover means stock sells nearly as fast as it lists. For exit strategy planning, SA4 and SA1 offer the deepest buyer pools in Swansea.
Property Data Sources
Our location guide relies on diverse, authoritative datasets including:
- HM Land Registry UK House Price Index
- Ministry of Housing, Communities and Local Government
- Ordnance Survey Data Hub
- Propertydata.co.uk
We update our property data quarterly to ensure accuracy. Last update: April 2026. All data is presented as provided by our sources without adjustments or amendments.

Swansea Rental Market Analysis
For investors weighing up whether rental property is a worthwhile investment in Swansea, the data below breaks down average monthly rents and gross rental yields across the city's postcodes.
Rental data is available for 4 of 9 postcodes. SA4 (Gorseinon), SA6 (Morriston), SA7 (Llansamlet), SA8 (Pontardawe), and SA99 (DVLA) have insufficient current listings for reliable figures. For the four with data, monthly rents range from £868 in SA5 to £1,537 in SA2 and gross yields range from 4.1% to 8.8%. If you are looking to build a property portfolio in Wales, Swansea's combination of low entry prices and high city-centre yields makes it a focused play on specific postcodes.
Average Rent & Gross Rental Yields in Swansea
SA1 delivers Swansea's highest gross yield at 8.8%, where monthly rents of £1,168 meet asking prices of just £158,372. Gross rental yield is calculated from the average asking price and average monthly rent. It does not account for void periods, maintenance, management fees, or mortgage costs.
At the other end, SA3 Mumbles at 4.1% reflects £399,049 asking prices absorbing strong absolute rents of £1,359. The yield spread across Swansea is 4.7 percentage points, one of the widest of any city on our guides. Rental data is available for 4 of the 9 postcodes.
| Area | Average Monthly Rent | Average Asking Price | Gross Yield |
|---|---|---|---|
| SA1 (City Centre, Marina, Port Tennant) | £1,168 | £158,372 | 8.8% |
| SA2 (Sketty, Uplands) | £1,537 | £314,754 | 5.9% |
| SA5 (Fforestfach, Manselton) | £868 | £180,266 | 5.8% |
| SA3 (Mumbles, Gower) | £1,359 | £399,049 | 4.1% |
| SA4 (Gorseinon, Loughor) | Not enough data | £281,761 | Not enough data |
| SA6 (Morriston, Plasmarl) | Not enough data | £192,678 | Not enough data |
| SA7 (Llansamlet, Birchgrove) | Not enough data | £240,874 | Not enough data |
| SA8 (Pontardawe) | Not enough data | £239,076 | Not enough data |
| SA99 (DVLA, Swansea Vale) | Not enough data | Not enough data | Not enough data |
SA1 at 8.8% is the headline, but the story underneath it matters. SA1 covers the city centre, marina, and Port Tennant. The Copr Bay development delivered in 2022. Urban Splash has a 20-year masterplan for the waterfront.
Asking prices of £158,372 are the lowest in Swansea, and monthly rents of £1,168 are driven by student demand from Swansea University's Bay Campus and young professional tenants working in the city centre. The combination of low prices and strong rental demand produces the yield.
SA2 commands the highest absolute rent in Swansea at £1,537 per month. Sketty and Uplands sit adjacent to the university's Singleton Campus. This is prime student HMO territory alongside family housing. The 5.9% yield is strong, but the £314,754 asking price means a 30% deposit of £94,426. Per-room income from HMO lets is not captured in these headline rent figures.
Five postcodes have no rental data. SA4, SA6, SA7, SA8, and SA99 all show "Not enough data" for rents and yields. These are Swansea's outer suburban and semi-rural areas where rental listings are too sparse for reliable averages. It does not mean there is no rental market. It means the data cannot quantify it reliably. Investors considering these postcodes will need to assess rental demand on a property-by-property basis.
Is Swansea Rent High?
Across Swansea's 4 postcodes with rental data, rent ranges from 28.5% to 50.4% of the local median gross monthly salary of £3,049. Rent affordability matters from both sides. For tenants, it determines whether they can sustain payments long-term. For landlords, areas where rent consumes a lower share of income tend to produce more reliable tenants and fewer arrears.
The median gross weekly salary in Swansea is £703.60, equating to £3,049 per month or £36,586 per year. This is above the Wales median of £699.10 per week and below the Great Britain median of £752.40 per week. Data from the Nomis Labour Market Profile (ASHE 2025).
The general benchmark is that rent becomes stretched above 30% of gross income. Three of the four postcodes sit above that level, reflecting a combination of lower wages and the premium end of the rental market.
| Rank | Area | Rent as % of Income |
|---|---|---|
| 1 | SA2 (Sketty, Uplands) | 50.4% |
| 2 | SA3 (Mumbles, Gower) | 44.6% |
| 3 | SA1 (City Centre, Marina, Port Tennant) | 38.3% |
| 4 | SA5 (Fforestfach, Manselton) | 28.5% |
| — | SA4 (Gorseinon, Loughor) | Not enough data |
| — | SA6 (Morriston, Plasmarl) | Not enough data |
| — | SA7 (Llansamlet, Birchgrove) | Not enough data |
| — | SA8 (Pontardawe) | Not enough data |
| — | SA99 (DVLA, Swansea Vale) | Not enough data |
SA2 at 50.4% looks extreme on paper. But SA2 Sketty and Uplands is where student HMOs cluster. The £1,537 monthly rent figure reflects whole-property rents in an area where most tenants are students sharing. No single student is paying £1,537.
The per-person cost in a shared house is a fraction of that headline figure. The affordability ratio overstates the pressure on individual tenants in this postcode.
SA5 at 28.5% sits below the 30% threshold. Fforestfach and Manselton attract working tenants on local wages. Rents of £868 per month against a £3,049 gross monthly salary leave meaningful headroom. For investors, that headroom translates to lower arrears risk and more stable tenancies. SA5 also delivers 5.8% yield, making it the postcode where affordability and investor returns align most closely.
Thinking of Buying?
We have off-market investment properties averaging 8%+ annual yield.
View Property DealsAre Swansea House Prices High? Price-to-Earnings Ratios
Five of Swansea's 8 postcodes have price-to-earnings ratios below the national benchmark of 7.5x, with SA1 at just 4.3x. The price-to-earnings ratio compares a postcode's average asking price to the local median annual salary. The national benchmark of 7.5x comes from England's average sold price of £291,865 against Great Britain's median annual salary of £39,125.
Purchasing a property in Swansea requires between 4.3 and 10.9 times the median annual salary. This is based on the Nomis Labour Market Profile for Swansea showing the median gross annual income for Swansea residents is £36,586.
Five of Swansea's eight postcodes sit below the national benchmark of 7.5x. SA1 at 4.3x is the most affordable entry point in the city by a wide margin. SA5 at 4.9x and SA6 at 5.3x follow. Even SA8 (6.5x) and SA7 (6.6x) are comfortably below the national average. Only SA4 (7.7x), SA2 (8.6x), and SA3 (10.9x) sit above.
| Rank | Area | Price-to-Earnings Ratio |
|---|---|---|
| 1 | SA1 (City Centre, Marina, Port Tennant) | 4.3x |
| 2 | SA5 (Fforestfach, Manselton) | 4.9x |
| 3 | SA6 (Morriston, Plasmarl) | 5.3x |
| 4 | SA8 (Pontardawe) | 6.5x |
| 5 | SA7 (Llansamlet, Birchgrove) | 6.6x |
| 6 | SA4 (Gorseinon, Loughor) | 7.7x |
| 7 | SA2 (Sketty, Uplands) | 8.6x |
| 8 | SA3 (Mumbles, Gower) | 10.9x |
| — | SA99 (DVLA, Swansea Vale) | Not enough data |
SA1 at 4.3x is one of the lowest price-to-earnings ratios across all PIUK location guides. Property in SA1 costs just over four years of the local median salary. That is the same ratio that delivers the 8.8% yield. Low prices relative to wages, strong rental demand, and the City Deal regeneration pipeline all converge in the same postcode.
SA3 at 10.9x is disconnected from local wages. The Mumbles and Gower market is not driven by Swansea salaries. Buyers here are drawn by lifestyle, often with equity from elsewhere. That disconnect is why SA3 delivers the lowest yield in Swansea despite the highest absolute rents. The price premium is a lifestyle tax, not a reflection of local earning power.
Deposit Requirements in Swansea
A 30% deposit on Swansea's cheapest postcode, SA1, requires £47,512. The standard buy-to-let deposit is 30%. The table below reflects this benchmark, which unlocks better interest rates and a wider range of mortgage products. The rate secured matters for cash flow.
Swansea's entry costs range from £47,512 in SA1 to £119,715 in SA3. Three postcodes require deposits under £58,000, making Swansea one of the most accessible cities in Wales and southern Britain for new buy-to-let investors. For investors hunting below market value properties or repossessed houses, Swansea's city centre postcode already sits at a significant discount to both the Wales and England averages.
| Rank | Area | 30% Deposit Required |
|---|---|---|
| 1 | SA1 (City Centre, Marina, Port Tennant) | £47,512 |
| 2 | SA5 (Fforestfach, Manselton) | £54,080 |
| 3 | SA6 (Morriston, Plasmarl) | £57,803 |
| 4 | SA8 (Pontardawe) | £71,723 |
| 5 | SA7 (Llansamlet, Birchgrove) | £72,262 |
| 6 | SA4 (Gorseinon, Loughor) | £84,528 |
| 7 | SA2 (Sketty, Uplands) | £94,426 |
| 8 | SA3 (Mumbles, Gower) | £119,715 |
| — | SA99 (DVLA, Swansea Vale) | Not enough data |
The £6,568 gap between SA1 (£47,512) and SA5 (£54,080) buys a very different yield profile. SA1 at 8.8% delivers the highest yield in Swansea from the lowest deposit. SA5 at 5.8% requires just £6,500 more but in a quieter suburban area with lower rent. For yield-focused investors, SA1 is where the deposit-to-return ratio is sharpest.
A clear tier break sits between SA6 (£57,803) and SA8 (£71,723). Below £58,000, SA1 delivers 8.8% yield and SA5 delivers 5.8%, while SA6 lacks rental data but posted 30.9% five-year growth. Above £72,000, the remaining five postcodes either lack rental data (SA7, SA8, SA4) or deliver lower yields at higher cost (SA2, SA3). The data points to the city centre and inner western postcodes as where deposit efficiency is highest.
Deposit is only part of the upfront cost. Budget for Land Transaction Tax (Wales uses LTT, not Stamp Duty), legal fees, and survey costs. Use our stamp duty calculator for an estimate, and see our guide to buy-to-let costs for a full breakdown. Investors exploring lower-capital routes can read about no-deposit investment property options.

What the Swansea Data Tells Buy-to-Let Investors
SA1 leads Swansea across more metrics than any other postcode. Highest yield (8.8%), lowest asking price (£158,372), lowest deposit (£47,512), lowest price-to-earnings (4.3x), and the second-highest transaction volume (40 per month). Five-year growth of 18.9% is second-weakest of the four postcodes with rental data (ahead of SA3's 15.3%), but the incoming City Deal and Urban Splash investment has not yet been priced in. SA1 is the yield play.
SA2 and SA5 sit between the extremes. SA2 (Sketty, Uplands) delivers the highest rents (£1,537) and strongest growth (35.8% over five years) but needs a £94,426 deposit. SA5 (Fforestfach, Manselton) offers 5.8% yield at a £54,080 deposit with 27.6% five-year growth. For investors who want rental data without SA1's city-centre concentration, these two postcodes provide alternatives at different price points.
SA4, SA6, SA7, and SA8 lack rental data but show strong capital growth. SA6 (Morriston) delivered 30.9% over five years at just £192,678. SA7 (Llansamlet) grew 33.9%. These are suburban residential areas with secure employment from the DVLA and Morriston Hospital. Investors looking at renovation properties may find older stock in SA5 and SA6 where the price per square foot starts at £163. Without yield data, investors in the outer postcodes are pricing based on capital appreciation and local knowledge rather than published rental metrics.
SA3 (Mumbles, Gower) sits in a different market. The highest asking prices (£399,049), lowest yield (4.1%), negative one-year growth (-5.3%), and lowest turnover (11%) in Swansea. The data shows a cooling premium segment where lifestyle demand is softening after the pandemic surge. Investors targeting off-market property may find more flexibility in SA3 than in the data-rich city centre postcodes. For a wider comparison of investment property across Wales and the UK, see our main listings.
How Swansea Buy-to-Let Compares to Nearby Areas
Swansea has the lowest mean asking price (£250,854) and the highest top yield (8.8%) of the four Welsh and Severn corridor locations compared below. Investors looking at Swansea typically also consider Cardiff, Newport, and Bristol. The table compares all four using the same methodology: mean asking price across all postcodes, mean monthly rent across postcodes with data, and top single-postcode gross yield.
| Location | Mean Asking Price | Mean Monthly Rent | Top Gross Yield |
|---|---|---|---|
| Swansea | £250,854 | £1,233 | 8.8% |
| Newport | £272,487 | £1,037 | 5.5% |
| Cardiff | £308,726 | £1,223 | 7.3% |
| Bristol | £372,904 | £1,777 | 8.2% |
Swansea has the lowest mean asking price and the highest top yield in this group. At £250,854, Swansea is £22,000 cheaper than Newport and £58,000 cheaper than Cardiff. The 8.8% top yield in SA1 exceeds Bristol's 8.2% and Cardiff's 7.3%.
Bristol commands the highest absolute rents at £1,777 per month. But Bristol's mean asking price of £372,904 means a 30% deposit of £111,871. Swansea's SA1 at £47,512 is less than half that. The yield-per-pound-of-deposit calculation favours Swansea heavily.
Newport is the closest in price to Swansea but delivers a notably lower top yield at 5.5%. Cardiff sits between the two on price and yield. For investors comparing across Wales and the Severn corridor, Swansea's city centre offers the sharpest yield numbers, while Cardiff provides the broadest rental data coverage and Bristol brings the highest absolute rents. The data on each is in our individual guides. For a broader comparison across the UK, see our guide to the best buy-to-let locations.
Frequently Asked Questions
What are the different areas in Swansea for property investment?
Swansea's 9 postcodes divide into three zones. The city centre and inner west (SA1, SA5, SA6) have the lowest asking prices (£158,372 to £192,678) and the highest yields where data exists (5.8% to 8.8%). The suburban ring (SA4, SA7, SA8) has asking prices from £239,076 to £281,761 and delivered the strongest five-year growth (28.4% to 33.9%) but lacks rental yield data. The coastal premium (SA2, SA3) commands £314,754 to £399,049 with university and lifestyle demand.
SA2 (Sketty, Uplands) bridges the zones, combining strong rents (£1,537/month) with university-driven demand. Each zone attracts a different tenant profile: students and young professionals in the centre, families in the suburbs, professionals and retirees on the coast.
What is the average rent in Swansea?
Average monthly rents in Swansea range from £868 in SA5 (Fforestfach, Manselton) to £1,537 in SA2 (Sketty, Uplands) across the four postcodes with sufficient data. SA1 (City Centre) averages £1,168 per month and SA3 (Mumbles, Gower) averages £1,359. Five postcodes (SA4, SA6, SA7, SA8, SA99) do not have enough current rental listings for reliable averages. The mean monthly rent across postcodes with data is £1,233. Rent levels are influenced by proximity to the two universities, with SA1 and SA2 drawing from Swansea University's Bay and Singleton campuses respectively.
How does Swansea compare to Cardiff for buy-to-let?
Swansea has a lower mean asking price (£250,854 vs Cardiff's £308,726) and a higher top yield (8.8% vs 7.3%). Cardiff offers broader rental data coverage across more postcodes and higher absolute rents in its city centre. Swansea's SA1 at £158,372 asking price and 8.8% yield has a lower entry point than any Cardiff postcode. Cardiff's larger economy, capital city status, and stronger transport links generate wider tenant demand. The two cities serve different investor profiles: Swansea for yield concentration in a small number of postcodes, Cardiff for diversification across a larger rental market.
Is student accommodation a good investment in Swansea?
Swansea's 25,000 university students create concentrated rental demand in SA1 (8.8% yield) and SA2 (£1,537/month average rent). Swansea University's Bay Campus sits in SA1 and the Singleton Campus borders SA2. The University of Wales Trinity Saint David adds further demand.
Void periods during summer are a factor. Experienced landlords in SA2 often achieve higher per-room income through HMO lets than the headline single-let figures suggest. For a broader view of the sector, see our guide to purpose-built student accommodation.
What is buy-to-let like in Wales compared to England?
Wales has a different tax and regulatory framework. Land Transaction Tax (LTT) replaces Stamp Duty Land Tax (SDLT), with different rates and thresholds. Rent Smart Wales requires all landlords letting property in Wales to register and complete training. This applies to all Swansea postcodes.
Swansea's average sold price of £208,872 is 2.8% below the Wales average of £214,883 and 28.4% below England's £291,865. Yields in SA1 (8.8%) are competitive with or above most English city-centre postcodes. The key differences are regulatory rather than fundamental market structure.
How many houses are for sale in Swansea?
Swansea has around 213 property sales per month across its 8 postcodes with data, based on PropertyData transaction figures. SA4 (Gorseinon, Loughor) leads with 47 sales per month, followed by SA1 (City Centre) at 40. Asking prices start at £158,372 in SA1 and reach £399,049 in SA3 (Mumbles, Gower). The number of active listings changes seasonally, but Swansea's combined transaction volume of 213 per month indicates a liquid market. For current listings, see our main property listings or explore our individual Wales location guides.
What is the population of Swansea?
The 2021 Census recorded Swansea's population at 238,490, down from 239,023 in 2011. That is a decline of 533 people or 0.22% over the decade. Swansea is the second-largest city in Wales after Cardiff (362,308). The headline population figure does not capture the student population effect. Around 25,000 university students add to housing demand during term time without all being counted in the census at their Swansea address. The City Deal and Urban Splash regeneration programmes are designed to attract residents and businesses to the city centre, which may reverse the marginal decline in future census data.