West London Buy-to-Let Investment: Hotspots and Opportunities
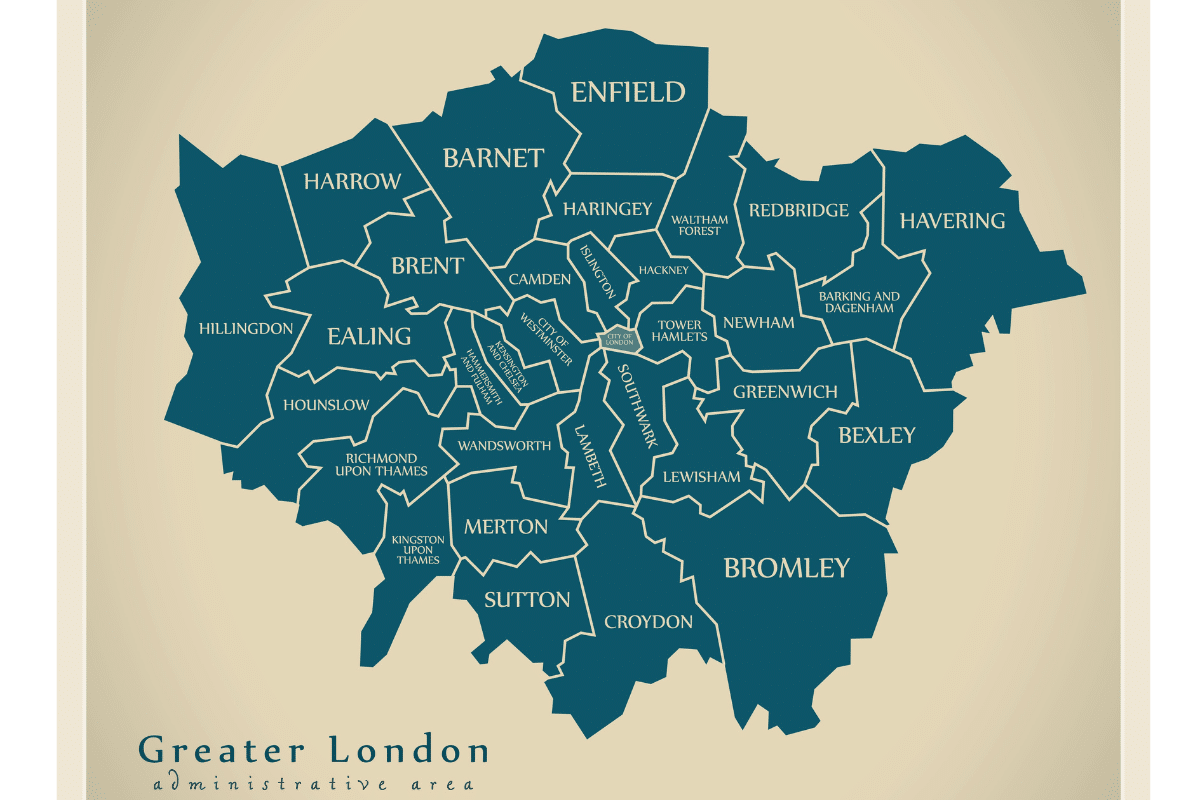
West London, stretching from the prestigious postcodes of Kensington and Chelsea to the more affordable areas of Hillingdon, the region boasts average house prices ranging from £368,901 in TW14 to a staggering £1,939,167 in W8.
Rental yields also show significant variation, from a low 2.8% in W8 (Kensington) to an impressive 5.9% in TW14 (Hatton), catering to different investment strategies for buy-to-let investors.
West London is comparable to other regions of Greater London for population and rental demand, with areas like W10 boasting high population densities of 40,421 people per square mile, contrasting sharply with UB9 at just 1,377 people per square mile. This spectrum accommodates various tenant preferences, from bustling urban environments to quieter suburban settings, providing lots of choice for landlords to build a property portfolio with all types of tenants in mind.
Monthly property sales also vary considerably, from as low as 7 in UB9 to as high as 33 in SW6. This is important for West London investors to consider.
As a general rule, if you are a property developer looking at buying to refurbish and then flip properties, you may wish to focus on areas in West London or across the City with the highest sales activity and the London boroughs with the highest house price growth.

-
by Robert Jones, Founder of Property Investments UK
With two decades in UK property, Rob has been investing in buy-to-let since 2005, and uses property data to develop tools for property market analysis.
Property Data Sources
Our location guide relies on diverse, authoritative datasets including:
- HM Land Registry UK House Price Index
- Ministry of Housing, Communities and Local Government
- Ordnance Survey Data Hub
- Propertydata.co.uk
We update our property data quarterly to ensure accuracy. Last update: September 2024. All data is presented as provided by our sources without adjustments or amendments.
Top Buy-to-Let Hotspots in West London
Brent
Brent offers buy-to-let landlords a range of property types and house prices. NW6 (Kilburn) features Victorian terraces and purpose-built flats near Kilburn station, attracting young professionals with the Jubilee line providing a 15-minute journey to Bond Street. HA9 (Wembley) is undergoing significant regeneration around the iconic stadium, with new-build apartments near Wembley Park station appealing to young renters and sports enthusiasts.
The Metropolitan line from Wembley Park reaches Baker Street in 13 minutes. NW2 (Willesden Green) offers a mix of period conversions and modern flats, popular among families and professionals. From Willesden Green station, the Jubilee line connects to Canary Wharf in 30 minutes.
For more affordable options, NW10 (Neasden) provides larger properties suitable for family rentals, with Neasden station on the Jubilee line reaching West Hampstead in 7 minutes. HA0 (Alperton) is an up-and-coming area where landlords can find value, with Alperton station on the Piccadilly line offering a 30-minute commute to Leicester Square. The 86-acre Fryent Country Park in NW9 adds appeal for tenants seeking green spaces, while still being close to Kingsbury station on the Jubilee line, which reaches London Bridge in 27 minutes.
Brent postcode districts include: HA0, HA9, NW2, NW6, NW9, NW10.
Discover more about Brent buy-to-let.
Brent Property Prices
| Postcode | Average House Price £ | Average £ per sq ft | Average Rental Yield % |
|---|---|---|---|
| NW6 | £765,432 | £850 | 5.1% |
| NW2 | £612,345 | £629 | 4.6% |
| NW10 | £534,567 | £550 | 5.2% |
| NW9 | £493,827 | £525 | 5.3% |
| HA9 | £479,625 | £501 | 5.1% |
| HA0 | £452,882 | £489 | 5.0% |
Brent Housing Market
| Postcode | Population | Density per square mile | Average Property Sales per Month |
|---|---|---|---|
| NW10 | 91,952 | 17,388 | 29 |
| NW2 | 67,393 | 20,457 | 17 |
| NW6 | 62,122 | 33,154 | 21 |
| NW9 | 59,369 | 20,070 | 26 |
| HA0 | 48,613 | 21,627 | 19 |
| HA9 | 47,505 | 19,369 | 23 |

Ealing
Ealing, known as the "Queen of the Suburbs" for its many parks and tree lined streets, offers buy-to-let investors a mix of urban and suburban properties. W5 (Ealing Broadway) is the borough's commercial hub, attracting young professionals and families with its mix of period houses and affordable modern flats. Ealing Broadway station provides excellent connectivity, with the Central line reaching Oxford Circus in 25 minutes and future Crossrail services promising even faster connections. W3 (Acton) is gaining popularity among young renters, with East Acton station on the Central line offering a 23-minute journey to Bank.
UB5 (Northolt) presents more affordable options for investors, with larger properties suitable for families. Northolt station on the Central line reaches Marble Arch in 30 minutes. W13 (West Ealing) offers a suburban feel with good amenities, attracting families and professionals.
For green spaces, W7 (Hanwell) boasts the 28-hectare Elthorne Park, while still providing good transport links via Hanwell station.
Ealing postcode districts include: UB1, UB2, UB3, UB5, UB6, W3, W5, W7, W13.
Discover more about Ealing buy-to-let.
Ealing Property Prices
| Postcode | Average House Price £ | Average £ per sq ft | Average Rental Yield % |
|---|---|---|---|
| W5 | £685,036 | £748 | 3.7% |
| W13 | £630,966 | £727 | 3.9% |
| W3 | £587,439 | £694 | 4.6% |
| W7 | £547,890 | £612 | 4.0% |
| UB6 | £412,345 | £430 | 5.7% |
| UB1 | £411,234 | £432 | 5.7% |
| UB5 | £398,765 | £425 | 5.8% |
| UB2 | £389,876 | £420 | 5.8% |
| UB3 | £375,642 | £415 | 5.9% |
Ealing Housing Market
| Postcode | Population | Density per square mile | Average Property Sales per Month |
|---|---|---|---|
| UB6 | 50,948 | 11,824 | 20 |
| W3 | 50,534 | 17,918 | 25 |
| W5 | 49,952 | 17,009 | 28 |
| UB3 | 48,474 | 11,384 | 16 |
| UB5 | 45,198 | 13,518 | 18 |
| UB1 | 39,394 | 25,197 | 14 |
| W13 | 31,771 | 22,629 | 16 |
| W7 | 28,739 | 18,617 | 14 |
| UB2 | 32,498 | 15,560 | 12 |
Hammersmith and Fulham
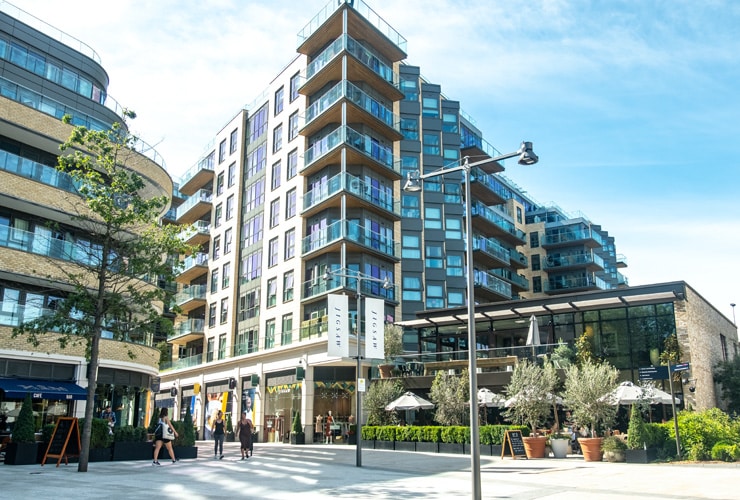
Hammersmith and Fulham, one of London’s key business districts, is at the higher end of house prices compared to other London Boroughs, making it difficult for buy-to-let investors looking for entry level opportunities.
However for those investors looking for exceptionally high tenant demand that aren’t put off by the higher costs per square foot, there are some postcodes with competitive yields. SW6 (Fulham) attracts young professionals with its Victorian terraces and riverside developments. Fulham Broadway station connects to Victoria in 16 minutes via the District line. W6 (Hammersmith) is a bustling commercial centre with Hammersmith station serving four tube lines, reaching Piccadilly Circus in 14 minutes on the Piccadilly line.
Hammersmith and Fulham postcode districts include: SW6, W6, W12, W14.
Hammersmith and Fulham Property Prices
| Postcode | Average House Price £ | Average £ per sq ft | Average Rental Yield % |
|---|---|---|---|
| SW6 | £1,054,789 | £1,105 | 3.8% |
| W14 | £941,953 | £996 | 3.6% |
| W6 | £849,904 | £930 | 4.5% |
| W12 | £727,002 | £831 | 4.4% |
Hammersmith and Fulham Housing Market
| Postcode | Population | Density per square mile | Average Property Sales per Month |
|---|---|---|---|
| SW6 | 64,994 | 31,561 | 33 |
| W12 | 48,290 | 24,788 | 19 |
| W14 | 37,258 | 37,751 | 20 |
| W6 | 35,652 | 30,496 | 19 |
Harrow
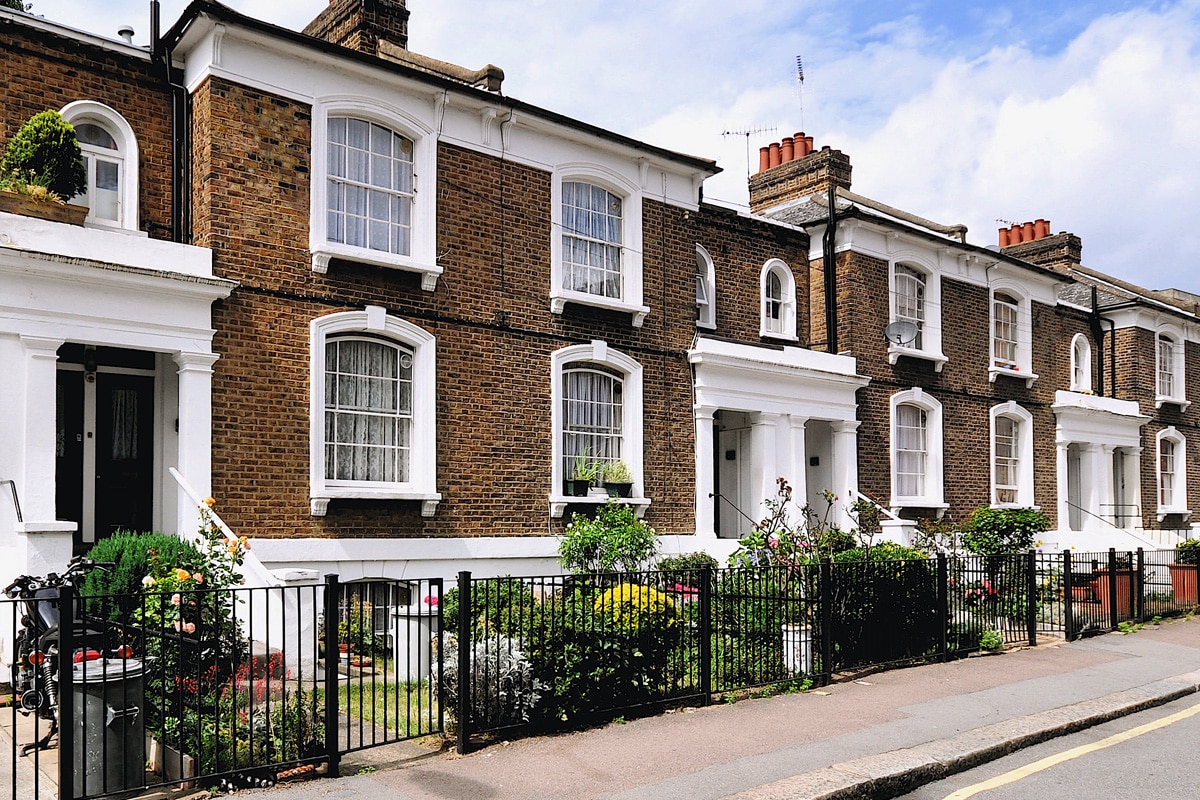
Harrow offers buy-to-let investors a suburban environment with good connections to central London. HA1 (Harrow) is the borough's commercial centre, attracting young professionals and students. Harrow-on-the-Hill station provides Metropolitan line services to Baker Street in 19 minutes. HA2 (North Harrow) appeals to families with its quieter streets and good schools. North Harrow station on the Metropolitan line reaches Liverpool Street in 35 minutes.
HA3 (Wealdstone) offers more affordable options for buy-to-let investors, with Harrow & Wealdstone station providing both Overground and Bakerloo line services to Queen's Park in 15 minutes. HA5 (Pinner) is known for its village-like atmosphere and period properties. Pinner station, on the Metropolitan line, connects to King's Cross St. Pancras in 30 minutes, attracting commuters seeking a balance between suburban living and city access.
Harrow postcode districts include: HA1, HA2, HA3, HA5, HA7, HA8.
Discover more about Harrow buy-to-let.
Harrow Property Prices
| Postcode | Average House Price £ | Average £ per sq ft | Average Rental Yield % |
|---|---|---|---|
| HA7 | £685,234 | £605 | 4.5% |
| HA5 | £647,283 | £592 | 4.6% |
| HA1 | £548,392 | £575 | 5.0% |
| HA8 | £523,456 | £538 | 5.1% |
| HA2 | £499,234 | £525 | 5.1% |
| HA3 | £479,872 | £511 | 5.1% |
Harrow Housing Market
| Postcode | Population | Density per square mile | Average Property Sales per Month |
|---|---|---|---|
| HA3 | 70,809 | 14,925 | 28 |
| HA8 | 64,905 | 15,099 | 25 |
| HA2 | 55,194 | 17,541 | 24 |
| HA5 | 44,511 | 9,308 | 15 |
| HA1 | 38,486 | 15,332 | 22 |
| HA7 | 35,976 | 8,943 | 17 |
Hillingdon
Hillingdon, the westernmost borough of London, offers a mix of more affordable locations for buy-to-let landlords. UB8 (Uxbridge) is the borough's commercial hub, attracting students and young professionals, making it an option for those considering investing in to purpose built student accommodation.
Uxbridge station provides Metropolitan and Piccadilly line services, reaching King's Cross St. Pancras in 45 minutes. UB10 (Ickenham) appeals to families with its suburban feel and good schools. West Ruislip station offers Central line access to Oxford Circus in 37 minutes.
HA4 (Ruislip) presents a mix of period and modern properties. Ruislip station, on both the Metropolitan and Piccadilly lines, connects to Leicester Square in 37 minutes.
Hillingdon postcode districts include: HA4, HA6, UB3, UB4, UB7, UB8, UB9, UB10.
Hillingdon Property Prices
| Postcode | Average House Price £ | Average £ per sq ft | Average Rental Yield % |
|---|---|---|---|
| HA6 | £715,283 | £610 | 4.4% |
| UB9 | £503,344 | £500 | 5.2% |
| HA4 | £494,527 | £505 | 5.0% |
| UB10 | £464,738 | £495 | 5.0% |
| UB8 | £419,449 | £510 | 4.7% |
| UB7 | £392,555 | £489 | 5.1% |
Hillingdon Housing Market
| Postcode | Population | Density per square mile | Average Property Sales per Month |
|---|---|---|---|
| HA4 | 50,115 | 8,311 | 26 |
| UB3 | 48,474 | 11,384 | 16 |
| UB4 | 39,573 | 14,011 | 18 |
| UB8 | 36,116 | 10,423 | 19 |
| UB10 | 33,615 | 7,344 | 18 |
| UB7 | 29,741 | 6,863 | 15 |
| HA6 | 21,901 | 4,413 | 14 |
| UB9 | 14,336 | 1,377 | 7 |

Hounslow
Hounslow offers buy-to-let investors a range of postcodes with solid rental yields, when compared to many areas across the Greater London region.
Hounslow Central station on the Piccadilly line reaches Leicester Square in 37 minutes. TW8 (Brentford) has seen significant regeneration, particularly along its riverside. Brentford station provides South Western Railway services to Waterloo in 30 minutes.
W4 (Chiswick) is an affluent area known for its village-like atmosphere and excellent amenities. Chiswick Park station on the District line offers a 25-minute journey to Victoria. TW5 (Heston) provides more affordable entry level options for landlords, while still benefiting from good transport links and having high tenant demand.
Hounslow postcode districts include: TW3, TW4, TW5, TW7, TW8, TW13, TW14, W4.
Hounslow Property Prices
| Postcode | Average House Price £ | Average £ per sq ft | Average Rental Yield % |
|---|---|---|---|
| W4 | £869,543 | £950 | 4.1% |
| TW8 | £489,012 | £500 | 5.2% |
| TW7 | £435,678 | £470 | 5.5% |
| TW3 | £398,234 | £450 | 5.6% |
| TW5 | £390,123 | £445 | 5.6% |
| TW4 | £384,567 | £440 | 5.7% |
| TW13 | £375,890 | £435 | 5.8% |
| TW14 | £368,901 | £430 | 5.9% |
Hounslow Housing Market
| Postcode | Population | Density per square mile | Average Property Sales per Month |
|---|---|---|---|
| W4 | 44,335 | 18,065 | 27 |
| TW3 | 39,534 | 25,800 | 15 |
| TW7 | 37,586 | 11,036 | 14 |
| TW13 | 36,127 | 11,403 | 17 |
| TW5 | 29,216 | 14,055 | 13 |
| TW14 | 27,980 | 9,973 | 15 |
| TW4 | 27,899 | 14,303 | 12 |
| TW8 | 19,673 | 15,175 | 16 |
Kensington and Chelsea
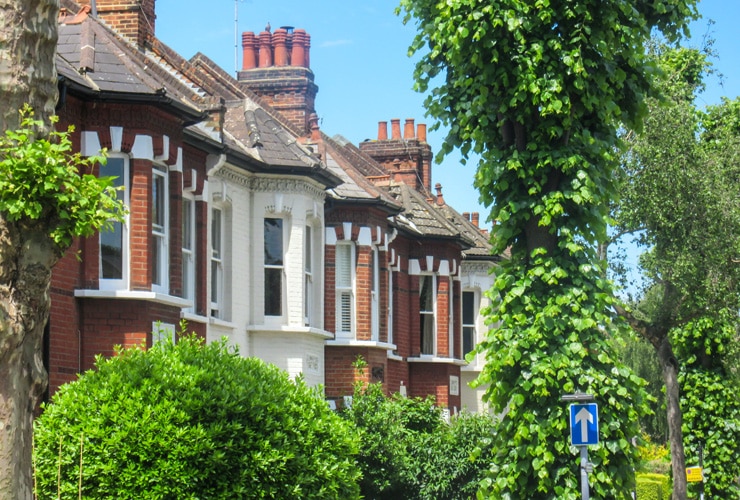
Kensington and Chelsea is one of London's most prestigious boroughs, offering high-end investment opportunities, luxury accommodation and matching price tags. Home to the highest priced houses in London and indeed the UK. SW3 (Chelsea) is known for its luxury properties and high-end retail. Sloane Square station on the District and Circle lines reaches Victoria in just 3 minutes. SW7 (South Kensington) is popular among international students and professionals, with South Kensington station serving the Piccadilly, Circle, and District lines, reaching Piccadilly Circus in 9 minutes.
W8 (Kensington) offers a mix of grand Victorian houses and modern apartments, with High Street Kensington station on the Circle and District lines providing access to Monument in 20 minutes. W11 (Notting Hill) is famous for its colourful houses and vibrant atmosphere. Notting Hill Gate station serves the Central, Circle, and District lines, reaching Oxford Circus in 9 minutes. The area is particularly popular among young professionals and creatives.
Kensington and Chelsea postcode districts include: SW3, SW5, SW7, SW10, W8, W10, W11.
Kensington and Chelsea Property Prices
| Postcode | Average House Price £ | Average £ per sq ft | Average Rental Yield % |
|---|---|---|---|
| SW7 | £1,945,678 | £1,600 | 2.9% |
| W8 | £1,939,167 | £1,605 | 2.8% |
| SW10 | £1,834,567 | £1,500 | 3.0% |
| SW3 | £1,685,481 | £1,423 | 3.2% |
| SW5 | £1,224,567 | £1,350 | 3.1% |
| W11 | £1,213,074 | £1,438 | 3.8% |
| W10 | £746,372 | £978 | 4.3% |
Kensington and Chelsea Housing Market
| Postcode | Population | Density per square mile | Average Property Sales per Month |
|---|---|---|---|
| W10 | 33,583 | 40,421 | 9 |
| W11 | 31,356 | 37,410 | 14 |
| SW3 | 22,038 | 25,021 | 28 |
| W8 | 20,390 | 26,212 | 17 |
| SW7 | 19,640 | 17,625 | 26 |
| SW10 | 18,483 | 34,853 | 24 |
| SW5 | 15,207 | 48,960 | 22 |
Richmond upon Thames
Richmond upon Thames offers residents a blend of options and house styles, from new build off-plan apartments to Victorian terraces, as well as a rich heritage of historic houses. Richmond station provides District line and Overground services, reaching Victoria in 21 minutes. SW13 (Barnes) offers a village-like atmosphere near the river, with Barnes station connecting to Waterloo in 20 minutes via South Western Railway.
TW1 (Twickenham) is famous for its rugby stadium and riverside properties. Twickenham station offers a 23-minute journey to Waterloo. TW11 (Teddington) attracts families with its good schools and green spaces. Teddington station reaches Waterloo in 33 minutes, appealing to commuters seeking a balance between suburban living and city access. The vast Richmond Park, accessible from multiple areas in the borough, adds to the appeal for tenants seeking outdoor spaces.
Richmond upon Thames postcode districts include: SW13, SW14, TW1, TW2, TW9, TW10, TW11, TW12.
Richmond upon Thames Property Prices
| Postcode | Average House Price £ | Average £ per sq ft | Average Rental Yield % |
|---|---|---|---|
| SW13 | £1,187,654 | £1,200 | 3.6% |
| SW14 | £876,543 | £950 | 4.0% |
| TW10 | £823,456 | £900 | 4.1% |
| TW9 | £723,456 | £850 | 4.3% |
| TW11 | £623,456 | £750 | 4.5% |
| TW12 | £523,456 | £650 | 5.0% |
Richmond upon Thames Housing Market
| Postcode | Population | Density per square mile | Average Property Sales per Month |
|---|---|---|---|
| TW2 | 30,276 | 13,450 | 16 |
| TW1 | 26,065 | 16,831 | 14 |
| TW12 | 23,227 | 9,780 | 16 |
| TW11 | 23,198 | 9,486 | 14 |
| TW9 | 21,556 | 9,291 | 16 |
| TW10 | 19,291 | 3,372 | 12 |
| SW14 | 16,714 | 17,027 | 13 |
| SW13 | 15,873 | 10,569 | 11 |
Conclusion
From the bustling streets of Hammersmith to the leafy suburbs of Richmond, investors can find a market that aligns with their budget, strategy and long-term vision for growing a portfolio.
West London's diverse economy, from the tech hubs of White City to the aviation industry around Heathrow, underpins a robust rental market with exceptionally strong demand. Investors might consider tailoring their property choices to these specific tenant pools. For instance, properties in Hounslow (TW3, TW4, TW5) could target airport workers considering Houses of Multiple Occupation, while those in Hammersmith and Fulham (W6, W12) might appeal to young professionals in the media and tech sectors.
While high-value areas like Kensington and Chelsea (SW3, SW7, W8) offer prestige and consistently perform well for capital appreciation, investors shouldn't overlook the yields and growth potential in more affordable areas. Boroughs like Brent and Ealing offer a mix of property types and price points, allowing investors to diversify their portfolios.
In conclusion, West London's buy-to-let market has something for every size of investor. If you are new to property and have just completed an online property investment course, or if you are an established property developer, there is a London borough with a budget suitable for you.
To get a comprehensive view of London's buy-to-let market, be sure to explore our companion guides on North London, East London, and South London investment opportunities, which offer insights into the unique characteristics and potential of each region.
