
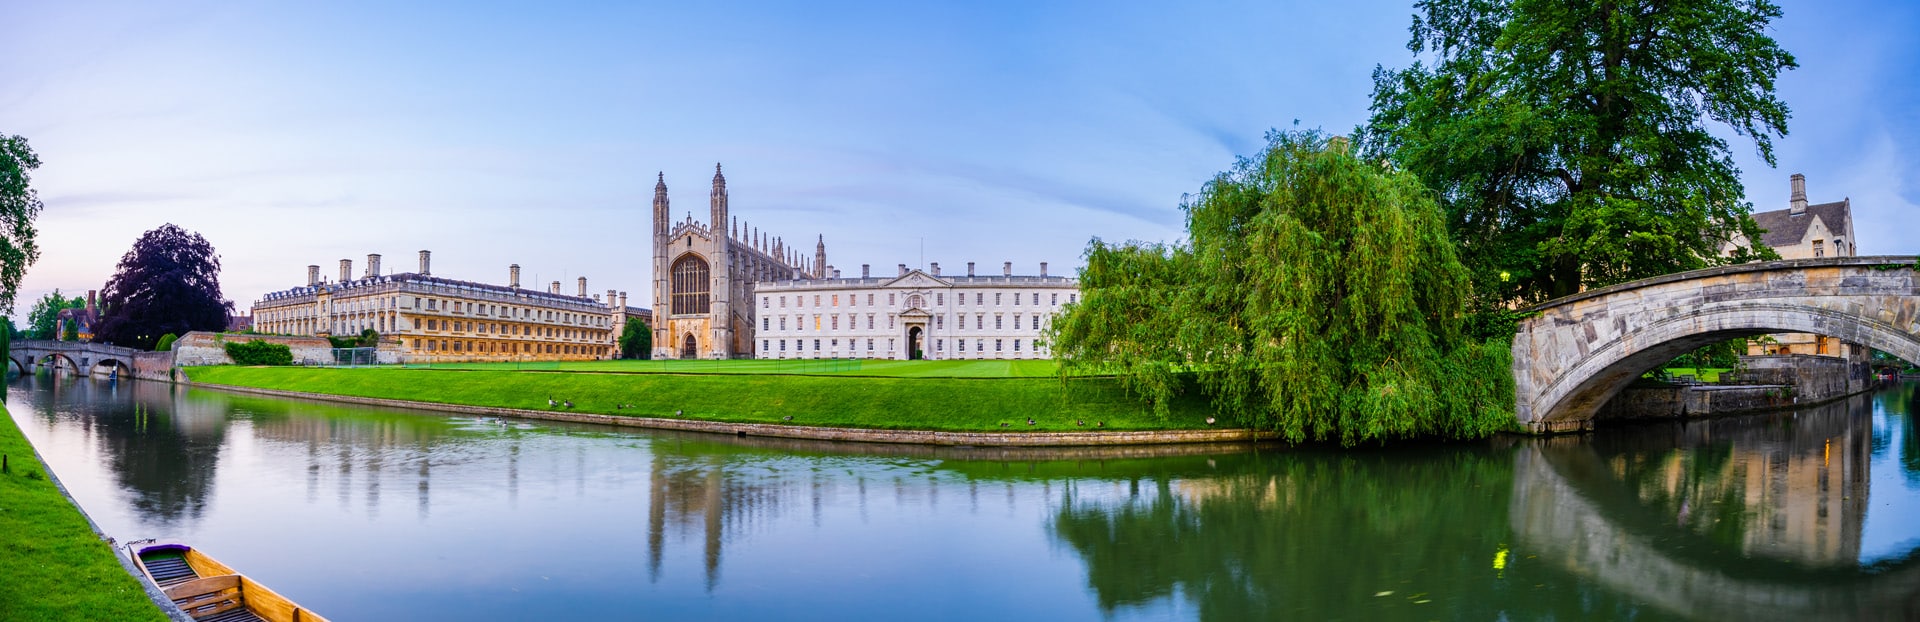
Cheapest Places to Buy a House or Flat in and Around Cambridge
The cheapest place to buy a house or flat in and around Cambridge is Haverhill (CB9), a Suffolk town in the West Suffolk council area, where the average asking price is £328,698. Of the five city districts, the lowest average is £426,274, in CB4, the north Cambridge district of Arbury, King's Hedges and Chesterton. Flats and houses are in both figures. About three homes in ten in CB4 are flats, and about one in thirty in Haverhill's district.
If you came for the cheapest areas in Cambridge, which of those two answers is yours depends on whether it has to be the city. All 16 districts of the CB postcode area are ranked here. CB1 to CB5 cover the city. The other 11 cover separate towns and villages, among them Ely, Newmarket, Haverhill and Saffron Walden, most of them in Cambridgeshire, Suffolk or Essex. The four cheapest of the 16 are all outside Cambridge.
Article published: September 2026
For the cheapest places to live in Cambridge, these prices are only part of the answer. They are average prices for homes that were for sale or that sold. Rent, bills and travel are not in them, and nothing here measures how far Haverhill or Ely is from the city or how long the journey takes.
Where the Cheapest Areas in and Around Cambridge Are
The shading shows each district's average asking price band, houses and flats together, August 2026. All 16 districts are in the ranking table further down. Tap a district to see its figure.
The map will load as it approaches the viewport.
- Below £400,000
- £400,000 to £449,999
- £450,000 to £499,999
- £500,000 to £574,999
- £575,000 and above
- No asking-price figure
Sources: PropertyData postcode key stats, August 2026; District boundaries derived from OS Code-Point Open: contains Ordnance Survey data © Crown copyright and database right 2026, Royal Mail data © Royal Mail copyright and database right 2026, National Statistics data © Crown copyright and database right 2026; District coverage names from the Wikipedia CB postcode area list, CC BY-SA 4.0.
The city's five districts are the small group at the centre. North Cambridge (CB4), with Arbury, King's Hedges and Chesterton, is the one city district with an average asking price under £450,000. Cherry Hinton is in CB1, the central and south district, and Trumpington is in CB2. CB3 is the north-west of the city with Girton, and CB5 is the east.
To the north are the two Ely districts. The west of Ely shares CB6 with Littleport, Sutton and Haddenham, and the east and centre of Ely share CB7 with Soham, Fordham and Isleham. Closer in on the same side, Histon, Impington, Cottenham and Northstowe are in CB24, and Waterbeach, Burwell and Bottisham in CB25.
Newmarket (CB8) is out to the east and Haverhill (CB9) to the south-east. Between Haverhill and the city is CB21, the district of Fulbourn, Linton and Balsham. The four districts with an average under £400,000 are all on the outer edge of the map. They are Ely's two to the north, Newmarket's to the east and Haverhill's to the south-east.
South of the city, Great Shelford, Sawston and Duxford are in CB22. Beyond them are Saffron Walden's two districts, CB10 and CB11, which are the dearest of the 16. To the west there is CB23, which takes in Great, Lower and Upper Cambourne, Bar Hill and Papworth Everard.
Cheapest Places to Buy a House in and Around Cambridge: All 16 Districts Ranked
The table runs from the lowest average asking price to the highest, on August 2026 data, with flats and houses in one average. The five rows marked "city of Cambridge" are the city's districts. Every other row is a different town or a group of villages.
Census housing stock figures retrieved in June and September 2026 put flats at between 24% and 39% of the homes in the five city districts and under 10% in each of the other 11. That is a count of the homes that exist, and it does not say what was advertised.
The last column is the average buyers paid per square foot, mostly for sales between February 2025 and June 2026. Asking prices are for homes listed in August 2026, which are different homes.
| Rank | Postcode and areas covered | Average asking price | Sold price per sq ft |
|---|---|---|---|
| 1 | CB9: Haverhill, Kedington, Steeple Bumpstead | £328,698 | £317 |
| 2 | CB7: Ely (east and city centre), Soham, Fordham | £350,587 | £325 |
| 3 | CB6: Ely (west), Littleport, Sutton, Haddenham | £366,449 | £322 |
| 4 | CB8: Newmarket, Exning, Cheveley, Kentford | £396,568 | £330 |
| 5 | CB4: Cambridge North, including Arbury, King's Hedges and Chesterton (city of Cambridge) | £426,274 | £506 |
| 6 | CB24: Histon, Impington, Cottenham, Northstowe | £445,593 | £394 |
| 7 | CB25: Waterbeach, Burwell, Bottisham | £457,317 | £378 |
| 8 | CB23: Great, Lower and Upper Cambourne, Bar Hill, Papworth Everard | £470,318 | £374 |
| 9 | CB5: Cambridge East (city of Cambridge) | £486,502 | £498 |
| 10 | CB1: Cambridge Central and South, including Cherry Hinton (city of Cambridge) | £496,952 | £561 |
| 11 | CB2: Cambridge West, including Trumpington (city of Cambridge) | £505,052 | £534 |
| 12 | CB22: Great Shelford, Sawston, Duxford, Whittlesford | £567,311 | £447 |
| 13 | CB21: Fulbourn, Linton, Balsham, Abington | £590,098 | £399 |
| 14 | CB3: Cambridge North-West, Girton (city of Cambridge) | £593,235 | £575 |
| 15 | CB11: Saffron Walden (south), Newport, Clavering | £601,161 | £416 |
| 16 | CB10: Saffron Walden (north and town centre), Great Chesterford | £632,474 | £426 |
The sold-price column draws on sold-price-per-square-foot data retrieved in August 2026 for 15 of the districts. Haverhill's figure is a month newer and covers sales from March 2025 to July 2026, so a gap of a few pounds between Haverhill and the rows under it tells you nothing.
Even the five city districts are not all city. On Ordnance Survey's Code-Point Open postcode counts, about 12% of the postcodes in CB1 to CB5 are outside the Cambridge council area, and all of those are in South Cambridgeshire. The north-west district, CB3, has the biggest share outside, 117 of its 418 postcodes, and CB2 the smallest, 22 of 588.
The other rows cross council lines as well. Ely's two districts are almost entirely in East Cambridgeshire, though six of CB6's 923 postcodes are over the Norfolk border, in King's Lynn and West Norfolk. Waterbeach and Burwell's CB25 is split, with 251 of its 428 postcodes in East Cambridgeshire and the rest in South Cambridgeshire. Newmarket's district has 773 of its 1,074 postcodes in West Suffolk and 280 in East Cambridgeshire. Haverhill's is mostly in West Suffolk, with 96 of its 843 postcodes in Braintree, which is in Essex.
Haverhill, Ely and Newmarket fill the four cheapest rows, and none of them is in Cambridge
Haverhill's district has the lowest average asking price of the 16 at £328,698. Ely's two districts follow at £350,587 and £366,449, and Newmarket's is fourth at £396,568. Each is a separate town. Haverhill and most of Newmarket's district are in Suffolk. Ely, Soham and Littleport are in East Cambridgeshire, and rents and yields for Ely's two districts are in our Ely guide.
Buyers paid much the same per square foot in all four, between £317 and £330 on average. Inside each district the range was far wider. In Haverhill's, 507 sales ran from £119 a square foot to £566, and in Newmarket's, 657 sales ran from £119 to £688.
North Cambridge's CB4 is the cheapest city district, £97,576 above Haverhill
The north Cambridge district is fifth in the table and first among the city's five. East Cambridge (CB5), the next city district, is £60,228 higher. On asking price north Cambridge is £29,706 above Newmarket's district, and that is where the two columns part company. Buyers in north Cambridge paid an average of £506 per square foot, against £330 in Newmarket's district. £506 is the fourth highest figure of the 16, and it is higher than in any of the other 11 districts.
The five highest averages per square foot are the five city districts, from £498 in east Cambridge to £575 in the north-west district, CB3. The highest figure among the other 11 districts is £447, in Great Shelford and Sawston's, which leaves a gap of £51. On asking price the same five are scattered from fifth to fourteenth.
In my experience property deals drag, and some fall through. The per-square-foot column only holds sales that went through. The asking-price column is what sellers were asking in August, whether or not a sale followed.
Buyers in Histon and Cottenham's CB24 paid £112 less per square foot than in north Cambridge
Histon, Impington and Cottenham's district is the next row down from north Cambridge, at £445,593, which is £19,319 more. Flats are 7% of its homes and 31% of north Cambridge's, and both averages take in every kind of home. If you are weighing a city address against the villages of CB24, the two rows are neighbours on asking price. On the average paid per square foot they are £112 apart, £394 against £506.
Fulbourn's CB21 asks £3,137 less than north-west Cambridge, and buyers paid £176 less per square foot
Fulbourn, Linton and Balsham's district and north-west Cambridge with Girton (CB3) sit next to each other in the table at £590,098 and £593,235. In the sold-price column they are far apart, £399 a square foot against £575, which is the highest of the 16. Flats are 4% of the homes in Fulbourn's district and 24% in CB3. How big the homes were is not in either column. Two districts asked about the same on average, and buyers paid very different amounts per square foot.
Saffron Walden's two districts have the highest average asking prices of the 16
Saffron Walden's northern district (CB10) has the highest average of the 16, £632,474. That is £303,776 above Haverhill's and not far short of twice it. The southern district (CB11) is next at £601,161. Both are above every city district on asking price.
Per square foot it is the other way round. Buyers paid £426 and £416 on average, below all five city districts. Both districts are almost entirely in Uttlesford, in Essex, though 34 of the northern district's 577 postcodes are in South Cambridgeshire.
What a single house sold for is free to look up
Neither column is the price of a particular house. A street, a house type and the state of the building can put a price a long way from its district's average. To see what single homes went for on a street you have in mind, HM Land Registry runs a free price paid search with filters for postcode, property type and date.
Investors will want the rent as well. Our Cambridge buy-to-let guide covers ten of these districts, the city's five and the village districts CB21 to CB25. It has rents and yields for eight of them and says "Not enough data" for CB21 and CB25.
Are There Houses for Sale in Cambridge Under £100k?
On average asking prices, nowhere in the CB postcode area comes close to £100,000. The lowest of the 16 is Haverhill's £328,698, more than three times that budget, and the lowest of the five city districts is north Cambridge's £426,274. An average asking price describes a district. It cannot rule out a single listing, and it counts flats and houses together.
Sold prices by property type do not get there either. On the July 2026 UK House Price Index, a flat in the Cambridge council area averaged £298,575. The lowest flat average among the six council areas compared further down was West Suffolk's £144,735, with Huntingdonshire at £148,544. The lowest terraced average was West Suffolk's £229,882.
If £100,000 is your whole budget, the averages that low are in other parts of the country. Our research on the cheapest houses in England ranks postcode districts by average sold price, not asking price. Of the 19 English districts it has under £100,000, not one is in the East of England. The lowest East of England district in that research is Great Yarmouth's NR30, at £172,928.
For one cheap home near Cambridge, a portal search with a price ceiling and a postcode district will show you what is listed this week, which no average can. Our buy to let property for sale page does a different job and is written for investors. The homes on it come from across the UK, and there is no promise that any of them is near Cambridge.
Cheap for the area and cheap for the house are not the same. With below market value properties the comparison is with what that one home would normally fetch, so one can turn up in north-west Cambridge, the dearest city district, as well as in Haverhill.
How Affordable Are Cambridge's Cheapest Areas?
The lowest price to household income ratio of the 16 is 7.0 times, in Ely east and Soham's district (CB7), with Haverhill's at 7.1. The highest is 11.2 times, in Saffron Walden's northern district (CB10). The five city districts run from 7.7 times in north Cambridge to 10.0 in the north-west.
The income column is an area average (household income figures retrieved in September 2026), and it is for households, with the income of everyone in the home added together. It is not one person's pay and it is not how a lender works out a loan.
Pay is published for the whole council area and not by postcode district. The median for full-time workers living in Cambridge was £867 a week before tax in 2025, on the Nomis labour market profile for the city. For the East, the official region Cambridge is in, it was £805.
| Rank | Postcode and areas covered | Average asking price | Household income | Price to household income |
|---|---|---|---|---|
| 1 | CB9: Haverhill, Kedington, Steeple Bumpstead | £328,698 | £46,400 | 7.1x |
| 2 | CB7: Ely (east and city centre), Soham, Fordham | £350,587 | £50,100 | 7.0x |
| 3 | CB6: Ely (west), Littleport, Sutton, Haddenham | £366,449 | £50,000 | 7.3x |
| 4 | CB8: Newmarket, Exning, Cheveley, Kentford | £396,568 | £48,200 | 8.2x |
| 5 | CB4: Cambridge North, including Arbury, King's Hedges and Chesterton (city of Cambridge) | £426,274 | £55,300 | 7.7x |
| 6 | CB24: Histon, Impington, Cottenham, Northstowe | £445,593 | £57,900 | 7.7x |
| 7 | CB25: Waterbeach, Burwell, Bottisham | £457,317 | £54,600 | 8.4x |
| 8 | CB23: Great, Lower and Upper Cambourne, Bar Hill, Papworth Everard | £470,318 | £58,900 | 8.0x |
| 9 | CB5: Cambridge East (city of Cambridge) | £486,502 | £51,600 | 9.4x |
| 10 | CB1: Cambridge Central and South, including Cherry Hinton (city of Cambridge) | £496,952 | £60,400 | 8.2x |
| 11 | CB2: Cambridge West, including Trumpington (city of Cambridge) | £505,052 | £64,500 | 7.8x |
| 12 | CB22: Great Shelford, Sawston, Duxford, Whittlesford | £567,311 | £59,700 | 9.5x |
| 13 | CB21: Fulbourn, Linton, Balsham, Abington | £590,098 | £57,100 | 10.3x |
| 14 | CB3: Cambridge North-West, Girton (city of Cambridge) | £593,235 | £59,600 | 10.0x |
| 15 | CB11: Saffron Walden (south), Newport, Clavering | £601,161 | £55,400 | 10.9x |
| 16 | CB10: Saffron Walden (north and town centre), Great Chesterford | £632,474 | £56,500 | 11.2x |
Even in Haverhill and Ely the price to household income ratio is about seven times
The three cheapest districts also have the three lowest ratios, 7.0, 7.1 and 7.3 times. Their household incomes are among the lowest in the table as well, between £46,400 and £50,100. No district in the table comes out below 7.0 times household income.
Trumpington's CB2 asks £108,484 more than Newmarket and has a lower price to household income ratio
Households in Trumpington's district average £64,500, the highest figure of the 16, and the district's ratio is 7.8 times. Newmarket's district is fourth cheapest on asking price and comes out at 8.2 times, because its households average £48,200, the second lowest in the table. If you are moving into either district, the ratio sets the district's average household income against August's asking prices. It says nothing about yours.
East Cambridge's price to household income ratio is 9.4, on the city's lowest household income
East Cambridge (CB5) and the central and south district (CB1) are neighbours in the table at £486,502 and £496,952, which is £10,450 apart. Their ratios are 9.4 and 8.2 times. Household income is £51,600 in the east, below the other four city districts, and £60,400 in the central one. With the central district's household income the eastern district's ratio would be 8.1 times, so the gap comes from income and not from price. The highest ratios of all are at the dear end of the table, above ten times in Fulbourn's district and in both of Saffron Walden's.
First-Time Buyers in Cambridge: Prices and Deposits by Property Type
In the Cambridge council area a flat averaged £298,575 on July 2026 sold prices and a terraced house £493,851. That is £195,276 more. If you are buying your first home in the city, that is the gap between the two cheapest types. The next gap is smaller, £109,374 from a terrace to a semi-detached house.
These are the city's own figures, and they matter here because 11 of the 16 ranked districts are not city districts. Flats and terraces in the council areas around the city are priced in the table after this one.
They are also a different measure from the ranking. The ranking uses asking prices for postcode districts in August 2026. These are sold prices for a whole council area a month earlier, from the UK House Price Index, which is a monthly estimate built from registered sales.
What deposit you put down is between you and your lender. Every deposit in the table uses the same 30% purely for illustration; it is not a lender's requirement. At 30%, the illustrative deposit on the average Cambridge flat is £89,572, and on the average terrace it is £58,583 more. The tax bill is separate from the deposit, and you can work it out for any of these prices with our stamp duty calculator.
| Cambridge property type | Average sold price | Illustrative 30% deposit |
|---|---|---|
| Flats | £298,575 | £89,572 |
| Terraced | £493,851 | £148,155 |
| Semi-detached | £603,225 | £180,968 |
| Detached | £979,438 | £293,831 |
| All property types | £475,151 | £142,545 |
The average Cambridge terraced house sold for more than the city's all-types average
Cambridge's headline average is £18,700 below its terraced average. Flats are the one type below the headline figure, by £176,576. If you see "average house price in Cambridge, £475,151" and picture a terraced house, the terraced average was £493,851.
A Cambridge flat averaged £108,447 more than a flat across the East of England
Flats in the East of England averaged £190,128 in July 2026 and flats in England £217,362. Cambridge's £298,575 was 57% above the regional figure. Across all property types the city was 41% above the East of England average of £337,518 and 62% above England's £293,479.
Cambridge's average moved £32 in a year, with flats down 2.3%
The all-types average barely moved over the year. It was £475,119 in July 2025 and £475,151 in July 2026, which the index rounds to 0.0%. Inside that, flats averaged 2.3% less, or £7,070. Terraced houses averaged 0.9% more, semi-detached houses 1.3% more and detached houses 0.8% more. Flats were lower across England too, by 3.5%.
Each of those is one year's change, measured in July 2026, and none of them says anything about the year after. The UK House Price Index methodology says its first estimate for a month is calculated on around 40% of the sales that will eventually be registered, so the latest months get revised as the rest come in.
How Cambridge Compares With the Council Areas Around It
Cambridge had the highest average sold price for flats, terraced houses, semi-detached houses and detached houses of the six council areas compared here. Across all property types it averaged £475,151 in July 2026, above four of the other five, and Uttlesford was £1,178 higher.
The table compares six council areas on sold prices. It is not the ranking regrouped. Each average covers the whole of that council area, whether or not it has a CB postcode. South Cambridgeshire is the only council area that touches the city, and it goes all the way round it. The village districts CB21 to CB24 are almost entirely inside it. East Cambridgeshire has Ely, Soham and Littleport, and West Suffolk, over the county line, has Newmarket and Haverhill. Uttlesford is in Essex and its council is based in Saffron Walden.
Huntingdonshire is the odd one in the table. No CB postcode falls in it, so none of its towns is in the ranking. It is here for comparison as another Cambridgeshire council area, and its largest towns are St Neots, Huntingdon and St Ives.
| Council area | All property types | Flats | Terraced houses |
|---|---|---|---|
| West Suffolk | £294,810 | £144,735 | £229,882 |
| Huntingdonshire | £308,374 | £148,544 | £241,309 |
| East Cambridgeshire | £346,413 | £171,057 | £276,548 |
| South Cambridgeshire | £439,573 | £199,495 | £329,171 |
| Cambridge | £475,151 | £298,575 | £493,851 |
| Uttlesford | £476,329 | £204,588 | £368,897 |
Each figure is an average for a whole council area, so West Suffolk's is not a price for Haverhill and East Cambridgeshire's is not a price for Ely. Cambridgeshire as a whole averaged £339,095.
A Cambridge terrace averaged more than a detached house in East Cambridgeshire, Huntingdonshire or West Suffolk
The city's terraced average of £493,851 was above the detached average in three of the five other council areas. Detached houses averaged £493,382 in East Cambridgeshire, £483,535 in Huntingdonshire and £449,433 in West Suffolk. It was above England's detached average of £474,626 too. South Cambridgeshire and Uttlesford were the two where a detached house averaged more than a Cambridge terrace, at £636,197 and £733,292.
South Cambridgeshire, which surrounds the city, averaged £99,080 less for a flat
Across all property types the gap between Cambridge and South Cambridgeshire was £35,578. For a single property type it was much wider. Flats averaged £199,495 in South Cambridgeshire, and terraced houses £329,171, which is £164,680 less than in the city. For a detached house the gap was £343,241.
The asking prices in the ranking show the same thing. The districts of Histon, Cottenham and the Cambournes have lower average asking prices than four of the five city districts, and buyers there paid at least £100 less per square foot on average than in any of the five.
Uttlesford is £1,178 above Cambridge for all homes and £246,146 below it for a detached house
Saffron Walden's council area is the one row above the city. Yet a detached house there averaged £733,292 against Cambridge's £979,438, and Uttlesford's flats and terraces were £93,987 and £124,954 below the city's. The all-types average is the one measure of the five on which Uttlesford comes out above Cambridge.
East Cambridgeshire rose 5.8% in a year and Cambridge 0.0%
East Cambridgeshire's all-types average was 5.8% higher in July 2026 than in July 2025. Huntingdonshire rose 3.1%, South Cambridgeshire 2.2%, Uttlesford 1.7% and West Suffolk 0.3%, with Cambridge at 0.0%. Flats averaged less than a year earlier in four of the six, which were Cambridge, South Cambridgeshire, West Suffolk and Uttlesford. Every one of those six readings comes from the newest month of the index, which is still a first estimate.
Cambridge rents and yields are in a separate guide
Nothing on this page says what a home lets for. If you are buying to let, our Cambridge buy-to-let guide puts rents and yields beside prices for the city's five districts and for CB22, CB23 and CB24. We have no guide to Haverhill, Newmarket or Saffron Walden. Our cheapest place to buy a house in Manchester page ranks that city's districts the same way.
We also help investors find investment properties. That work covers the whole UK and is not tied to Cambridge or to any district in these tables.
Contains HM Land Registry data © Crown copyright and database right 2020. This data is licensed under the Open Government Licence v3.0.
Frequently Asked Questions
What is the cheapest area of Cambridge to buy a house?
Of the five city districts it is CB4, the north Cambridge district that takes in Arbury, King's Hedges and Chesterton, where the average asking price is £426,274. About three homes in ten there are flats, and flats are in the average along with houses. Take all 16 and the lowest average in the CB postcode area is £328,698 in Haverhill (CB9), a town in the West Suffolk council area and not part of Cambridge. Ely's two districts and Newmarket's are also below CB4.
Can you buy a house in Cambridge for under £100,000?
The averages are a long way above it. The lowest average asking price of the 16 CB districts is £328,698 in Haverhill's, and the lowest of the five city districts is £426,274 in north Cambridge's CB4. On July 2026 sold prices a Cambridge flat averaged £298,575, and the lowest flat average of the six council areas on this page was West Suffolk's £144,735. An average describes an area, so it cannot tell you that no single home is listed for less.
What is the average house price in Cambridge?
£475,151 in July 2026, which is the UK House Price Index's all-property-types average for the Cambridge council area. Only flats came in under that, at £298,575. A terraced house averaged £493,851, a semi-detached house £603,225 and a detached house £979,438. The ranking on this page is a different measure, average asking prices by postcode district, and only five of its 16 districts are city districts.
Is Cambridge cheaper than Oxford?
Not on July 2026 sold prices, though the two were close. Setting one council area against the other, Cambridge averaged £475,151 and Oxford £471,667, a gap of £3,484. Cambridge was higher for each property type as well, by £11,680 for flats and £31,624 for terraced houses. A year earlier it was the other way round, with Oxford at £482,879 and Cambridge at £475,119. We have ranked the cheapest postcodes in Oxford and the towns around it on the same measures as this page.
Are house prices rising in Cambridge?
Over the year to July 2026 the council-area average was flat, at 0.0%. Flats averaged 2.3% less than a year earlier, and each type of house about 1% more. July is the newest month in the index, and new months move. Under the UK House Price Index methodology, a month is worked out again as more of its sales reach the register.
Which towns near Cambridge are cheaper?
Haverhill, Ely and Newmarket, going by average asking prices for their postcode districts in August 2026. Haverhill's averaged £328,698, Ely's two £350,587 and £366,449 and Newmarket's £396,568, all below the cheapest city district at £426,274. Sold prices for whole council areas in July 2026 point the same way, with West Suffolk at £294,810, Huntingdonshire £308,374 and East Cambridgeshire £346,413 against Cambridge's £475,151. A council-area figure is not a price for any one town in it.
Which CB postcodes are actually in Cambridge?
CB1 to CB5 cover the city. Ordnance Survey's counts put 2,950 of those five districts' 3,347 postcodes inside the Cambridge council area, and the rest are in South Cambridgeshire. CB2 is the most complete, with 566 of 588 inside, and CB3 the least, with 301 of 418. Eight more city postcodes fall in CB21, CB22, CB23 and CB24. The other districts, from Ely's CB6 to Haverhill's CB9 and Saffron Walden's CB10 and CB11, have no postcodes in the city.
Ready to buy property?
Browse investment properties with prices and gross yields shown for each opportunity.
Get property alerts