Top 20 Cheapest Places To Buy A House In England & The UK (2025 Edition)
Using the latest HM Land Registry sold house prices and current asking prices from estate agents and UK property portals, we've identified the UK's 20 most affordable locations where buyers can find exceptional value.
The cheapest 20 postcodes to buy a property in the UK is split evenly between England and Scotland, with 10 postcodes each in the list. There are zero postcodes in Wales (the cheapest postcode in Wales only comes in at number 30).
So for those investors looking for a bargain property in England, the lowest priced buy to lets can be found in Sunderland. The SR1 postcode with average asking prices of only £64,665 - making it 76% below the UK's average house price of £269,735.
For property buyers looking for the cheapest postcode in the UK, the lowest priced houses can be found near Glasgow in Scotland. With the PA15 postcode average property prices of only £55,726. making it a staggering 79% below the UK's average house prices.
While England remains the UK's most expensive nation for property with an average house price of £291,852, there are still some below market value properties to be found if you have an experienced property investment company finding you the best opportunities. Our research reveals eight areas across England with average property prices under £100,000. These locations offer affordability ratios as low as 2.13x - meaning properties cost just over twice the average local household annual income. This compares favourably to the UK's national average affordability ratio of 7.1x, where homes cost more than seven times annual earnings.
For those interested in affordable areas within major cities, explore our dedicated guides: cheapest places to live in Manchester, most affordable postcodes in Birmingham, lowest house prices in London, and Wales' cheapest locations.
Data last updated: October 2025
UK's Most Affordable Property Markets 2025
Analysis of the UK's 20 cheapest property locations reveals exceptional value across England and Scotland, with asking prices ranging from £55,726 to £106,440 - representing 59% to 79% below the UK's average house price of £269,735.
- UK's cheapest locations: £55,726 (PA15, Scotland) to £106,440 (PA3, Scotland) across the UK's 20 most affordable postcodes
- England's cheapest locations: £64,665 (SR1, Sunderland) to £119,595 (LA18, Millom) with 10 English postcodes in the UK top 20
- Affordability ratios: Cheapest England & UK locations range from 2.13x to 3.79x annual household income, significantly below the UK average of 7.1x
- Regional breakdown: UK split - 10 Scotland locations, 10 England locations (North East dominates English locations with 7 entries) 0 Wales locations in the top 20
Contents

-
by Robert Jones, Founder of Property Investments UK
With two decades in UK property, Rob has been investing in buy-to-let since 2005, and uses property data to develop tools for property market analysis.
Property Data Sources
Our location guide relies on diverse, authoritative datasets including:
- HM Land Registry UK House Price Index
- Ministry of Housing, Communities and Local Government
- Ordnance Survey Data Hub
- Propertydata.co.uk
We update our property data quarterly to ensure accuracy. Last update: October 2025. All data is presented as provided by our sources without adjustments or amendments.
Cheapest Houses in England
| Rank | Area | Average Asking Price | Price Trend |
|---|---|---|---|
| 1 | SR1 (Sunderland) | £64,665 | ↓ Declining |
| 2 | BD1 (Bradford) | £68,334 | ↑ Steady Rise |
| 3 | DN31 (Grimsby) | £79,052 | ↓ Recent Decline |
| 4 | TS1 (Middlesbrough) | £79,442 | ↓ Sharp Decline |
| 5 | DL4 (Shildon) | £83,572 | ↓ Declining |
| 6 | NE17 (Chopwell) | £86,075 | ↓ Sharp Drop |
| 7 | TS3 (Middlesbrough) | £86,350 | ↓ Declining |
| 8 | SR8 (Peterlee) | £91,042 | ↓ Declining |
| 9 | DL14 (Bishop Auckland) | £103,294 | ↓ Declining |
| 10 | TS4 (Middlesbrough) | £105,727 | ↓ Sharp Decline |
| 11 | HU1 (Hull City Centre) | £107,992 | ↓ Declining |
| 12 | HU2 (Hull) | £108,031 | ↑ Recent Spike |
| 13 | FY1 (Blackpool) | £111,386 | ↓ Declining |
| 14 | DN32 (Grimsby) | £111,975 | → Stable |
| 15 | TS24 (Hartlepool) | £113,690 | ↓ Declining |
| 16 | CH41 (Birkenhead) | £116,426 | ↓ Declining |
| 17 | HU3 (Hull) | £116,951 | ↓ Sharp Decline |
| 18 | L20 (Liverpool) | £117,729 | ↓ Declining |
| 19 | HU9 (Hull East) | £117,806 | ↓ Declining |
| 20 | LA18 (Millom) | £119,595 | ↓ Sharp Decline |
Cheapest Property Prices Across The UK
| Rank | Area | Average Asking Price | Price Trend |
|---|---|---|---|
| 1 | PA15 (Port Glasgow, Scotland) | £55,726 | ↓ Declining |
| 2 | KA16 (Stevenston, Scotland) | £55,932 | ↓ Declining |
| 3 | SR1 (Sunderland, England) | £64,665 | ↓ Declining |
| 4 | BD1 (Bradford, England) | £68,334 | ↑ Steady Rise |
| 5 | KA20 (Stevenston, Scotland) | £77,094 | → Steady |
| 6 | DN31 (Grimsby, England) | £79,052 | ↓ Recent Decline |
| 7 | TS1 (Middlesbrough, England) | £79,442 | ↓ Sharp Decline |
| 8 | KA8 (Ardrossan, Scotland) | £80,667 | ↓ Declining |
| 9 | DL4 (Shildon, England) | £83,572 | ↓ Declining |
| 10 | NE17 (Chopwell, England) | £86,075 | ↓ Sharp Drop |
| 11 | TS3 (Middlesbrough, England) | £86,350 | ↓ Declining |
| 12 | AB11 (Aberdeen, Scotland) | £90,303 | → Steady |
| 13 | SR8 (Peterlee, England) | £91,042 | ↓ Declining |
| 14 | KA17 (Dalry, Scotland) | £92,653 | ↓ Declining |
| 15 | AB24 (Aberdeen, Scotland) | £100,054 | → Steady |
| 16 | AB25 (Aberdeen, Scotland) | £101,761 | → Steady |
| 17 | G21 (Glasgow, Scotland) | £103,095 | ↑ Steady Rise |
| 18 | DL14 (Bishop Auckland, England) | £103,294 | ↓ Declining |
| 19 | TS4 (Middlesbrough, England) | £105,727 | ↓ Sharp Decline |
| 20 | PA3 (Paisley, Scotland) | £106,440 | → Steady |
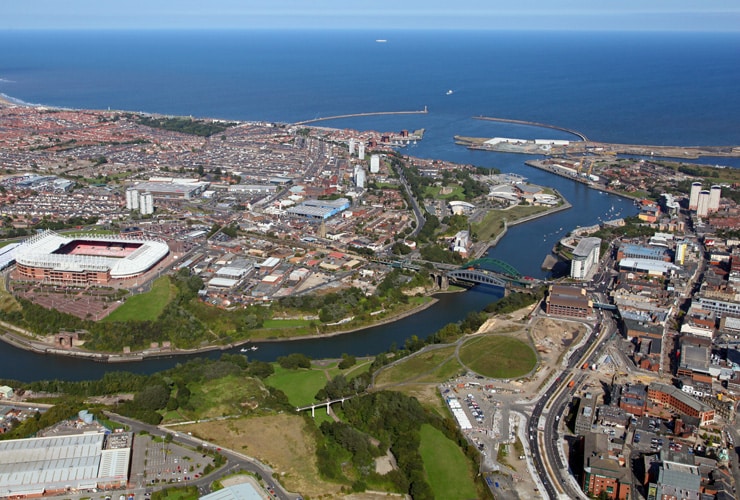
England's Cheapest Priced Areas Under £100,000
1. SR1 - Sunderland City Centre
Sunderland city centre ranks as England's cheapest location in 2025, with average asking prices of £64,665. This represents exceptional value at 78% below England's average house price of £291,852. Historical price analysis shows significant volatility since 2019, with prices declining from recent peaks, presenting potential opportunities in the current market.
Property Price Metrics in SR1
- Average Asking Price: £64,665
- Average Household Income: £30,300
- Affordability Ratio: 2.13x
- Price Trend: Declining from recent peaks
2. BD1 - Bradford City Centre
Bradford city centre emerges as England's second cheapest location, with current asking prices at £68,334. Price analysis shows consistent upward momentum from 2019 levels around £55,000, with steady growth through 2024-2025, though properties remain highly affordable at 77% below England's average.
Property Price Metrics in BD1
- Average Asking Price: £68,334
- Average Household Income: £26,300
- Affordability Ratio: 2.60x
- Price Trend: Steady rise since 2019
3. DN31 - Grimsby
Grimsby's DN31 postcode demonstrates recent price adjustments, with current asking prices at £79,052. The area shows a clear upward trajectory from £65,000 in 2019 to peaks around £90,000, before settling at current levels, maintaining affordability at 73% below England's average.
Property Price Metrics in DN31
- Average Asking Price: £79,052
- Average Household Income: £26,700
- Affordability Ratio: 2.96x
- Price Trend: Recent decline from peaks
4. TS1 - Middlesbrough City Centre
Central Middlesbrough has experienced significant growth followed by recent correction, reaching £79,442. The area demonstrates a sharp decline from 2024 peaks near £95,000, having previously shown strong appreciation from £55,000 in 2019, while remaining 73% below England's average.
Property Price Metrics in TS1
- Average Asking Price: £79,442
- Average Household Income: £27,100
- Affordability Ratio: 2.93x
- Price Trend: Sharp decline from 2024 peaks
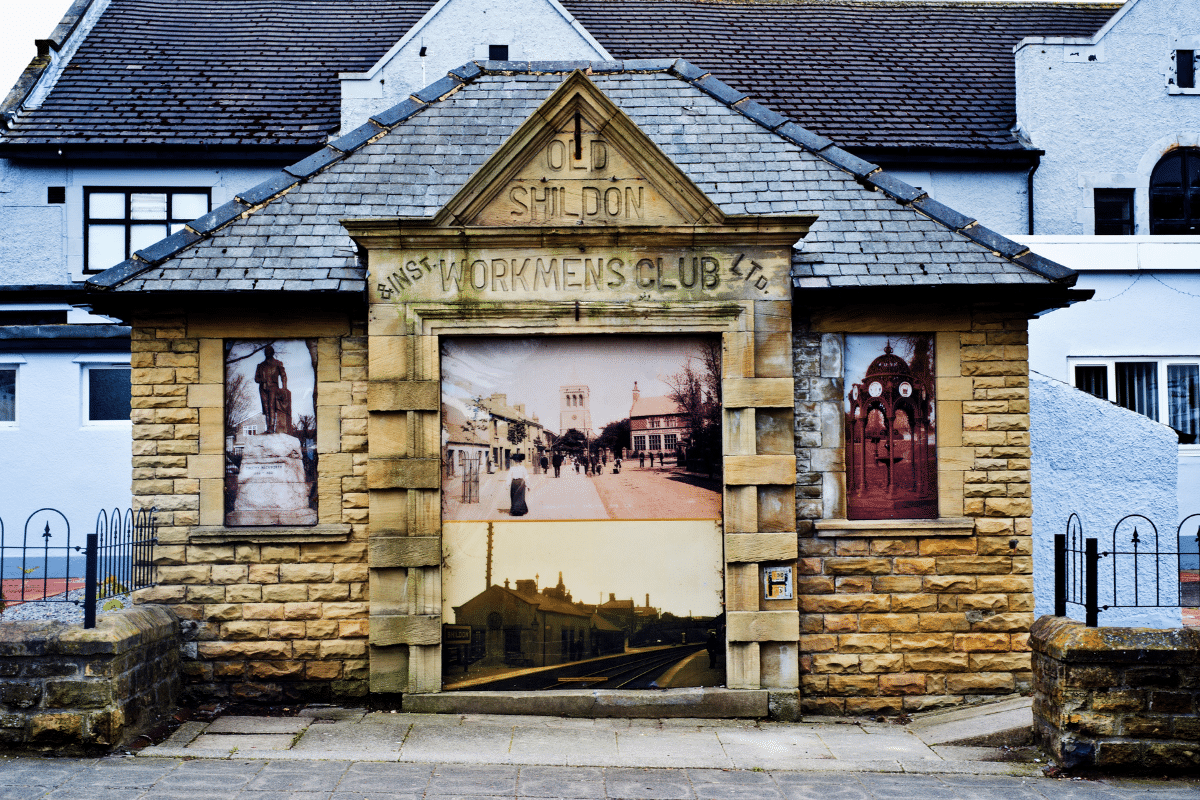
5. DL4 - Shildon
Shildon shows recent price adjustments with asking prices at £83,572. Historical analysis reveals a spike to £105,000 in late 2024 before declining to current levels, having maintained relatively stable prices around £70,000-£85,000 through most of the period since 2019.
Property Price Metrics in DL4
- Average Asking Price: £83,572
- Average Household Income: £30,200
- Affordability Ratio: 2.77x
- Price Trend: Declining from 2024 spike
6. NE17 - Chopwell, Gateshead
Chopwell in Gateshead near Newcastle demonstrates significant recent price movements, with current asking prices at £86,075. The area experienced dramatic volatility including sharp drops to near-zero levels (data anomalies), with recent trends showing steep decline from peaks around £160,000, though maintaining strong affordability ratios.
Property Price Metrics in NE17
- Average Asking Price: £86,075
- Average Household Income: £36,500
- Affordability Ratio: 2.36x
- Price Trend: Sharp drop from recent peaks
7. TS3 - Middlesbrough
Middlesbrough's TS3 postcode shows declining prices at £86,350. The area peaked near £98,000 in late 2024 before recent correction, having shown steady appreciation from £70,000 levels in 2019, while remaining 70% below England's average house price.
Property Price Metrics in TS3
- Average Asking Price: £86,350
- Average Household Income: £28,600
- Affordability Ratio: 3.02x
- Price Trend: Declining from 2024 peaks
8. SR8 - Peterlee
Peterlee rounds out England's sub-£100,000 locations at £91,042. Price trends show recent decline from peaks above £105,000 in late 2024, having demonstrated volatility throughout the period with a general upward trend from £70,000 in 2019 before recent correction.
Property Price Metrics in SR8
- Average Asking Price: £91,042
- Average Household Income: £32,100
- Affordability Ratio: 2.84x
- Price Trend: Declining from 2024 peaks
England's Cheapest Priced Areas Under £110,000
9. DL14 - Bishop Auckland
Bishop Auckland demonstrates recent price decline with current asking prices at £103,294. The area shows significant volatility, having declined sharply from peaks around £135,000 in mid-2023, with prices fluctuating throughout the period since 2019, while remaining 65% below England's average house price.
Property Price Metrics in DL14
- Average Asking Price: £103,294
- Average Household Income: £34,600
- Affordability Ratio: 2.99x
- Price Trend: Declining from 2023 peaks
10. TS4 - Middlesbrough
Middlesbrough's TS4 postcode shows sharp recent decline with asking prices at £105,727. Historical analysis reveals dramatic price movements, with steep drops from peaks around £135,000 in early 2023, having shown strong volatility throughout the period, while maintaining 64% below England's average.
Property Price Metrics in TS4
- Average Asking Price: £105,727
- Average Household Income: £31,800
- Affordability Ratio: 3.32x
- Price Trend: Sharp decline from 2023 peaks
11. HU1 - Hull City Centre
Hull city centre demonstrates recent price volatility with current asking prices at £107,992. The area shows substantial decline from peaks around £135,000 in 2020-2021, with continued downward pressure through 2024-2025, though maintaining strong affordability at 63% below England's average.
Property Price Metrics in HU1
- Average Asking Price: £107,992
- Average Household Income: £29,500
- Affordability Ratio: 3.66x
- Price Trend: Declining from 2020-2021 peaks
12. HU2 - Hull
Hull's HU2 postcode shows dramatic recent activity with asking prices at £108,031. Historical data reveals extreme volatility including sharp drops to near-zero levels (data anomalies) in 2019-2020, with recent sharp spike from around £90,000 to current levels, representing 63% below England's average house price.
Property Price Metrics in HU2
- Average Asking Price: £108,031
- Average Household Income: £29,100
- Affordability Ratio: 3.71x
- Price Trend: Recent spike from lower levels
England's Cheapest Priced Areas Under £120,000
13. FY1 - Blackpool
Blackpool's FY1 postcode shows recent price decline with asking prices at £111,386. The area demonstrates a downward trend from peaks around £117,000 in mid-2024, having previously shown steady appreciation from £87,000 in 2019, while remaining 62% below England's average house price.
Property Price Metrics in FY1
- Average Asking Price: £111,386
- Average Household Income: £29,200
- Affordability Ratio: 3.81x
- Price Trend: Declining from 2024 peaks
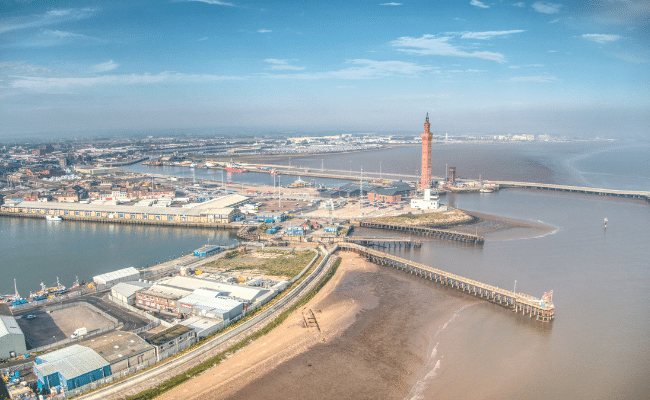
14. DN32 - Grimsby
Grimsby's DN32 postcode demonstrates price stability at £111,975. Historical analysis shows consistent prices around £110,000-£115,000 through 2023-2025, having recovered from earlier volatility in 2019-2020 when prices ranged between £75,000-£110,000, maintaining 62% below England's average.
Property Price Metrics in DN32
- Average Asking Price: £111,975
- Average Household Income: £29,400
- Affordability Ratio: 3.81x
- Price Trend: Stable around current levels
15. TS24 - Hartlepool
Hartlepool shows recent price decline with asking prices at £113,690. The area demonstrates significant volatility, with recent decline from peaks around £145,000 in mid-2024, having shown substantial fluctuations throughout the period since 2019, while remaining 61% below England's average house price.
Property Price Metrics in TS24
- Average Asking Price: £113,690
- Average Household Income: £31,200
- Affordability Ratio: 3.64x
- Price Trend: Declining from 2024 peaks
16. CH41 - Birkenhead
Birkenhead demonstrates declining prices with current asking prices at £116,426. Historical trends show recent downward movement from peaks around £135,000 in early 2024, having shown relatively stable prices around £120,000-£130,000 through 2020-2023, maintaining 60% below England's average.
Property Price Metrics in CH41
- Average Asking Price: £116,426
- Average Household Income: £31,300
- Affordability Ratio: 3.72x
- Price Trend: Declining from early 2024 peaks
17. HU3 - Hull
Hull's HU3 postcode shows sharp recent decline with asking prices at £116,951. The area demonstrates dramatic downward pressure from peaks around £130,000 in mid-2024, having shown steady appreciation from £75,000 in 2019 before recent correction, while remaining 60% below England's average house price.
Property Price Metrics in HU3
- Average Asking Price: £116,951
- Average Household Income: £30,900
- Affordability Ratio: 3.78x
- Price Trend: Sharp decline from mid-2024 peaks
18. L20 - Liverpool
Liverpool's L20 area shows recent price decline with asking prices at £117,729. Historical analysis reveals downward movement from peaks around £127,000 in late 2023, having demonstrated strong appreciation from £82,000 in 2019, while maintaining 60% below England's average.
Property Price Metrics in L20
- Average Asking Price: £117,729
- Average Household Income: £31,700
- Affordability Ratio: 3.71x
- Price Trend: Declining from 2023 peaks
19. HU9 - Hull East
Hull's HU9 postcode demonstrates declining prices at £117,806. The area shows recent downward pressure from peaks around £130,000 in mid-2024, having shown strong appreciation from £90,000 in 2019 before recent correction, representing 60% below England's average house price.
Property Price Metrics in HU9
- Average Asking Price: £117,806
- Average Household Income: £31,100
- Affordability Ratio: 3.79x
- Price Trend: Declining from mid-2024 peaks
20. LA18 - Millom, Cumbria
Millom rounds out England's 20 cheapest locations with asking prices at £119,595. The area shows dramatic recent volatility with sharp decline from peaks around £210,000 in late 2024, having demonstrated extreme price fluctuations throughout the period, while remaining 59% below England's average house price.
Property Price Metrics in LA18
- Average Asking Price: £119,595
- Average Household Income: £35,400
- Affordability Ratio: 3.38x
- Price Trend: Sharp decline from late 2024 peaks

FAQ's
What are house price to income ratios?
The house price to earnings ratio (also called the affordability ratio) shows how many years of income it would take to buy a property outright. For example, if a house costs £60,000 and the average household income is £30,000, the affordability ratio would be 2.0 - meaning it would take 2 years of total income to buy the property.
This ratio is equally important for homeowners as it is for landlords purchasing investment property that has local tenant demand and affordable rents, it is a key part of a landlord's property investment checklist.
So if you are new to property and researching an area or starting your property training, consider affordability ratios as a key part of your research. A lower ratio indicates better affordability:
- Ratio under 3.0: Considered very affordable
- Ratio 3.0-4.0: Moderately affordable
- Ratio over 4.0: Less affordable
- UK Average: 7.1 (as of the year 2025)
Where is the cheapest place to live in the UK?
The cheapest place to live in the UK is PA15 (Port Glasgow, Scotland) with average house prices of £55,726 - representing 79% below the UK's average house price of £269,735. For England specifically, SR1 (Sunderland city centre) is the most affordable at £64,665, which is 78% below England's average. Both locations offer exceptional affordability ratios of 2.13x and below, meaning properties cost just over twice the average local household income, compared to the UK national average of 7.1x
Can you buy a house for under £100k in the UK?
Yes, there are 16 postcodes in the UK where average house prices are under £100,000. These include 8 locations in Scotland and 8 in England. The cheapest options start at £55,726 in Port Glasgow (PA15, Scotland) and £64,665 in Sunderland (SR1, England). Properties at this price level are concentrated in the North East of England and former industrial areas of Scotland, offering affordability ratios between 2.13x and 3.32x annual household income - significantly below the UK average of 7.1x.
What salary do I need to buy a £100k house in the UK?
Traditional mortgage lending typically requires 4.5x your annual salary, suggesting you'd need approximately £22,222 annual income for a £100k property. However, in the UK's cheapest locations, local affordability ratios are significantly lower. In Sunderland (SR1), with an affordability ratio of 2.13x and an average household income of £30,300, properties at £64,665 are accessible to lower earners. This is just a guide, as actual mortgage eligibility depends on deposit size, credit history, and lender criteria.
Which part of England has the cheapest houses?
The North East dominates England's cheapest property markets, with 7 of England's 10 cheapest postcodes located in this region. Sunderland city centre (SR1) leads at £64,665, followed by Grimsby (DN31) at £79,052 and Middlesbrough (TS1) at £79,442. Other North East locations, including Shildon (DL4), Chopwell near Gateshead (NE17), Peterlee (SR8), Bishop Auckland (DL14), and Hartlepool (TS24), all feature in the top 20. Yorkshire also shows strong affordability, with Bradford (BD1) at £68,334, while the North West contributes Hull, Blackpool, Liverpool, and Birkenhead to the list.
Where are house prices falling the most in the UK?
Analysis shows 18 of the UK's 20 cheapest postcodes are experiencing declining prices from recent peaks, indicating their place on the property cycle could be near to the bottom. The sharpest declines are concentrated in Middlesbrough, with TS1 dropping from £95,000 peaks to £79,442, and TS4 falling from £135,000 to £105,727. Hull shows significant corrections across multiple postcodes (HU1, HU3, HU9), while Millom (LA18) demonstrates dramatic volatility with sharp decline from £210,000 peaks to £119,595. Scotland's cheapest areas, including Port Glasgow (PA15) and Stevenston (KA16, KA20) also show declining trends. In this cheapest house price list, only Bradford (BD1) shows steady growth against the broader declining trend.
Conclusion
Our analysis of the UK and England's most affordable property locations in 2025 reveals several key insights:
Scotland is the cheapest country to buy in the UK.
The North East emerges as England's primary region for affordable housing.
There are many postcodes where the affordability ratio is below 3 x annual incomes, and these towns and cities maintain house prices 60-80% below national averages.
So:
Is property too expensive to buy in the UK?
Clearly not everywhere.
However, it is of course not possible for everyone to live in 'affordable' locations. Work, family, amenities, transport links, tourism, and lifestyle often dictate local housing demand.
These places are priced low for a reason. Often, it is because there simply isn't enough homebuyer demand, and rather than a fast-growing city, with an expanding local population, people might be moving away from the area, and populations are shrinking locally as opportunities for work aren't as abundant as in the major towns and cities across the UK where housing demand often outstrips supply.
