

Derry, formally Londonderry, is Northern Ireland's second city, built on both banks of the River Foyle a few miles from the border with the Republic of Ireland. With the town of Strabane to the south it makes up the Derry City and Strabane council district, a North West council area of about 152,000 people covered by the BT47, BT48, BT81 and BT82 postcodes. The average house price in Derry City and Strabane was a provisional £189,000 on the latest quarterly index reading, up 12.4% on a year earlier, the second-fastest annual rise of Northern Ireland's eleven council districts, and it now stands 9.6% above the district's own July 2007 peak of £172,875. That last point is what sets the North West apart from the capital: Belfast has not yet regained its 2007 level, while the Derry City and Strabane index passed its own in July 2025 and has moved further clear since.
Fast growth has not come with high rents or a big sales base. The advertised rent for its matched rental market area is the eighth-highest of the eleven districts, the number of homes changing hands in a year is the ninth-largest, and 17.9% of households rent from a private landlord, joint sixth in the region. On price the district is fourth-cheapest, with three districts below it.
Northern Ireland does not publish the postcode-level sold prices, rents or yields that our guides use for England, Scotland and Wales. The price index and the sales counts below are for the Derry City and Strabane council district. The ONS rent is an average of advertised new lets across the North West Northern Ireland Broad Rental Market Area, which the ONS names as the best match for a council that overlaps both that area and South West Northern Ireland. The Housing Executive's weekly rents are for its own North West area, listed as BT47, BT48, BT49 and BT82. So the price covers the council district, both rents cover rental areas that are not the council district, and the two rents are measured in different ways. Dividing either rent by the price would not give a yield, because the two figures do not describe the same homes or the same place.
Article updated: September 2026
Why Investors Look at Derry City and Strabane
Derry City and Strabane is home to 152,383 people, has a median age of 40.0, the fourth-youngest of Northern Ireland's eleven districts, and recorded the region's second-fastest annual house price growth at 12.4%. The population is the sixth-largest of the eleven, 335 people behind Mid Ulster, at a density of 123.2 people per square kilometre across a district that runs from the city out to Strabane and Castlederg. Local services are run by Derry City and Strabane District Council.
The university is the other number to know. Ulster University's Magee campus sits in the city, and the Northern Ireland Executive has committed to growing it to 10,000 students: the Magee Taskforce report published in September 2024 expected the campus to reach 6,500 students in around two years and 7,000 in 2028, and estimated that £700 million is needed for new teaching blocks, research space and student accommodation. That is a target with money still to be found.
The other thing the figures say is that this is a district of houses. At the 2021 Census, 32.3% of homes were semi-detached, 32.0% detached and 26.0% terraced, with flats at 9.7%, an even three-way split between house types, and the 2025 sales figures show the same shape.
Regeneration and Investment in Derry City and Strabane
The Derry-Londonderry and Strabane City Region City Deal was signed at the Guildhall on 18 September 2024 and will see more than £250 million invested in the city and district, with up to 6,300 new jobs by 2033. Beside it sit two schemes where money has already been spent or land already bought.
- Derry-Londonderry and Strabane City Region City Deal (Signed September 2024, more than £250 million): The UK Government has provided £50 million of City Deal funding and £55 million through the Inclusive Future Fund, match funded by the Northern Ireland Executive, with £83 million from Derry City and Strabane District Council and its project partners, and the council puts the programme's overall value at £290 million. The projects it names, a £39 million Cognitive Analytics and Digital Robotics Centre, a School of Medicine at Magee, waterfront regeneration in Derry and town centre regeneration in Strabane, are funded plans rather than finished buildings. Updates at Derry City and Strabane District Council.
- Ulster University Magee expansion (Land acquired, 10,000-student target by 2032): The Department for the Economy and Ulster University have bought the Timber Quay office block and sites along Queen's Quay, which the department said in February 2025 would let the campus take 375 more students in the 2025/26 academic year on the way to 10,000 by 2032, with almost £21.5 million of capital contributed by then; whether those places were filled is not something the announcement can confirm. The same announcement put student numbers at 4,060 in 2021/22 and 5,335 in 2023/24. Updates at Department for the Economy.
- Ebrington and the Peace Bridge (Delivered, more than £30 million): The Executive Office has put more than £30 million into Ebrington, a 29-acre former barracks on the east riverfront, where the old parade ground is now Ebrington Square and the site holds the 4-star Ebrington Hotel and Spa and the Walled City Brewery. The 235-metre Peace Bridge, a foot and cycle bridge, has connected the square to the city centre since it opened on 25 June 2011. Updates at The Executive Office and Visit Derry.

House Prices in Derry City and Strabane
The provisional average house price in Derry City and Strabane was £189,000 for April to June 2026, up 12.4% on the same quarter of 2025, on the Northern Ireland House Price Index. The index is a standardised measure of the price of a residential property sold in Northern Ireland: it tracks a like-for-like home over time, so a quarter with more detached sales than usual does not push it up on its own. Unrounded, the standardised figure for the quarter is £189,474. Both numbers come from the Department of Finance, which publishes the index quarterly, with the local summary on the ONS housing page for Derry City and Strabane.
Eighteen months of readings tell the recent story: £166,877 at the end of 2024, £189,474 by mid-2026, a rise of 13.5%, with every one of the last eight quarterly readings above £160,000. The climb had a wobble in it. The index hit £180,384 in the third quarter of 2025, dropped back to £176,530 in the fourth, then moved up again to £185,366 and £189,474 in the first two quarters of 2026. On the annual rate, December 2024 read 9.5%, December 2025 read 5.8%, and the latest reading is 12.4%, which only Newry, Mourne and Down beat across the eleven districts, at 12.8%.
The Derry City and Strabane Price Cycle, 2005 to 2026
The series starts in January 2005 at £90,959. In the twenty-one years since, the average has nearly doubled, fallen by more than half, and then risen 139.1% to a level 9.6% above the old peak. Every figure below is a reading from that series.
The 2005 to 2007 boom: December 2005 read £106,165; December 2006 read £146,457. That is 38.0% in a single year, the fastest annual rise anywhere in the series. The peak came in July 2007 at £172,875, and by December 2007 the average had already slipped back to £170,843.
2008 to 2013, six years of falls: The annual rate went negative in April 2008, a fall of 11.1%, and bottomed in January 2009 at a fall of 27.4%, with the average at £117,985. Every December reading for six years came in below the one before: £137,561 in 2008, £116,894 in 2009, £98,055 in 2010, £86,969 in 2011, £82,611 in 2012 and £82,253 in 2013. January 2013 was the floor, £79,233, a 54.2% drop from the July 2007 peak.
2014 to 2019, the recovery: The annual rate turned positive again in January 2014 at 4.3%, and each December from then to 2019 read higher than the last: £89,136, £93,591, £102,985, £112,661, £120,852 and £121,791, by which time the annual rate was down to 0.8%. Six years of gains lifted the average only a little past its December 2009 level of £116,894.
2020 to 2026, past the peak: December 2020 read £123,907 with the annual rate at 1.7%; a year at 11.3% took it to £137,852 in December 2021, then £145,884 in December 2022 and £152,344 in December 2023, with the rate down to 4.4%. A 9.5% year took it to £166,877 in December 2024, July 2025 at £180,384 was the first reading above the 2007 peak, December 2025 read £176,530, and the April to July 2026 readings of £189,474, up 12.4% on the year, are the highest in the series.
Long-term growth summary:
- 5 years (July 2021 to July 2026): 38.3% growth (£136,976 to £189,474)
- 10 years (July 2016 to July 2026): 87.2% growth (£101,240 to £189,474)
- 15 years (July 2011 to July 2026): 105.9% growth (£92,037 to £189,474)
- From the January 2013 low: 139.1% growth (£79,233 to £189,474)
- From January 2005: 108.3% growth (£90,959 to £189,474)
Two facts sit together here. The average has risen 139.1% from the January 2013 floor, and it is 9.6% above the July 2007 peak. The July 2025 reading of £180,384 was the first to pass £172,875; the index eased to £176,530 that October and stayed above the old peak, and the 2026 readings have moved further clear. Belfast's index has not yet got back to its own 2007 high. Because the Northern Ireland index is published once a quarter, the monthly rows in the two charts below repeat each quarter's value, and the July 2026 row carries the latest quarterly observation.
The first chart runs the full average-price series from January 2005 to July 2026, and the shape to look for is a steep climb to £172,875 in 2007, a five-and-a-half-year slide to £79,233, and a climb that has now carried the line above the point where it started falling.
Source: HM Land Registry House Price Index
| Year | All property types |
|---|---|
| 2005-01 | £90,959 |
| 2005-02 | £90,959 |
| 2005-03 | £90,959 |
| 2005-04 | £95,289 |
| 2005-05 | £95,289 |
| 2005-06 | £95,289 |
| 2005-07 | £101,561 |
| 2005-08 | £101,561 |
| 2005-09 | £101,561 |
| 2005-10 | £106,165 |
| 2005-11 | £106,165 |
| 2005-12 | £106,165 |
| 2006-01 | £112,712 |
| 2006-02 | £112,712 |
| 2006-03 | £112,712 |
| 2006-04 | £122,737 |
| 2006-05 | £122,737 |
| 2006-06 | £122,737 |
| 2006-07 | £136,907 |
| 2006-08 | £136,907 |
| 2006-09 | £136,907 |
| 2006-10 | £146,457 |
| 2006-11 | £146,457 |
| 2006-12 | £146,457 |
| 2007-01 | £154,858 |
| 2007-02 | £154,858 |
| 2007-03 | £154,858 |
| 2007-04 | £166,170 |
| 2007-05 | £166,170 |
| 2007-06 | £166,170 |
| 2007-07 | £172,875 |
| 2007-08 | £172,875 |
| 2007-09 | £172,875 |
| 2007-10 | £170,843 |
| 2007-11 | £170,843 |
| 2007-12 | £170,843 |
| 2008-01 | £162,413 |
| 2008-02 | £162,413 |
| 2008-03 | £162,413 |
| 2008-04 | £147,797 |
| 2008-05 | £147,797 |
| 2008-06 | £147,797 |
| 2008-07 | £138,132 |
| 2008-08 | £138,132 |
| 2008-09 | £138,132 |
| 2008-10 | £137,561 |
| 2008-11 | £137,561 |
| 2008-12 | £137,561 |
| 2009-01 | £117,985 |
| 2009-02 | £117,985 |
| 2009-03 | £117,985 |
| 2009-04 | £115,189 |
| 2009-05 | £115,189 |
| 2009-06 | £115,189 |
| 2009-07 | £114,562 |
| 2009-08 | £114,562 |
| 2009-09 | £114,562 |
| 2009-10 | £116,894 |
| 2009-11 | £116,894 |
| 2009-12 | £116,894 |
| 2010-01 | £114,149 |
| 2010-02 | £114,149 |
| 2010-03 | £114,149 |
| 2010-04 | £107,006 |
| 2010-05 | £107,006 |
| 2010-06 | £107,006 |
| 2010-07 | £105,141 |
| 2010-08 | £105,141 |
| 2010-09 | £105,141 |
| 2010-10 | £98,055 |
| 2010-11 | £98,055 |
| 2010-12 | £98,055 |
| 2011-01 | £102,618 |
| 2011-02 | £102,618 |
| 2011-03 | £102,618 |
| 2011-04 | £95,618 |
| 2011-05 | £95,618 |
| 2011-06 | £95,618 |
| 2011-07 | £92,037 |
| 2011-08 | £92,037 |
| 2011-09 | £92,037 |
| 2011-10 | £86,969 |
| 2011-11 | £86,969 |
| 2011-12 | £86,969 |
| 2012-01 | £89,167 |
| 2012-02 | £89,167 |
| 2012-03 | £89,167 |
| 2012-04 | £87,433 |
| 2012-05 | £87,433 |
| 2012-06 | £87,433 |
| 2012-07 | £82,973 |
| 2012-08 | £82,973 |
| 2012-09 | £82,973 |
| 2012-10 | £82,611 |
| 2012-11 | £82,611 |
| 2012-12 | £82,611 |
| 2013-01 | £79,233 |
| 2013-02 | £79,233 |
| 2013-03 | £79,233 |
| 2013-04 | £81,847 |
| 2013-05 | £81,847 |
| 2013-06 | £81,847 |
| 2013-07 | £82,780 |
| 2013-08 | £82,780 |
| 2013-09 | £82,780 |
| 2013-10 | £82,253 |
| 2013-11 | £82,253 |
| 2013-12 | £82,253 |
| 2014-01 | £82,671 |
| 2014-02 | £82,671 |
| 2014-03 | £82,671 |
| 2014-04 | £83,685 |
| 2014-05 | £83,685 |
| 2014-06 | £83,685 |
| 2014-07 | £87,249 |
| 2014-08 | £87,249 |
| 2014-09 | £87,249 |
| 2014-10 | £89,136 |
| 2014-11 | £89,136 |
| 2014-12 | £89,136 |
| 2015-01 | £90,699 |
| 2015-02 | £90,699 |
| 2015-03 | £90,699 |
| 2015-04 | £90,407 |
| 2015-05 | £90,407 |
| 2015-06 | £90,407 |
| 2015-07 | £93,997 |
| 2015-08 | £93,997 |
| 2015-09 | £93,997 |
| 2015-10 | £93,591 |
| 2015-11 | £93,591 |
| 2015-12 | £93,591 |
| 2016-01 | £96,724 |
| 2016-02 | £96,724 |
| 2016-03 | £96,724 |
| 2016-04 | £98,336 |
| 2016-05 | £98,336 |
| 2016-06 | £98,336 |
| 2016-07 | £101,240 |
| 2016-08 | £101,240 |
| 2016-09 | £101,240 |
| 2016-10 | £102,985 |
| 2016-11 | £102,985 |
| 2016-12 | £102,985 |
| 2017-01 | £104,309 |
| 2017-02 | £104,309 |
| 2017-03 | £104,309 |
| 2017-04 | £104,921 |
| 2017-05 | £104,921 |
| 2017-06 | £104,921 |
| 2017-07 | £108,284 |
| 2017-08 | £108,284 |
| 2017-09 | £108,284 |
| 2017-10 | £112,661 |
| 2017-11 | £112,661 |
| 2017-12 | £112,661 |
| 2018-01 | £108,516 |
| 2018-02 | £108,516 |
| 2018-03 | £108,516 |
| 2018-04 | £113,706 |
| 2018-05 | £113,706 |
| 2018-06 | £113,706 |
| 2018-07 | £114,787 |
| 2018-08 | £114,787 |
| 2018-09 | £114,787 |
| 2018-10 | £120,852 |
| 2018-11 | £120,852 |
| 2018-12 | £120,852 |
| 2019-01 | £116,525 |
| 2019-02 | £116,525 |
| 2019-03 | £116,525 |
| 2019-04 | £118,828 |
| 2019-05 | £118,828 |
| 2019-06 | £118,828 |
| 2019-07 | £114,965 |
| 2019-08 | £114,965 |
| 2019-09 | £114,965 |
| 2019-10 | £121,791 |
| 2019-11 | £121,791 |
| 2019-12 | £121,791 |
| 2020-01 | £120,962 |
| 2020-02 | £120,962 |
| 2020-03 | £120,962 |
| 2020-04 | £122,175 |
| 2020-05 | £122,175 |
| 2020-06 | £122,175 |
| 2020-07 | £120,828 |
| 2020-08 | £120,828 |
| 2020-09 | £120,828 |
| 2020-10 | £123,907 |
| 2020-11 | £123,907 |
| 2020-12 | £123,907 |
| 2021-01 | £127,619 |
| 2021-02 | £127,619 |
| 2021-03 | £127,619 |
| 2021-04 | £128,640 |
| 2021-05 | £128,640 |
| 2021-06 | £128,640 |
| 2021-07 | £136,976 |
| 2021-08 | £136,976 |
| 2021-09 | £136,976 |
| 2021-10 | £137,852 |
| 2021-11 | £137,852 |
| 2021-12 | £137,852 |
| 2022-01 | £139,792 |
| 2022-02 | £139,792 |
| 2022-03 | £139,792 |
| 2022-04 | £143,821 |
| 2022-05 | £143,821 |
| 2022-06 | £143,821 |
| 2022-07 | £148,628 |
| 2022-08 | £148,628 |
| 2022-09 | £148,628 |
| 2022-10 | £145,884 |
| 2022-11 | £145,884 |
| 2022-12 | £145,884 |
| 2023-01 | £141,358 |
| 2023-02 | £141,358 |
| 2023-03 | £141,358 |
| 2023-04 | £152,237 |
| 2023-05 | £152,237 |
| 2023-06 | £152,237 |
| 2023-07 | £156,296 |
| 2023-08 | £156,296 |
| 2023-09 | £156,296 |
| 2023-10 | £152,344 |
| 2023-11 | £152,344 |
| 2023-12 | £152,344 |
| 2024-01 | £150,260 |
| 2024-02 | £150,260 |
| 2024-03 | £150,260 |
| 2024-04 | £156,550 |
| 2024-05 | £156,550 |
| 2024-06 | £156,550 |
| 2024-07 | £161,870 |
| 2024-08 | £161,870 |
| 2024-09 | £161,870 |
| 2024-10 | £166,877 |
| 2024-11 | £166,877 |
| 2024-12 | £166,877 |
| 2025-01 | £168,266 |
| 2025-02 | £168,266 |
| 2025-03 | £168,266 |
| 2025-04 | £168,502 |
| 2025-05 | £168,502 |
| 2025-06 | £168,502 |
| 2025-07 | £180,384 |
| 2025-08 | £180,384 |
| 2025-09 | £180,384 |
| 2025-10 | £176,530 |
| 2025-11 | £176,530 |
| 2025-12 | £176,530 |
| 2026-01 | £185,366 |
| 2026-02 | £185,366 |
| 2026-03 | £185,366 |
| 2026-04 | £189,474 |
| 2026-05 | £189,474 |
| 2026-06 | £189,474 |
| 2026-07 | £189,474 |
Below it, the same series as an annual rate of change, which is where the size of the swings shows: growth of 38.0% in late 2006, a fall of 27.4% in early 2009, a negative reading in every December from 2008 to 2013, and double-digit gains in 2016, 2021, 2025 and 2026.
Source: HM Land Registry House Price Index
| Year | All property types |
|---|---|
| 2006-01 | +23.9% |
| 2006-02 | +23.9% |
| 2006-03 | +23.9% |
| 2006-04 | +28.8% |
| 2006-05 | +28.8% |
| 2006-06 | +28.8% |
| 2006-07 | +34.8% |
| 2006-08 | +34.8% |
| 2006-09 | +34.8% |
| 2006-10 | +38.0% |
| 2006-11 | +38.0% |
| 2006-12 | +38.0% |
| 2007-01 | +37.4% |
| 2007-02 | +37.4% |
| 2007-03 | +37.4% |
| 2007-04 | +35.4% |
| 2007-05 | +35.4% |
| 2007-06 | +35.4% |
| 2007-07 | +26.3% |
| 2007-08 | +26.3% |
| 2007-09 | +26.3% |
| 2007-10 | +16.7% |
| 2007-11 | +16.7% |
| 2007-12 | +16.7% |
| 2008-01 | +4.9% |
| 2008-02 | +4.9% |
| 2008-03 | +4.9% |
| 2008-04 | -11.1% |
| 2008-05 | -11.1% |
| 2008-06 | -11.1% |
| 2008-07 | -20.1% |
| 2008-08 | -20.1% |
| 2008-09 | -20.1% |
| 2008-10 | -19.5% |
| 2008-11 | -19.5% |
| 2008-12 | -19.5% |
| 2009-01 | -27.4% |
| 2009-02 | -27.4% |
| 2009-03 | -27.4% |
| 2009-04 | -22.1% |
| 2009-05 | -22.1% |
| 2009-06 | -22.1% |
| 2009-07 | -17.1% |
| 2009-08 | -17.1% |
| 2009-09 | -17.1% |
| 2009-10 | -15.0% |
| 2009-11 | -15.0% |
| 2009-12 | -15.0% |
| 2010-01 | -3.3% |
| 2010-02 | -3.3% |
| 2010-03 | -3.3% |
| 2010-04 | -7.1% |
| 2010-05 | -7.1% |
| 2010-06 | -7.1% |
| 2010-07 | -8.2% |
| 2010-08 | -8.2% |
| 2010-09 | -8.2% |
| 2010-10 | -16.1% |
| 2010-11 | -16.1% |
| 2010-12 | -16.1% |
| 2011-01 | -10.1% |
| 2011-02 | -10.1% |
| 2011-03 | -10.1% |
| 2011-04 | -10.6% |
| 2011-05 | -10.6% |
| 2011-06 | -10.6% |
| 2011-07 | -12.5% |
| 2011-08 | -12.5% |
| 2011-09 | -12.5% |
| 2011-10 | -11.3% |
| 2011-11 | -11.3% |
| 2011-12 | -11.3% |
| 2012-01 | -13.1% |
| 2012-02 | -13.1% |
| 2012-03 | -13.1% |
| 2012-04 | -8.6% |
| 2012-05 | -8.6% |
| 2012-06 | -8.6% |
| 2012-07 | -9.8% |
| 2012-08 | -9.8% |
| 2012-09 | -9.8% |
| 2012-10 | -5.0% |
| 2012-11 | -5.0% |
| 2012-12 | -5.0% |
| 2013-01 | -11.1% |
| 2013-02 | -11.1% |
| 2013-03 | -11.1% |
| 2013-04 | -6.4% |
| 2013-05 | -6.4% |
| 2013-06 | -6.4% |
| 2013-07 | -0.2% |
| 2013-08 | -0.2% |
| 2013-09 | -0.2% |
| 2013-10 | -0.4% |
| 2013-11 | -0.4% |
| 2013-12 | -0.4% |
| 2014-01 | +4.3% |
| 2014-02 | +4.3% |
| 2014-03 | +4.3% |
| 2014-04 | +2.2% |
| 2014-05 | +2.2% |
| 2014-06 | +2.2% |
| 2014-07 | +5.4% |
| 2014-08 | +5.4% |
| 2014-09 | +5.4% |
| 2014-10 | +8.4% |
| 2014-11 | +8.4% |
| 2014-12 | +8.4% |
| 2015-01 | +9.7% |
| 2015-02 | +9.7% |
| 2015-03 | +9.7% |
| 2015-04 | +8.0% |
| 2015-05 | +8.0% |
| 2015-06 | +8.0% |
| 2015-07 | +7.7% |
| 2015-08 | +7.7% |
| 2015-09 | +7.7% |
| 2015-10 | +5.0% |
| 2015-11 | +5.0% |
| 2015-12 | +5.0% |
| 2016-01 | +6.6% |
| 2016-02 | +6.6% |
| 2016-03 | +6.6% |
| 2016-04 | +8.8% |
| 2016-05 | +8.8% |
| 2016-06 | +8.8% |
| 2016-07 | +7.7% |
| 2016-08 | +7.7% |
| 2016-09 | +7.7% |
| 2016-10 | +10.0% |
| 2016-11 | +10.0% |
| 2016-12 | +10.0% |
| 2017-01 | +7.8% |
| 2017-02 | +7.8% |
| 2017-03 | +7.8% |
| 2017-04 | +6.7% |
| 2017-05 | +6.7% |
| 2017-06 | +6.7% |
| 2017-07 | +7.0% |
| 2017-08 | +7.0% |
| 2017-09 | +7.0% |
| 2017-10 | +9.4% |
| 2017-11 | +9.4% |
| 2017-12 | +9.4% |
| 2018-01 | +4.0% |
| 2018-02 | +4.0% |
| 2018-03 | +4.0% |
| 2018-04 | +8.4% |
| 2018-05 | +8.4% |
| 2018-06 | +8.4% |
| 2018-07 | +6.0% |
| 2018-08 | +6.0% |
| 2018-09 | +6.0% |
| 2018-10 | +7.3% |
| 2018-11 | +7.3% |
| 2018-12 | +7.3% |
| 2019-01 | +7.4% |
| 2019-02 | +7.4% |
| 2019-03 | +7.4% |
| 2019-04 | +4.5% |
| 2019-05 | +4.5% |
| 2019-06 | +4.5% |
| 2019-07 | +0.2% |
| 2019-08 | +0.2% |
| 2019-09 | +0.2% |
| 2019-10 | +0.8% |
| 2019-11 | +0.8% |
| 2019-12 | +0.8% |
| 2020-01 | +3.8% |
| 2020-02 | +3.8% |
| 2020-03 | +3.8% |
| 2020-04 | +2.8% |
| 2020-05 | +2.8% |
| 2020-06 | +2.8% |
| 2020-07 | +5.1% |
| 2020-08 | +5.1% |
| 2020-09 | +5.1% |
| 2020-10 | +1.7% |
| 2020-11 | +1.7% |
| 2020-12 | +1.7% |
| 2021-01 | +5.5% |
| 2021-02 | +5.5% |
| 2021-03 | +5.5% |
| 2021-04 | +5.3% |
| 2021-05 | +5.3% |
| 2021-06 | +5.3% |
| 2021-07 | +13.4% |
| 2021-08 | +13.4% |
| 2021-09 | +13.4% |
| 2021-10 | +11.3% |
| 2021-11 | +11.3% |
| 2021-12 | +11.3% |
| 2022-01 | +9.5% |
| 2022-02 | +9.5% |
| 2022-03 | +9.5% |
| 2022-04 | +11.8% |
| 2022-05 | +11.8% |
| 2022-06 | +11.8% |
| 2022-07 | +8.5% |
| 2022-08 | +8.5% |
| 2022-09 | +8.5% |
| 2022-10 | +5.8% |
| 2022-11 | +5.8% |
| 2022-12 | +5.8% |
| 2023-01 | +1.1% |
| 2023-02 | +1.1% |
| 2023-03 | +1.1% |
| 2023-04 | +5.9% |
| 2023-05 | +5.9% |
| 2023-06 | +5.9% |
| 2023-07 | +5.2% |
| 2023-08 | +5.2% |
| 2023-09 | +5.2% |
| 2023-10 | +4.4% |
| 2023-11 | +4.4% |
| 2023-12 | +4.4% |
| 2024-01 | +6.3% |
| 2024-02 | +6.3% |
| 2024-03 | +6.3% |
| 2024-04 | +2.8% |
| 2024-05 | +2.8% |
| 2024-06 | +2.8% |
| 2024-07 | +3.6% |
| 2024-08 | +3.6% |
| 2024-09 | +3.6% |
| 2024-10 | +9.5% |
| 2024-11 | +9.5% |
| 2024-12 | +9.5% |
| 2025-01 | +12.0% |
| 2025-02 | +12.0% |
| 2025-03 | +12.0% |
| 2025-04 | +7.6% |
| 2025-05 | +7.6% |
| 2025-06 | +7.6% |
| 2025-07 | +11.4% |
| 2025-08 | +11.4% |
| 2025-09 | +11.4% |
| 2025-10 | +5.8% |
| 2025-11 | +5.8% |
| 2025-12 | +5.8% |
| 2026-01 | +10.2% |
| 2026-02 | +10.2% |
| 2026-03 | +10.2% |
| 2026-04 | +12.4% |
| 2026-05 | +12.4% |
| 2026-06 | +12.4% |
| 2026-07 | +12.4% |
How Derry City and Strabane Compares Across Northern Ireland
Derry City and Strabane's £189,000 average house price is the fourth-lowest of Northern Ireland's eleven districts, and its 12.4% annual rise is the second-highest, behind only Newry, Mourne and Down at 12.8%. Cheap for the region and rising faster than nearly all of it: that is the district's position. All eleven council districts are in the table, cheapest first, and the columns carry different dates: the house prices are the provisional April to June 2026 index readings, the annual change is against the same quarter of 2025, the rents are June 2026 advertised averages for each council's best-matched Broad Rental Market Area, the sales are 2025 totals, the private rented shares are from the 2021 Census and the populations are 2024 mid-year estimates.
| District | Average house price | Annual change | Average rent (pcm) | Sales (2025) | Private rented | Population |
|---|---|---|---|---|---|---|
| Mid and East Antrim | £177,000 | 8.2% | £796 | 1,890 | 16.1% | 139,913 |
| Belfast | £185,000 | 7.7% | £1,134 | 4,813 | 20.5% | 352,390 |
| Armagh City, Banbridge and Craigavon | £187,000 | 9.2% | £764 | 2,783 | 18.6% | 222,511 |
| Derry City and Strabane | £189,000 | 12.4% | £792 | 1,499 | 17.9% | 152,383 |
| Mid Ulster | £195,000 | 10.5% | £796 | 1,278 | 18.9% | 152,718 |
| Fermanagh and Omagh | £202,000 | 11.0% | £662 | 987 | 18.5% | 117,687 |
| Antrim and Newtownabbey | £206,000 | 8.8% | £796 | 2,299 | 13.9% | 148,100 |
| Causeway Coast and Glens | £219,000 | 9.6% | £808 | 1,849 | 17.9% | 141,954 |
| Newry, Mourne and Down | £221,000 | 12.8% | £783 | 1,750 | 18.0% | 183,115 |
| Ards and North Down | £227,000 | 7.0% | £949 | 3,072 | 13.4% | 165,415 |
| Lisburn and Castlereagh | £241,000 | 9.7% | £949 | 2,447 | 11.2% | 151,669 |
On price, three districts come in lower: Mid and East Antrim at £177,000, Belfast at £185,000 and Armagh City, Banbridge and Craigavon at £187,000, so Derry City and Strabane sits £12,000 above the cheapest and £52,000 below the dearest, Lisburn and Castlereagh at £241,000. On annual growth it is second, 0.4 points behind Newry, Mourne and Down and 1.4 points ahead of Fermanagh and Omagh at 11.0%, with Belfast at 7.7% and Ards and North Down at 7.0% at the foot of that column.
Rent is where the district sits lower. Its £792 average is eighth of the eleven, above only Newry, Mourne and Down at £783, Armagh City, Banbridge and Craigavon at £764 and Fermanagh and Omagh at £662, and £342 below Belfast's £1,134. Rent growth of 2.8% was fourth, behind Newry, Mourne and Down at 4.1%, Causeway Coast and Glens at 3.1% and Belfast at 2.9%. The rent column holds each council's best-matched Broad Rental Market Area figure, which is why three districts show the same £796 and two show £949: the ONS measures Northern Ireland rents by rental market area, and several councils share one. Sales are the smallest base of the three: 1,499 in 2025 is ninth of eleven, with only Mid Ulster at 1,278 and Fermanagh and Omagh at 987 recording fewer, against 4,813 in Belfast. The private rented share of 17.9% is joint sixth with Causeway Coast and Glens, and the population of 152,383 is sixth, 335 behind Mid Ulster. Locations in England, Scotland and Wales are covered in our guide to the best places to invest in buy-to-let.
Sales Activity in Derry City and Strabane
1,499 homes were verified as sold in Derry City and Strabane in 2025: 492 terraced houses, 481 semi-detached, 416 detached and 110 apartments. Because the Northern Ireland House Price Index records each verified sale by property type, the table can show the mix as well as the total, quarter by quarter from the spring of 2024.
| Period | Apartments | Detached | Semi-detached | Terraced | Total sales |
|---|---|---|---|---|---|
| Q2 2024 | 23 | 114 | 116 | 124 | 377 |
| Q3 2024 | 15 | 123 | 118 | 130 | 386 |
| Q4 2024 | 32 | 141 | 98 | 146 | 417 |
| Q1 2025 | 29 | 116 | 122 | 119 | 386 |
| Q2 2025 | 24 | 91 | 109 | 109 | 333 |
| Q3 2025 | 24 | 87 | 117 | 116 | 344 |
| Q4 2025 | 33 | 122 | 133 | 148 | 436 |
| 2025 (full year) | 110 | 416 | 481 | 492 | 1,499 |
| Q1 2026 | 23 | 83 | 83 | 99 | 288 |
| Q2 2026 | 14 | 69 | 81 | 128 | 292 |
Houses, not flats, and no single type dominates. Terraces were 32.8% of 2025 sales, semi-detached homes 32.1% and detached houses 27.8%, three shares about five points apart, while apartments were 7.3%. Detached houses alone, at 416, outnumbered the 110 apartments almost four to one.
The quarterly counts have come down since the second half of 2025. Of the nine quarters in the table, the last three months of 2025 had the most sales at 436 and the first three months of 2026 the fewest at 288, which is 25.4% below the 386 of the same quarter in 2025; the second quarter of 2026, at 292, was 12.3% below the 333 of a year earlier. Add the two 2026 quarters together and they come to 580 verified sales, against 719 for the first six months of 2025, a fall of 19.3%. In the latest quarter terraces made up 128 of the 292 sales, 43.8%, a higher terrace share than in any other quarter in the table.
Rents in Derry City and Strabane
The average private rent advertised across the North West Northern Ireland rental market area, the ONS's best match for a council that overlaps both that area and South West Northern Ireland, was £792 a month in June 2026, up 2.8% on the year. For anyone weighing whether rental property is a worthwhile investment here, read the rent and the price together but do not divide one by the other: one is an ONS average of advertised new lets across a rental market area, the other a standardised index for the council district, and a yield built from the pair would be a made-up number.
| Home | Average monthly rent (June 2026) |
|---|---|
| One bedroom | £548 |
| Two bedrooms | £698 |
| Three bedrooms | £795 |
| Four or more bedrooms | £1,095 |
| Flats | £637 |
| Terraced houses | £735 |
| Semi-detached houses | £841 |
| Detached houses | £1,027 |
Size moves the rent more than type does. Homes with four or more bedrooms were advertised at £1,095, twice the £548 for a one-bed, with two-beds advertised at £698 and three-beds at £795. Property type spreads the figures less: flats were advertised at £637 and detached houses at £1,027, a gap of £390, with terraced houses at £735 and semi-detached at £841 between the two.
There is a second official rent measure, and it is weekly. The Housing Executive's average weekly market rents for the North West area it lists as BT47, BT48, BT49 and BT82 are £112.65 for a one-bed, £138.46 for a two-bed, £150.00 for a three-bed and £172.96 for a four-bed, covering 1 April 2026 to 31 March 2027. They are published as a reference point for intermediate rents, not as a monthly market average, so they belong beside the ONS figures, not multiplied up into them.
One caution on the ONS figure itself: for Northern Ireland the ONS uses advertised new lets, grouped by rental market area rather than by council, and it advises against setting these estimates directly against the rent measures for England, Scotland and Wales.

Who Rents in Derry City and Strabane: Tenure and Demand
At the 2021 Census, 17.9% of the district's 60,935 households rented from a private landlord, roughly 10,900 households. Owner-occupation, at 57.1%, was the second-lowest of the eleven districts after Belfast's 51.0%, and the social rented share of 22.7% was the second-highest, again behind only Belfast at 26.3%.
| Tenure (Census 2021) | Derry City and Strabane households |
|---|---|
| Owner occupied | 57.1% |
| Social rented | 22.7% |
| Private rented | 17.9% |
| Living rent free | 2.3% |
Put the two rented tenures together and 40.6% of households rent, socially or privately, with the social sector the larger of the two. The private rented share is joint sixth with Causeway Coast and Glens, behind Belfast at 20.5% at the top of the table and ahead of Lisburn and Castlereagh at 11.2% at the bottom. Tenure figures: NISRA's Census 2021 housing tables.
Northern Ireland publishes no postcode-level rental demand score, so what follows is demographic and tenure context, not a demand measure. NISRA's 2024 mid-year estimate counts 152,383 people, sixth of the eleven districts and 335 behind Mid Ulster, with a median age of 40.0 that only Belfast at 36.4, Mid Ulster at 38.4 and Armagh City, Banbridge and Craigavon at 39.6 come in under. The Department for the Economy said in February 2025 that Magee's student numbers had grown from 4,060 in 2021/22 to 5,335 in 2023/24. Together those figures describe a mid-sized district with a younger median age than most of the region and a student body that had been growing; they say nothing about which part of the district its renters are in.
Housing Stock and Property Mix in Derry City and Strabane
Derry City and Strabane had 66,675 dwellings on the Valuation List in April 2026, and no single type held even a third of them: 21,714 terraced houses (32.6%), 19,497 detached (29.2%) and 17,802 semi-detached (26.7%). Every April the Department of Finance counts the domestic properties on the list by type, and that count is the physical mix a landlord here is buying from.
| Property type | Dwellings (April 2026) | Share of stock |
|---|---|---|
| Terraced | 21,714 | 32.6% |
| Detached | 19,497 | 29.2% |
| Semi-detached | 17,802 | 26.7% |
| Purpose-built apartments | 5,955 | 8.9% |
| Converted apartments | 1,707 | 2.6% |
| All dwellings | 66,675 | 100% |
Compare that list with the 2025 sales and two types stand out. Semi-detached homes are 26.7% of the stock yet made 32.1% of sales, while the 7,662 apartments, purpose-built and converted together, are 11.5% of the stock yet made only 7.3% of sales. Terraces (32.6% of stock, 32.8% of sales) and detached houses (29.2% and 27.8%) sold roughly in line with their numbers. So semis sold in greater proportion than they stand, and apartments in smaller.
The 2021 Census, counting households rather than rateable properties, gives a similar picture: 32.3% semi-detached, 32.0% detached, 26.0% terraced and 9.7% flats. The Valuation List counts are the Department of Finance housing stock statistics.
New Homes and Planning in Derry City and Strabane
254 new homes were completed in Derry City and Strabane in the first half of 2026 and 209 were started, in a period when 580 homes were verified as sold. The two quarters went opposite ways: starts dropped from 138 in the first quarter to 71 in the second, completions rose from 117 to 137. The 254 completions are equivalent to 0.4% of the 66,675 homes on the April 2026 Valuation List. The source is the Department of Finance new dwelling statistics, built from what each council's Building Control records as started and finished.
Planning applications were fewer than the year before, and more of them are waiting. The district received 617 applications in 2025-26, down from 667 in 2024-25, with 354 of them residential against 382. Decisions issued dropped from 578 to 503, 300 of them on residential applications; 487 were approvals and 16 refusals, an approval rate of 96.8%, with 31 withdrawn applications sitting outside the decision count under the Department for Infrastructure's definition. By the end of March 2026 the live queue had grown to 698 applications from 618 a year earlier, 347 of them residential against 303. Source: the Department for Infrastructure planning statistics.
Taken together: in 2025-26 the district approved 487 of the 503 applications it decided, 96.8%, decided fewer than the year before, and completed homes in the first half of 2026 at well under half the rate at which they were being sold. The 347 residential applications still live at the end of March are schemes waiting on a decision, not homes on the ground.
Areas and Postcodes in Derry City and Strabane
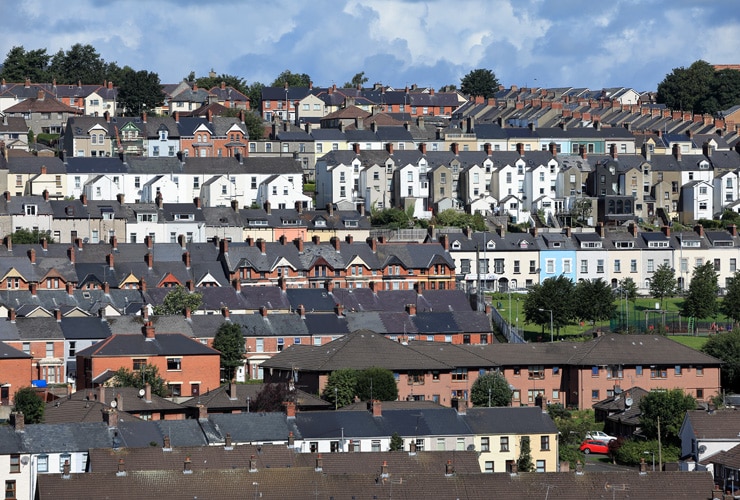
Derry City and Strabane is covered by four postcode districts, BT47, BT48, BT81 and BT82, while the Housing Executive's North West rental area is listed as BT47, BT48, BT49 and BT82, so it takes in BT49 and does not list BT81. BT47 and BT48 both carry the Londonderry post town: BT47 is the Waterside, on one bank of the Foyle, reaching out to Eglinton and Claudy, and BT48 is the Cityside on the other bank, taking in Rosemount and Culmore. BT82 is the Strabane post town, with Sion Mills and Artigarvan, and BT81 is the Castlederg post town.
Finer price data does exist: the Department of Finance publishes annual house price statistics for the district's electoral wards. What does not exist is an official rent figure at ward or postcode level to pair with it, so there is no official price-and-rent pair below district level and no basis for ranking BT47 against BT48 on yield.
Buying Investment Property in Derry City and Strabane
A 30% deposit on the £189,000 average Derry City and Strabane home is £56,700. That is the deposit on the fourth-lowest average price in Northern Ireland, in the district with the region's second-fastest annual price growth and an average rent £342 below Belfast's. Through our partner you can look at vetted investment property for sale across the UK, browse the current buy-to-let investments for sale, or look through the below market value properties. Our guide to off-market property covers the homes that change hands before they are listed.
Letting a property anywhere in the district brings two Northern Ireland rules into play. The first is registration: nidirect states that all landlords letting under a private tenancy in Northern Ireland must register with the Landlord Registration Scheme, that the certificate is valid for three years and costs £70 online, and that the fee, but not the registration, is waived for a landlord who has registered a house in multiple occupation. A house in multiple occupation, which the NI HMO Unit at Belfast City Council defines as the main residence of three or more people from more than two households, rented by at least one of the people living there, must be licensed by the local council unless a temporary exemption notice is in effect; the unit administers HMO regulation on behalf of each of the eleven councils, and its licence application costs £62 per person per year, lasts five years, and requires planning permission and building control approval for any new HMO.
Frequently Asked Questions
What does the data show for investors looking at Derry City and Strabane?
Low price and fast growth, in the same district at the same time. Derry City and Strabane's £189,000 average is the fourth-lowest of Northern Ireland's eleven districts, and its 12.4% rise over the year is the second-highest, while none of the three districts cheaper than it grew faster than 9.2%. The price index has also passed its 2007 peak, £189,474 against £172,875, 9.6% above. What the official data cannot supply is a yield, because the rent is a rental-market-area average of advertised lets and the price is a council-district index.
What are the best areas in Derry City and Strabane for buy-to-let?
There is no official figure that ranks one Derry postcode above another. The Department of Finance publishes annual house price statistics for electoral wards, but no ward-level rent, so a postcode yield table cannot be built from official data. What the district figures give is context, not location: a population of 152,383 with a median age of 40.0, roughly 10,900 households renting privately at the 2021 Census, and a university campus the Department for the Economy is expanding towards a 10,000-student target, none of which says where in the district those renters live. The postcodes are BT47 for the Waterside, BT48 for the Cityside, BT82 for Strabane and BT81 for Castlederg, and terraces and semi-detached homes together were 64.9% of 2025 sales.
What is the average house price in Derry City and Strabane?
The headline moves once a quarter, and the latest reading is the highest in the series. For April to June 2026 the Northern Ireland House Price Index gives a provisional £189,000, up 12.4% on the same quarter of 2025, or £189,474 before rounding. Three districts are cheaper: Mid and East Antrim at £177,000, Belfast at £185,000 and Armagh City, Banbridge and Craigavon at £187,000. The average peaked at £172,875 in July 2007, fell to £79,233 in January 2013 and has risen 139.1% since that low.
What is the average rent in Derry City and Strabane?
Lower than Belfast by some way, and below the middle of the region. The ONS figure for June 2026 is £792 a month for the North West Northern Ireland rental market area, the ONS's best match for a council that overlaps both that area and South West Northern Ireland, up 2.8% on the year and against £1,134 in Belfast. By size, the advertised averages were £548 for a one-bed, £698 for a two-bed, £795 for a three-bed and £1,095 for four or more bedrooms. These are advertised new-let averages, so they describe new lets going on the market, not the rent every sitting tenant pays. On the Housing Executive's weekly measure for 2026/27, a two-bed in its North West area is £138.46 a week and a three-bed £150.00.
What type of property sells most in Derry City and Strabane?
Terraces, but only just, and it depends whether you count sales or the stock. Across the 1,499 verified sales of 2025 the split was 492 terraced, 481 semi-detached, 416 detached and 110 apartments, so the top three types finished within 76 sales of each other. On the April 2026 Valuation List the order is the same at the top, 21,714 terraces to 19,497 detached and 17,802 semi-detached, with 5,955 purpose-built and 1,707 converted apartments making up 11.5% of the 66,675 homes. In the second quarter of 2026 terraces took 128 of 292 sales, 43.8%, the highest terrace share of the nine quarters shown.
How do I buy an investment property in Derry City and Strabane?
The deposit is the first number to illustrate: 30% of the £189,000 average is £56,700 before fees, and the real figure follows the price of the property you buy. Before anyone moves in, register with the Northern Ireland Landlord Registration Scheme, which costs £70 online and is valid for three years, with the fee but not the registration waived for a landlord who has already registered an HMO, and if the property will be the main home of three or more people from more than two households, with at least one of them paying rent, apply for an HMO licence through the NI HMO Unit, which charges £62 per person per year and requires planning permission for a new HMO. For what is on offer right now, our partner lists investment properties and BMV property.
What is the population of Derry City and Strabane?
152,383 people at NISRA's 2024 mid-year estimate, which makes it the sixth-largest of Northern Ireland's eleven council districts, 335 behind Mid Ulster and just ahead of Lisburn and Castlereagh at 151,669. The median age is 40.0, the fourth-youngest in the region, and the density is 123.2 people per square kilometre, a district-wide figure covering Strabane and Castlederg as well as the city. The 2021 Census counted 60,935 households.
Do I need a licence to let a property in Derry City and Strabane?
Registration always; a licence only for a house in multiple occupation. Every private landlord in Northern Ireland has to register with the Landlord Registration Scheme on nidirect, for £70 online, with the certificate valid for three years; the fee, though not the registration, is waived for a landlord who has registered an HMO. A licence is needed only where the property is an HMO, the main residence of three or more people from more than two households, rented by at least one of the people living there, and unless a temporary exemption notice is in effect that licence comes from the local council through the NI HMO Unit, which administers HMO regulation on behalf of all eleven councils. A new HMO also needs planning permission and building control approval before a licence application will be processed.
Ready to buy property?
Browse investment properties with prices and gross yields shown for each opportunity.
See the latest deals