Buy-to-Let in Inverness: Prices 19.8% Below UK Average
Inverness is a city in the Scottish Highlands with an average sold price of £216,711, sitting 19.8% below the UK average of £270,259. Annual house price growth stands at 4.8%. PropertyData asking price data is available for 2 of the city's 5 postcodes, and no postcodes currently return rental or yield figures.
The mean asking price across Inverness's two data-available postcodes is £254,017, with entry deposits from £74,891 at 30%. Price per square foot data covers 4 of 5 postcodes, ranging from £210 in IV5 to £253 in IV1. Highland sold prices sit below UK averages across every individual property type, with flats showing the widest gap at 35.7%.
This guide covers 5 Inverness postcodes under the Highland council area: IV1 (City Centre), IV2 (Inshes, Raigmore), IV3 (Merkinch, Scorguie), IV5 (Glenelg), and IV13 (Tomatin). Inverness sits at the northern end of the Great Glen, where the River Ness meets the Moray Firth. Investors comparing Scottish locations may also consider Aberdeen, Edinburgh, Glasgow, or Dundee. Browse all our Scotland location guides.
Article updated: April 2026
Inverness Buy-to-Let Market Overview 2026
Inverness is the administrative capital of the Scottish Highlands with sold prices below the UK average and strong annual growth. PropertyData coverage is limited, with rental data unavailable for any postcode.
- Average sold price: £216,711 (19.8% below UK's £270,259)
- Asking price range: £249,635 (IV2) to £258,400 (IV3) across 2 postcodes with data
- Rental yields: Not enough data (0 of 5 postcodes)
- Rental income: Not enough data (0 of 5 postcodes)
- Price per sq ft: Sold prices from £210/sq ft (IV5) to £253/sq ft (IV1) across 4 postcodes with data
- Market activity: 32 to 86 sales per month across 2 postcodes with data
- Deposit requirements: 30% deposits from £74,891 (IV2) to £77,520 (IV3)
- Affordability ratios: Property prices from 6.3 to 6.5 times Highland's median annual salary of £39,740
Contents

-
by Robert Jones, Founder of Property Investments UK
With two decades in UK property, Rob has been investing in buy-to-let since 2005, and uses property data to develop tools for property market analysis.

Property Data Sources
Our location guide relies on diverse, authoritative datasets including:
- UK House Price Index
- Ministry of Housing, Communities and Local Government
- Ordnance Survey Data Hub
- Propertydata.co.uk
We update our property data quarterly to ensure accuracy. Last update: April 2026. All data is presented as provided by our sources without adjustments or amendments.
Why Invest in Inverness, Capital of the Highlands?
Inverness is not a city that gets mentioned in the same breath as Manchester or Birmingham when property investors compare opportunities. It probably should be on the radar. The Highland capital sits at the crossroads of some of the biggest infrastructure investments Scotland has seen in decades, and sold prices remain 19.8% below the UK average.
The economy here runs on a mix that would surprise anyone who thinks of Inverness as just a tourist town. Raigmore Hospital is the main acute hospital for the entire Highland region and one of the city's largest employers. The University of the Highlands and Islands has its main campus in Inverness, bringing students and academic staff into the local rental market. Highland Council is headquartered in the city. The public sector provides a layer of employment stability that most Highland towns lack.
Tourism is a major economic driver. Loch Ness sits minutes from the city centre. The North Coast 500 route, which launched in 2015, starts and finishes in Inverness and has brought a sustained increase in visitor numbers. Culloden Battlefield draws history visitors year-round. Cairngorms National Park is an hour south.
For property investors, this tourism base supports a holiday let market that traditional buy-to-let yield data does not capture. Investors interested in the short-term rental sector can explore our guide to buying a holiday let.
Between the 2011 Census and Scotland's Census 2022, Highland's population grew from 232,132 to 235,351, a rise of 1.4%. That is modest. But Inverness itself has grown faster than the wider Highland area, concentrating population and services in the capital. The Green Freeport designation and Inverness Campus expansion are expected to accelerate that trend.
Earnings in Highland sit slightly above the Great Britain median. The median annual salary is £39,740 compared to £39,905 across Scotland and £39,125 for Great Britain. Highland workers earn more than the GB average. That is unusual for locations outside the major cities and reflects the mix of skilled public sector, energy, and healthcare employment in the region.
Inverness Economic Summary
- Population: 235,351 (Highland, Scotland's Census 2022). Growth of 1.4% from 2011.
- Median annual salary: £39,740 (Highland), £39,905 (Scotland), £39,125 (Great Britain)
- Employment rate: 69.6% (Highland), 75.6% (Great Britain)
- Unemployment rate: Data suppressed (Highland), 4.3% (Great Britain)
- Key employment sectors: Healthcare, tourism, public sector, higher education, renewable energy
Source: Scotland's Census 2022, Nomis Labour Market Profile (ASHE 2025, Employment Oct 2024-Sep 2025)
Highland's employment rate of 69.6% sits well below the Great Britain average of 75.6%. The unemployment rate is statistically suppressed, meaning the sample size is too small for reliable reporting. In practical terms, that suppression usually indicates very low unemployment. Highland is a large rural area with lower workforce participation rates driven by demographics (retirement, seasonal work, self-employment not captured in standard surveys) rather than a lack of jobs. Inverness itself, as the urban hub, has higher economic activity than the Highland average.
Regeneration and Investment in Inverness
Inverness is in the middle of an investment cycle that stretches from a castle on the hill to a freeport on the coast. The £315 million Inverness and Highland City-Region Deal has already delivered visible changes to the city centre, and the Green Freeport designation adds a generational employment pipeline.
- Inverness Castle Experience (completed, £30 million): The 19th-century castle has been transformed from a disused courthouse into an immersive visitor attraction and cultural hub. The project includes a contemporary link building with a bistro, restored heritage features including the Rose Window, and interactive exhibits telling Highland stories. Expected to support 82 direct jobs and 480 indirect jobs across the region. Updates at Highland Council.
- Inverness and Cromarty Firth Green Freeport (operational, £25 million seed funding): Scotland's first Green Freeport, positioned as an international hub for offshore wind and renewable energy. The freeport covers the Port of Inverness with tax incentives, simplified customs, and simplified planning. Projected to create over 11,000 long-term jobs and attract £6.5 billion in total investment over 25 years. Sumitomo Electric has committed a £350 million subsea cable facility. Highland Council has approved nine housing sites for over 7,900 new homes to support growth. Updates at Inverness and Cromarty Firth Green Freeport.
- Inverness Campus Phase 2 (approved, planning permission December 2025): The second phase of Highlands and Islands Enterprise's innovation and enterprise park on the eastern edge of the city. Phase 1 attracted over £180 million of investment from an initial £25 million outlay and supports approximately 1,000 jobs. Phase 2 covers 27 acres of the remaining 116 undeveloped acres. Part of the site falls within the Green Freeport zone. Updates at Highlands and Islands Enterprise.
City Centre and Retail Investment
- Eastgate Shopping Centre Transformation (completed): An £8.5 million refurbishment of Inverness's main shopping centre, including new retailers, upgraded parking technology, and LED lighting. Major chains including HMV, Next, and Card Factory have recommitted to the centre. Increased footfall in 2023-2024 signals confidence in Inverness as a retail destination. Updates at STV News.
- City Centre Masterplan and Streetscape Transformation (proposed): Highland Council is developing a masterplan for the next phase of city centre regeneration, building on the completed Castle Experience and Victorian Market renovation. Plans include shopfront design standards, streetscape upgrades, enhanced greenspaces, and a pilot project on the Lombard Street corridor. A cross-party stakeholder group is co-developing the options. Updates at Highland Council.
Inverness Property Market Analysis
When Was the Last House Price Crash in Inverness?
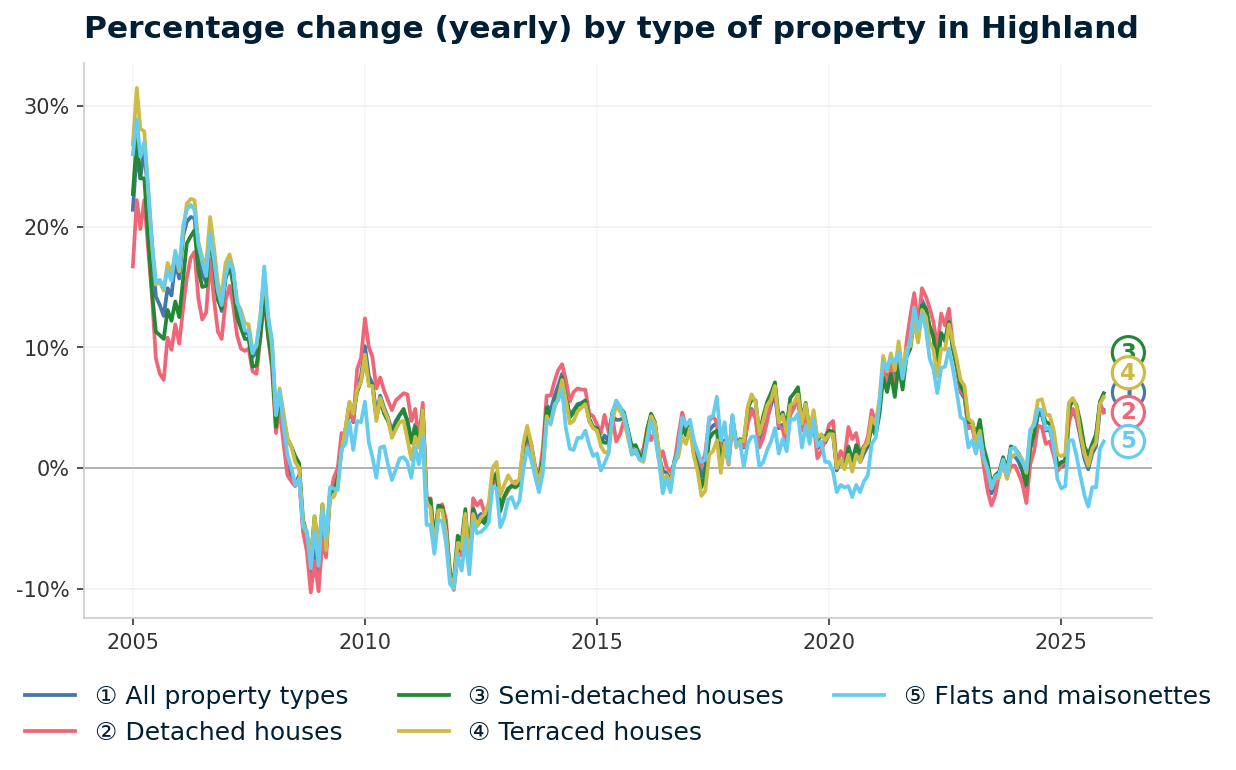
Highland property experienced a distinctive double dip: a 9.6% decline in 2007-2009, a quick recovery, then a second 12.8% fall between 2010 and 2012. The full house price history from the UK House Price Index begins in January 2004. Scottish data starts later than England's (1995), so the pre-2004 boom years are not captured.
- 2004-2007 (Late boom): Highland's data begins in January 2004 at £82,166. Prices nearly doubled to £147,437 by December 2007. Annual growth regularly exceeded 15%, peaking at 21.4% in January 2005. Scotland's property boom arrived later than England's but hit the Highlands hard and fast.
- 2007-2009 (The financial crisis): From the peak of £147,437 in December 2007 to the trough of approximately £133,231 in January 2009, Highland lost 9.6% of its value in 13 months. That is significantly milder than Plymouth's 19.1% decline over the same period. Highland's lower starting prices and less debt-stretched buyer base absorbed the shock better than overheated southern markets.
- 2009-2010 (Quick recovery): Highland bounced fast. By December 2009, prices had reached £148,756, exceeding the pre-crash peak in under 11 months. By December 2010, the average hit £154,763. Most English cities did not recover their pre-crash peaks until 2014 or later. Highland managed it in less than two years.
- 2010-2012 (The double dip): This is where Highland diverges from the typical UK crash story. After recovering fully, prices fell again. By December 2012, the average had dropped to £134,909, a decline of 12.8% from the December 2010 post-recovery peak. Annual change readings turned negative for three consecutive years: -9.8% in December 2011, -3.4% in December 2012. This second dip reflected the broader Scottish economic slowdown and austerity-driven public sector contraction.
- 2013-2019 (Gradual recovery): Growth returned slowly but consistently. Annual changes of 1-5% steadily rebuilt values. By January 2015, prices reached £147,576, finally surpassing the December 2007 pre-crash peak permanently. That recovery took approximately 7 years. By December 2019, the average stood at £167,333, representing six years of unbroken positive growth.
Post-Recovery: 2020 to Present
- 2020-2022 (Pandemic surge): Highland property was one of the pandemic winners. Remote working, the lifestyle relocation trend, and Scotland's outdoor appeal drove prices from £168,008 in January 2020 to £204,712 by December 2022. That is 21.8% growth in under three years. The NC500 tourism boom added fuel. Highland outperformed Scotland as a whole during this period.
- 2023 (Plateau): Interest rate rises cooled the market. Mid-year prices dipped to £201,679 by June, but recovered to £206,748 by December. Annual change bottomed at -0.6% in June before turning positive. A mild and brief adjustment.
- 2024-2025 (Fresh growth): Prices stabilised through 2024 and accelerated in the second half of 2025. By December 2025, the average reached £216,711 with annual growth of 4.8%. Highland now sits 47.0% above its pre-crash peak.
Long-Term Property Value Growth in Highland
- 5 years (Dec 2020-Dec 2025): +24.6% (£173,880 to £216,711)
- 10 years (Dec 2015-Dec 2025): +46.3% (£148,151 to £216,711)
- 20 years (Dec 2005-Dec 2025): +86.1% (£116,447 to £216,711)
- Since 2004 (Jan 2004-Dec 2025): +163.7% (£82,166 to £216,711)
Highland's crash story is different from most UK cities. The initial 2008-2009 decline was shallow at 9.6%, but the double dip extended the full recovery to 7 years. Investors who held through both dips are now sitting on 47% gains above the pre-crash peak. The structural shift since 2007 is significant: the Green Freeport, Inverness Campus, and Castle Experience did not exist then. The economic base is broader and the employment pipeline is longer than it was during the last downturn.
Source: UK House Price Index for Highland, January 2004 to December 2025.
Thinking of Buying?
We have off-market investment properties averaging 8%+ annual yield.
View Property DealsSold House Prices in Inverness
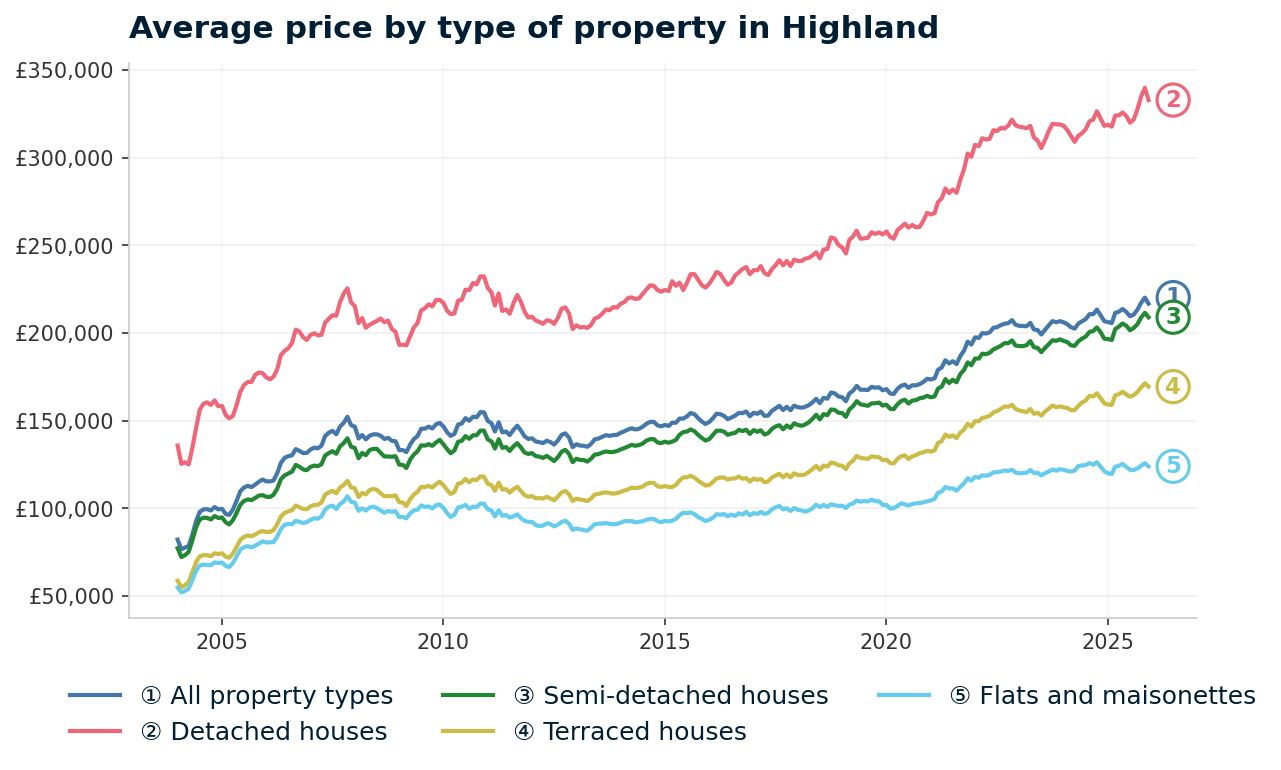
Highland's average sold price sits above Scotland's national average. That sounds counterintuitive for a rural council area, but it is a composition effect. Highland has a higher proportion of detached houses than urban Scotland, which pulls the overall average up to £216,711 versus Scotland's £190,649. When you compare like for like by property type, every category in Highland is cheaper than the Scottish average.
Against the UK average of £270,259, the headline discount is 19.8%. Flats in Highland average £123,961, which is 35.7% below the UK average of £192,826. That is the widest discount of any property type and reflects a market where flat stock is predominantly traditional tenement and purpose-built housing rather than the premium new-build apartments that inflate flat averages in Edinburgh or Glasgow.
| Property Type | Highland Average | UK Average | Difference |
|---|---|---|---|
| Detached houses | £332,809 | £440,564 | -24.5% |
| Semi-detached houses | £208,981 | £275,313 | -24.1% |
| Terraced houses | £169,417 | £229,449 | -26.2% |
| Flats and maisonettes | £123,961 | £192,826 | -35.7% |
| All property types | £216,711 | £270,259 | -19.8% |
Among house types, terraced properties show the deepest percentage discount at 26.2%. Highland's terraced stock at £169,417 sits £60,032 below the UK average. Terraced properties in Inverness's central postcodes (IV1 and IV3) are where the traditional rental market is concentrated. The lower entry price relative to UK norms creates scope for stronger yields when rental data becomes available.
Detached houses at £332,809 are 24.5% below the UK's £440,564. This reflects Highland's rural and semi-rural character. Detached properties dominate the housing stock outside Inverness itself, and the absence of a London commuter premium keeps prices grounded. Against Scotland's detached average of £349,959, Highland is 4.9% cheaper. The composition paradox works both ways: Highland's overall average exceeds Scotland's, but each individual property type is cheaper.
Semi-detached houses at £208,981 sit 24.1% below UK levels. In Inverness, semis are concentrated in the IV2 suburbs (Inshes, Raigmore) and offer the family housing stock that drives the city's main residential market. Against Scotland's semi average of £218,118, Highland is 4.2% below.
Property Data Sources
Our location guide relies on diverse, authoritative datasets including:
- UK House Price Index
- Ministry of Housing, Communities and Local Government
- Ordnance Survey Data Hub
- Propertydata.co.uk
We update our property data quarterly to ensure accuracy. Last update: April 2026. All data is presented as provided by our sources without adjustments or amendments.
Price Per Square Foot in Inverness
A square foot of property in Inverness costs between £210 and £253, depending on the postcode. Four of the city's five postcodes return price per square foot data from PropertyData (IV13 Tomatin has insufficient transactions). This metric strips out the property-size bias that makes average prices misleading. It shows what you are actually paying for space, regardless of whether the property is a two-bed flat or a four-bed detached.
Inverness's price per square foot ranges from £210 in IV5 to £253 in IV1, a spread of 20.5% across four postcodes. That is a tighter range than most cities, reflecting a market without the extreme price gradients that separate inner-city and suburban areas in places like Edinburgh or Glasgow.
| Rank | Area | Price Per Sq Ft |
|---|---|---|
| 1 | IV5 (Glenelg) | £210 |
| 2 | IV3 (Merkinch, Scorguie) | £215 |
| 3 | IV2 (Inshes, Raigmore) | £243 |
| 4 | IV1 (City Centre) | £253 |
| — | IV13 (Tomatin) | Not enough data |
IV1 City Centre commands the highest price per square foot at £253. Central Inverness has limited housing stock relative to demand, and proximity to the river, castle, and Victorian Market pushes per-foot costs above the suburbs. The data is based on 41 transactions, so the sample is smaller than IV2's 961 transactions. Read IV1's figure as directionally accurate rather than statistically definitive.
IV5 at £210 is the cheapest space, but the context matters. Glenelg is a rural postcode covering a wide area west of Inverness. Only 23 transactions inform this figure. Rural properties tend to have lower per-foot costs because land prices are lower, not because the buildings themselves are inferior.
IV5 is primarily a lifestyle or holiday let market, not a traditional buy-to-let area. Investors looking to add value through refurbishment can search for renovation properties across the Highlands.
IV2 and IV3 sit in the middle at £243 and £215 respectively. These are the postcodes with the deepest data: 961 and 364 transactions. IV3 (Merkinch, Scorguie) at £215 offers cheaper space than the suburban IV2 (Inshes, Raigmore) at £243. IV3 has historically been one of Inverness's more affordable areas, and the £28 per square foot gap between the two postcodes reflects that positioning.
Figures reflect averages across all property types and ages. Individual values depend on condition, location within the postcode, and building age.
Houses for Sale in Inverness: Asking Prices
Asking prices in Inverness range from £249,635 to £258,400 across the two postcodes with data. IV1, IV5, and IV13 have insufficient current listings for reliable averages, so this is a partial picture. Read these figures alongside the sold price analysis from the UK House Price Index, which covers the entire Highland council area.
Across the two data-available postcodes, asking prices range from £249,635 in IV2 to £258,400 in IV3. That is a narrow £8,765 spread. For investors, the entry price is essentially the same regardless of which postcode they target within Inverness's data coverage.
| Rank | Area | Average Asking Price |
|---|---|---|
| 1 | IV2 (Inshes, Raigmore) | £249,635 |
| 2 | IV3 (Merkinch, Scorguie) | £258,400 |
| — | IV1 (City Centre) | Not enough data |
| — | IV5 (Glenelg) | Not enough data |
| — | IV13 (Tomatin) | Not enough data |
IV2 at £249,635 is the lower entry point. Inshes and Raigmore are Inverness's main suburban areas, close to Raigmore Hospital and the Inverness Campus. The postcode covers a mix of newer-build estates and established residential streets. At 86 sales per month, it also has the deepest transaction market in the city.
IV3 at £258,400 covers Merkinch and Scorguie on the western side of the city. Merkinch has historically been one of Inverness's more affordable neighbourhoods, but recent regeneration and the proximity to the city centre have pushed asking prices above IV2. The 7.5% one-year growth in IV3 (versus 0.3% in IV2) suggests the market is repricing this area upward. For investors looking for below market value properties, areas undergoing repricing often present opportunities before the market fully adjusts.
The mean asking price across both postcodes is £254,017. That figure appears in the comparison section, where Inverness is measured against Aberdeen, Edinburgh, Glasgow, and Dundee. Buyers looking for lower entry points may also find opportunities through repossessed properties.

House Price Growth in Inverness
Both data-available postcodes show positive returns across one, three, and five-year horizons. IV1, IV5, and IV13 do not return growth figures, so the picture is limited to Inverness's two main residential areas. The interesting story is in the divergence between them.
IV2 and IV3 have delivered comparable five-year growth: 16.0% and 14.1% respectively. The divergence is in the one-year figures. IV2 grew just 0.3% in the last twelve months while IV3 surged 7.5%. That split suggests IV3 is catching up after a period of underperformance relative to the suburbs.
| Area | 1 Year | 3 Years | 5 Years |
|---|---|---|---|
| IV2 (Inshes, Raigmore) | 0.3% | 10.4% | 16.0% |
| IV3 (Merkinch, Scorguie) | 7.5% | 15.1% | 14.1% |
| IV1 (City Centre) | Not enough data | Not enough data | Not enough data |
| IV5 (Glenelg) | Not enough data | Not enough data | Not enough data |
| IV13 (Tomatin) | Not enough data | Not enough data | Not enough data |
IV3's three-year growth of 15.1% outpaces IV2's 10.4% by nearly 5 percentage points. Over three years, an investor who bought a property at IV3's average asking price of £258,400 would have entered at approximately £224,500. That is £33,900 in equity growth. IV2's equivalent gain is roughly £22,900 from a lower starting point. Both postcodes have delivered capital appreciation above inflation.
IV2's near-flat one-year growth of 0.3% may reflect a temporary ceiling. At £249,635, IV2 asking prices are close to the Highland council area average sold price of £216,711. The suburban market may have reached a point where price sensitivity kicks in. Or it may simply reflect quarterly data noise in a market with 86 sales per month. One year of data is a single snapshot.
At the council area level, the UK House Price Index shows Highland growing at 4.8% annually (December 2025). That is stronger than either postcode's one-year figure, which suggests the growth is being driven by parts of Highland outside the Inverness postcodes covered here.
Monthly Property Sales in Inverness
IV2 dominates Inverness's transaction market with 86 sales per month, nearly three times IV3's 32. The remaining three postcodes do not return transaction data from PropertyData.
Combined, the two data-available postcodes show 118 transactions per month with turnover rates of 100% and 113%. Turnover above 100% means properties are selling faster than new stock comes to market. In IV3, that 113% figure suggests strong buyer competition in the Merkinch and Scorguie areas.
| Area | Sales Per Month | Turnover | Asking Price |
|---|---|---|---|
| IV2 (Inshes, Raigmore) | 86 | 100% | £249,635 |
| IV3 (Merkinch, Scorguie) | 32 | 113% | £258,400 |
| IV1 (City Centre) | Not enough data | Not enough data | Not enough data |
| IV5 (Glenelg) | Not enough data | Not enough data | Not enough data |
| IV13 (Tomatin) | Not enough data | Not enough data | Not enough data |
IV2's 86 sales per month gives it the liquidity that matters for exit planning. If you need to sell a property in Inverness, IV2 is where the buyer pool sits. The suburban character of Inshes and Raigmore attracts both owner-occupiers and investors, creating competition that supports resale values. An investor holding a property in IV2 can expect a functioning market when the time comes to sell.
IV3's 32 sales per month is a thinner market but the 113% turnover compensates. Properties in Merkinch and Scorguie are selling faster than new stock is listed. That dynamic favours sellers and suggests demand is outstripping supply. For buy-to-let investors, high turnover paired with strong recent growth (7.5% one-year) makes IV3 the more active part of the Inverness market right now.
Property Data Sources
Our location guide relies on diverse, authoritative datasets including:
- UK House Price Index
- Ministry of Housing, Communities and Local Government
- Ordnance Survey Data Hub
- Propertydata.co.uk
We update our property data quarterly to ensure accuracy. Last update: April 2026. All data is presented as provided by our sources without adjustments or amendments.

Inverness Rental Market Analysis
Zero of Inverness's five postcodes return rental data from PropertyData. No average monthly rents. No gross rental yields. That blank sheet is unusual among our location guides and reflects the limitations of data aggregation in smaller Scottish markets rather than an absence of rental demand.
Inverness has an active rental market. Raigmore Hospital, UHI Inverness, Highland Council, and the growing renewable energy sector all generate tenant demand. The gap is in the data, not the market. For investors weighing up whether buy-to-let rental property is a worthwhile investment in Inverness, local letting agents and portals will provide current rental figures that PropertyData's national aggregation does not capture. Investors looking for buy-to-let property for sale in Scotland can also compare against cities where rental data is available, such as Aberdeen, Edinburgh, Glasgow, and Dundee.
Average Rent & Gross Rental Yields in Inverness
The standard yield table cannot be populated for Inverness. PropertyData does not return rental data for any of the city's five postcodes. All five postcodes show "Not enough data" for both average monthly rent and gross rental yield.
| Area | Average Monthly Rent | Average Asking Price | Gross Yield |
|---|---|---|---|
| IV1 (City Centre) | Not enough data | Not enough data | Not enough data |
| IV2 (Inshes, Raigmore) | Not enough data | £249,635 | Not enough data |
| IV3 (Merkinch, Scorguie) | Not enough data | £258,400 | Not enough data |
| IV5 (Glenelg) | Not enough data | Not enough data | Not enough data |
| IV13 (Tomatin) | Not enough data | Not enough data | Not enough data |
Flats to Rent in Inverness and the Holiday Let Factor
The data gap is significant but not the full picture. Inverness sits in a region where a substantial portion of the rental market operates through short-term and holiday lets rather than traditional long-term tenancies. Loch Ness, the NC500, and the broader Highland tourism economy drive demand for furnished holiday accommodation that PropertyData's standard rental aggregation does not capture. For investors considering this market, our guide on the best areas for holiday lets in the UK provides context on the sector.
Scotland also has distinct short-term let licensing requirements. The Licensing Order 2022 requires all short-term let operators in Scotland to hold a licence from their local authority. Highland Council operates this licensing scheme. Investors entering the Inverness holiday let market need to factor in licensing costs and compliance alongside the standard buy-to-let considerations.
Is Inverness Rent High?
Highland's median gross weekly salary of £764.20 sits above the Great Britain median of £752.40, though marginally below Scotland's £767.40. Without postcode-level rent figures from PropertyData, the standard rent-as-percentage-of-income calculation cannot be applied to Inverness. The table below shows this data gap across all five postcodes.
| Rank | Area | Rent as % of Income |
|---|---|---|
| — | IV1 (City Centre) | Not enough data |
| — | IV2 (Inshes, Raigmore) | Not enough data |
| — | IV3 (Merkinch, Scorguie) | Not enough data |
| — | IV5 (Glenelg) | Not enough data |
| — | IV13 (Tomatin) | Not enough data |
The median gross weekly salary in Highland is £764.20, which equates to £3,311 per month or £39,740 per year. This is above the Great Britain median of £752.40 per week and marginally below Scotland's £767.40. Data from the Nomis Labour Market Profile (ASHE 2025).
Highland's above-average wages are a positive signal for affordability. If rents in Inverness track with asking prices (which sit 6.3x to 6.5x local earnings), the rent-to-income ratios are likely to be manageable. Higher local wages mean tenants can absorb rents without the affordability pressure that compresses yields in lower-wage cities. For landlords, this reduces arrears risk. But until postcode-level rental data becomes available, these are observations based on the earnings data rather than confirmed rental metrics.
Thinking of Buying?
We have off-market investment properties averaging 8%+ annual yield.
View Property DealsAre Inverness House Prices High? Price-to-Earnings Ratios
Inverness's earnings data tells a different story from many UK cities covered in our guides. The median annual salary of £39,740 is above the Great Britain median of £39,125. That means the price-to-earnings ratio here is driven more by property prices than by low wages.
Purchasing a property in Inverness requires between 6.3 and 6.5 times the local median annual salary. This is based on the Nomis Labour Market Profile for Highland showing the median gross annual income for Highland residents is £39,740.
Both data-available postcodes sit below the UK benchmark of 6.9x (calculated from the UK average sold price of £270,259 against Great Britain's median annual salary of £39,125). Scotland's equivalent benchmark is 4.8x (Scotland's £190,649 against Scotland's £39,905), but that figure reflects Scotland's lower overall average pulled down by very affordable areas in the Central Belt and Ayrshire.
| Rank | Area | Price-to-Earnings Ratio |
|---|---|---|
| 1 | IV2 (Inshes, Raigmore) | 6.3x |
| 2 | IV3 (Merkinch, Scorguie) | 6.5x |
| — | IV1 (City Centre) | Not enough data |
| — | IV5 (Glenelg) | Not enough data |
| — | IV13 (Tomatin) | Not enough data |
At 6.3x and 6.5x, Inverness is more affordable than many southern English cities but above the Scottish average. Edinburgh sits at approximately 8.0x, while Aberdeen and Dundee come in lower due to their cheaper asking prices. For investors comparing entry points across Scotland, Inverness sits in the middle of the pack: more affordable than the capital, more expensive than the post-oil-downturn Aberdeen market.
The combination of above-average wages and below-UK asking prices creates a balanced affordability picture. Tenants earning above the GB median can absorb property costs more comfortably. Investors can enter at ratios below the UK benchmark. Whether Inverness maintains this balance as the Green Freeport drives employment and housing demand remains to be seen. The council has approved sites for over 7,900 new homes, which would add supply alongside demand.
Deposit Requirements in Inverness
The standard buy-to-let deposit is 30%. The table below reflects this benchmark, which unlocks better interest rates and a wider range of mortgage products. The rate secured directly affects monthly cash flow.
Inverness entry deposits range from £74,891 in IV2 to £77,520 in IV3. That £2,629 difference is negligible. For investors comparing entry costs across Scotland, these deposits are higher than Aberdeen (where asking prices start from £156,439) but well below Edinburgh (£319,974 mean asking price). If you are looking to build a property portfolio, the entry cost in Inverness sits in the mid-range for Scottish cities. Investors exploring routes with lower upfront capital can read about no-deposit investment property options.
| Rank | Area | 30% Deposit Required |
|---|---|---|
| 1 | IV2 (Inshes, Raigmore) | £74,891 |
| 2 | IV3 (Merkinch, Scorguie) | £77,520 |
| — | IV1 (City Centre) | Not enough data |
| — | IV5 (Glenelg) | Not enough data |
| — | IV13 (Tomatin) | Not enough data |
Scotland uses Land and Buildings Transaction Tax (LBTT) instead of Stamp Duty Land Tax. The rates and thresholds differ from England and Wales. An Additional Dwelling Supplement (ADS) also applies to second property purchases in Scotland, adding to the upfront cost. Use our stamp duty calculator for England and Wales figures, and check Revenue Scotland's website for current LBTT and ADS rates. For a full breakdown of all upfront costs, see our guide to buy-to-let costs.
What the Inverness Data Tells Buy-to-Let Investors
Inverness is a capital growth story. The data available points in one direction: prices growing above the UK average, sold prices discounted against UK benchmarks, and above-average local wages supporting affordability. The missing rental data means this guide cannot assess yield the way our other location guides do. That is a limitation investors need to account for.
Highland's average sold price has grown 163.7% since January 2004, from £82,166 to £216,711. Five-year growth of 24.6% and ten-year growth of 46.3% both outpace UK averages. The Green Freeport designation, projecting 11,000 jobs and £6.5 billion of investment over 25 years, adds a structural catalyst that did not exist during the last growth cycle. For investors exploring investment property options across the UK, Inverness offers a growth profile underpinned by public infrastructure spending.
IV2 (Inshes, Raigmore) has the deeper data and the lower entry point. 86 sales per month, 100% turnover, asking price of £249,635, five-year growth of 16.0%. It is Inverness's main residential market with the transaction depth that matters for exit strategy. IV3 (Merkinch, Scorguie) shows stronger recent momentum: 7.5% one-year growth and 113% turnover, but with a thinner market of 32 sales per month.
The holiday let angle is part of the Inverness calculation. The NC500, Loch Ness, and the new Castle Experience create year-round tourism demand. Investors considering Inverness as a holiday let location rather than a traditional long-term rental will find a different return profile from what the missing PropertyData figures suggest. Scotland's short-term let licensing adds compliance requirements but also acts as a barrier to entry that limits supply. For investors with deeper pockets, off-market property in tourism hotspots can offer entry points that the open market does not always surface.
How Inverness Buy-to-Let Compares to Other Scottish Cities
Inverness's mean asking price of £254,017 puts it second among five Scottish cities, behind only Edinburgh's £319,974. The table below compares Inverness against four locations using the same methodology: mean asking price across all postcodes with data, mean monthly rent across postcodes with data, and top single-postcode gross yield.
| Location | Mean Asking Price | Mean Monthly Rent | Top Gross Yield |
|---|---|---|---|
| Inverness | £254,017 | Not enough data | Not enough data |
| Aberdeen | £156,439 | £807 | 8.6% |
| Dundee | £201,050 | £799 | 7.0% |
| Edinburgh | £319,974 | £1,429 | 6.6% |
| Glasgow | £180,998 | £1,046 | 8.1% |
Inverness is the second most expensive entry point in this group, behind only Edinburgh. Mean asking prices of £254,017 are £73,019 above Glasgow and £97,578 above Aberdeen. Without rental data, a direct yield comparison is not possible, but the price premium tells part of the story. Inverness's asking prices reflect lifestyle and tourism demand that the Central Belt cities do not have.
Aberdeen at £156,439 is the cheapest entry point with the highest top yield at 8.6%. The post-oil-downturn repricing left Aberdeen with low asking prices that have since recovered rental demand. Dundee at £201,050 offers a similar profile: affordable entry and strong yields at 7.0%. Both deliver on income in ways that Inverness's data cannot currently demonstrate.
For investors comparing across the best buy-to-let locations in Scotland, Inverness is the growth and lifestyle play. Aberdeen and Glasgow are the yield plays. Edinburgh is the premium market. Dundee sits in between. Inverness's Green Freeport and tourism base give it a growth catalyst that the other four do not share, but the absence of measurable rental returns makes it harder to model on a spreadsheet.
Frequently Asked Questions
How does Inverness compare to other Scottish cities for property investment?
Inverness is the second most expensive entry point at £254,017 mean asking price, behind Edinburgh (£319,974) and ahead of Dundee (£201,050), Glasgow (£180,998), and Aberdeen (£156,439). Highland's average sold price of £216,711 sits 19.8% below the UK average. The key difference is that Inverness currently has no postcode-level rental or yield data from PropertyData, while Aberdeen, Dundee, Edinburgh, and Glasgow all have measurable rental returns. Inverness's investment profile is driven by capital growth and the tourism economy rather than demonstrable yield metrics.
What is the average rent in Inverness?
No postcode-level rental data is currently available for Inverness from PropertyData. All five postcodes (IV1, IV2, IV3, IV5, IV13) return no figures, so gross rental yields cannot be calculated from our standard data sources. Local letting agents and property portals provide current rental figures for the Inverness market. The Highland median annual salary of £39,740 (above the Great Britain median of £39,125) suggests local tenants have above-average earning capacity, which generally supports rental affordability.
What areas make up the Inverness property market?
Five postcodes make up the Inverness property market: IV1 (City Centre), IV2 (Inshes, Raigmore), IV3 (Merkinch, Scorguie), IV5 (Glenelg), and IV13 (Tomatin). IV2 is the largest residential market with 86 sales per month and asking prices of £249,635. IV3 covers western Inverness at £258,400 with 32 sales per month. IV1, IV5, and IV13 have limited PropertyData coverage. The postcodes span from the urban city centre to rural Highland areas, with IV5 (Glenelg) and IV13 (Tomatin) being predominantly rural.
How does the Green Freeport affect the Inverness housing market?
Over 11,000 long-term jobs and £6.5 billion in total investment are projected over 25 years from the Inverness and Cromarty Firth Green Freeport. Highland Council has approved nine housing sites for over 7,900 new homes to support this growth, including up to 2,000 at Inverness East and 1,500 at Welltown of Leys. The employment impact is not yet reflected in the property data. The freeport's MoU was signed in September 2025, and the full economic effect will build over the coming decade. Sumitomo Electric's £350 million subsea cable facility at the Port of Nigg is an early indicator of the scale of industrial investment flowing into the region.
Is there a holiday let market in Inverness?
Inverness has year-round tourism demand driven by Loch Ness, the North Coast 500 route, Culloden Battlefield, the new Castle Experience visitor attraction, and proximity to Cairngorms National Park. Scotland's Short-Term Let Licensing Order 2022 requires all holiday let operators to hold a licence from Highland Council, adding compliance requirements and costs. The licensing regime limits supply, which can support pricing for licensed operators. For broader context on the sector, the Scottish Government's licensing framework and Inverness's year-round tourism calendar create a distinct operating environment compared to English holiday let markets.