Where to Buy Property Investments in Lancaster: Yields of 5.5%
Lancaster's gross rental yields reach 5.5% in LA1, with asking prices starting from £200,652 in LA4. Average sold prices sit 31.2% below the England average, and the district's population grew 3.3% to 142,934 between the 2011 and 2021 censuses.
Lancaster's average sold price of £200,827 makes it one of the most affordable districts in the North West for buy-to-let property. That is 7.6% below the North West regional average and 31.2% below England. Rental data is available for 4 of the district's 7 postcodes, with monthly rents ranging from £765 in LA3 to £1,122 in PR3.
This guide covers all 7 Lancaster postcodes from LA1 to LA6 plus PR3 under the Lancaster district council (ONS code E07000121). The district stretches from Morecambe Bay in the west to the Yorkshire Dales border at Kirkby Lonsdale, taking in the university city of Lancaster and the seaside town of Morecambe. Investors comparing options in the region may also consider Blackpool, Preston, or Carlisle. Browse all our North West location guides.
Article updated: March 2026
Lancaster Buy-to-Let Market Overview 2026
Lancaster combines a university city economy with seaside and rural postcodes, creating a wide range of entry points and tenant profiles across 7 postcodes.
- Average sold price: £200,827 (31.2% below England's £291,865)
- Asking price range: £200,652 (LA4) to £350,834 (LA6)
- Rental yields: 4.1% (LA3) to 5.5% (LA1) across postcodes with rental data
- Rental income: Monthly rents from £765 (LA3) to £1,122 (PR3)
- Price per sq ft: Sold prices from £211/sq ft (LA4) to £288/sq ft (LA6)
- Market activity: Sales ranging from 13 per month (LA6) to 58 per month (LA1)
- Deposit requirements: 30% deposits range from £60,196 (LA4) to £105,250 (LA6)
- Affordability ratios: Property prices from 5.8 to 10.1 times Lancaster's median annual salary of £34,890
Contents

-
by Robert Jones, Founder of Property Investments UK
With two decades in UK property, Rob has been investing in buy-to-let since 2005, and uses property data to develop tools for property market analysis.

Property Data Sources
Our location guide relies on diverse, authoritative datasets including:
- HM Land Registry UK House Price Index
- Ministry of Housing, Communities and Local Government
- Ordnance Survey Data Hub
- Propertydata.co.uk
We update our property data quarterly to ensure accuracy. Last update: March 2026. All data is presented as provided by our sources without adjustments or amendments.
Why Invest in Lancaster?
Two universities, around 16,000 students, and an NHS hospital anchor an employment rate of 81.1% in Lancaster, well above the North West's 74.2%. Lancaster University sits just south of the city and consistently ranks among the UK's top 15 universities. The University of Cumbria adds a city centre campus. Together, they create a student and academic population that underpins letting demand in LA1 and LA2. Many second and third-year students move from campus into private rented houses and HMOs in LA1, supporting the city centre's 5.5% gross yield.
The district is more than the city itself. Morecambe, the seaside town three miles west, brings a different housing market entirely. LA3 and LA4 cover Morecambe and Heysham, where lower prices and a regeneration push around the seafront are starting to shift the investment profile. Morecambe Bay also draws interest from investors considering buying a holiday let, with the seafront regeneration adding to the area's appeal. Carnforth (LA5) and Kirkby Lonsdale (LA6) sit further out in rural settings, while PR3 covers Garstang and Longridge to the south.
Between the 2011 and 2021 censuses, Lancaster's population grew from 138,375 to 142,934, a rise of 3.3%. That is below the England average of 6.6%, but steady growth backed by two universities and the NHS rather than speculative development.
Earnings in Lancaster sit below both the regional and national averages. The median annual salary is £34,890, compared to £37,445 across the North West and £39,125 for Great Britain. Lower local wages combined with affordable house prices keep rental yields competitive even where absolute rents are modest.
The Royal Lancaster Infirmary is the district's largest NHS employer, and the health and education sectors between them account for a significant share of local employment. Lancaster also benefits from its position on the West Coast Main Line, with direct trains to Manchester and London Euston.
Lancaster Economic Summary
- Population: 142,934 (2021 Census). Growth of 3.3% from 2011.
- Median annual salary: £34,890 (Lancaster), £37,445 (North West), £39,125 (Great Britain)
- Employment rate: 81.1% (Lancaster), 74.2% (North West), 75.6% (Great Britain)
- Key employment sectors: Higher education, healthcare, public administration, tourism, agriculture
Source: ONS Census 2021, Nomis Labour Market Profile (ASHE 2025, Employment Oct 2024-Sep 2025)
Lancaster's employment rate of 81.1% sits well above both the North West average of 74.2% and the national 75.6%. Unemployment data for Lancaster is suppressed in the Annual Population Survey due to the small sample size, which is common for smaller districts. The high employment rate is the more reliable indicator here, and it points to a labour market anchored by stable public sector employers.
Regeneration and Investment in Lancaster
Over £100 million of active regeneration investment is reshaping Lancaster's city centre and Morecambe seafront. The Canal Quarter programme is transforming the former brewery district with new housing, commercial space, and a hotel. Morecambe's seafront regeneration adds a second investment story to the district.
- Canal Quarter, Brewery Lane (site clearance underway, £100 million): Axis-RE and Marco Living acquired the three-acre Mitchell's Brewery site in May 2025 and plan a mixed-use scheme including a 125-key hotel, residential units, student accommodation, and a restored brewery venue. For investors, £100m of private capital flowing into Lancaster's compact city centre is transformational for surrounding property values. Updates at Beyond Radio.
- Canal Quarter Housing, Nelson Street (approved, 233 homes planned): The residential component of the wider Canal Quarter programme, with 39 homes approved on the Nelson Street car park and a wider vision for 233 homes across Nelson Street and St Leonardgate. Funded through the Brownfield Land Release Fund, this adds significant new housing supply to a constrained city centre market. Updates at Beyond Radio.
- Mainway Estate Regeneration (seeking delivery partner, planning consent secured): Lancaster City Council has planning consent to regenerate the Mainway Estate on the banks of the River Lune, replacing 1960s council housing with approximately 400 new homes (a net increase of around 150). Planning consent already secured removes a key delivery risk. Updates at Place North West.

Lancaster Property Market Analysis
When Was the Last House Price Crash in Lancaster?
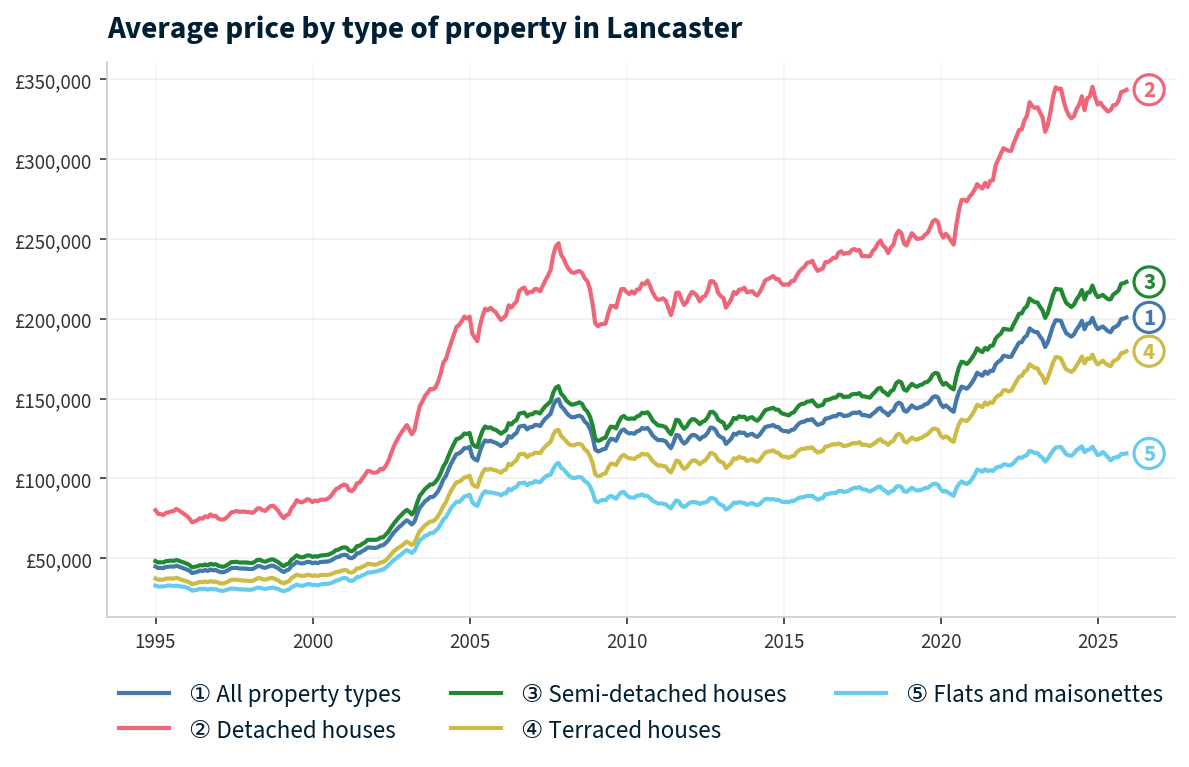
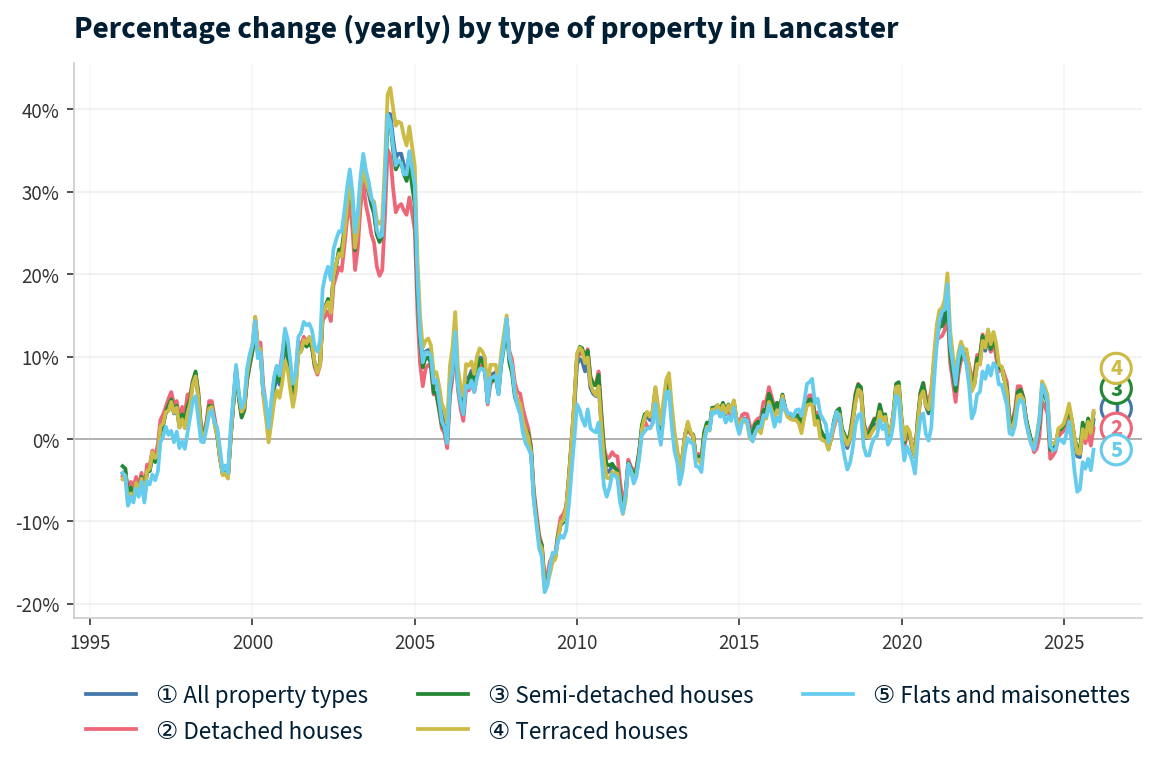
Lancaster house prices fell 21.9% between November 2007 and February 2009, dropping from £149,549 to £116,790, and the recovery took 12 years. All sold property prices come from the HM Land Registry House Price Index, running from January 1995 to December 2025. The data shows one deep crash, an exceptionally slow recovery, and a pandemic-era surge.
- 1995-2000 (Stagnation): Lancaster began 1995 at £44,710. Prices barely moved for five years. By January 2000, the average was still just £46,802. While London and the South East raced ahead, Lancaster sat still.
- 2000-2007 (The boom): Prices tripled in seven years, rising from £46,802 in January 2000 to a peak of £149,549 in November 2007. The sharpest growth came in 2004-2005, fuelled by cheap credit and speculative demand that pushed prices well beyond what local wages could sustain.
- 2007-2009 (The financial crisis): From the peak of £149,549 in November 2007 to the trough of £116,790 in February 2009, Lancaster lost 21.9% of its value in 15 months. The worst annual change reading was -17.7% in January 2009. All property types fell almost equally: detached -21.0%, semi-detached -21.7%, terraced -22.2%, flats -22.4%. Lancaster's decline of 21.9% was deeper than both the North West region (-18.2%) and England overall (-18.2%).
England recovered its pre-crash peak in about 6.5 years. The North West took 9.5 years. Lancaster took 12.
- 2009-2013 (The long recovery begins): A brief bounce to £128,948 by January 2010 was followed by a second dip. Prices traded between £120,000 and £130,000 for four years, with negative annual changes returning in late 2010 through 2011. By December 2013, the average was £127,443. Still 14.8% below the pre-crash peak.
- 2014-2016 (Slow recovery): Growth returned but at 2-4% per year. By December 2016, prices reached £138,953. Still 7.1% below the November 2007 peak. Lancaster's recovery was slower than most UK cities.
- 2017-2019 (Gradual climb): Prices rose from £138,953 in December 2016 to £150,669 by December 2019. Lancaster first passed its pre-crash peak in October 2019 at £150,793. That is 12 years from the November 2007 peak.
- 2020-2022 (Pandemic surge): Prices jumped from £145,687 in March 2020 to £192,667 by December 2022. That is 32.2% growth in under three years. The stamp duty holiday and remote working shift benefited Lancaster's combination of rural space and university city amenities.
- 2023 (Rate shock): Prices held remarkably steady. December 2023 came in at £194,460, just 0.9% above December 2022. Lancaster avoided the sharper dips seen in some southern markets.
- 2024-2025 (Current): By December 2025, the average reached £200,827 with annual growth of 2.3%. Lancaster now sits 34.3% above its pre-crash peak.
Long-Term Property Value Growth in Lancaster
- 5 years (2020-2025): +27.3% (£157,796 to £200,827)
- 10 years (2015-2025): +46.5% (£137,076 to £200,827)
- 15 years (2010-2025): +60.3% (£125,289 to £200,827)
- 20 years (2005-2025): +65.5% (£121,336 to £200,827)
- 30 years (1995-2025): +362.2% (£43,453 to £200,827)
The 2008 crash is the key reference point for Lancaster investors assessing downside risk. A 21.9% decline took 12 years to recover. That is significantly slower than the national average and reflects Lancaster's reliance on a smaller, less diversified economy. The recovery eventually came. And the district's structural advantages are stronger now than in 2007. Two universities, an NHS hospital anchor, and a £100m Canal Quarter regeneration provide a broader base than the credit-fuelled market of the mid-2000s.
Source: HM Land Registry House Price Index for Lancaster, January 1995 to December 2025.
Thinking of Buying?
We have off-market investment properties averaging 8%+ annual yield.
View Property DealsSold House Prices in Lancaster
Lancaster's average sold price of £200,827 sits 31.2% below England's £291,865 and 7.6% below the North West's £217,428. The discount varies sharply by property type. Flats show the widest gap at 47.3% below the England average, while semi-detached houses show the narrowest at 22.9%.
Compare the flats column with the detached column in the table below. The spread between Lancaster's cheapest and most expensive property types is £227,867. That tells you this is a market with genuinely different investment propositions depending on what you buy.
| Property Type | Lancaster Average | England Average | Difference |
|---|---|---|---|
| Detached houses | £343,459 | £471,667 | -27.2% |
| Semi-detached houses | £223,053 | £289,135 | -22.9% |
| Terraced houses | £179,662 | £244,830 | -26.6% |
| Flats and maisonettes | £115,592 | £219,340 | -47.3% |
| All property types | £200,827 | £291,865 | -31.2% |
Flats and apartments in Lancaster average £115,592, a 47.3% discount to England's £219,340. That is the deepest discount in the table. Lancaster's flat stock is largely older conversions rather than purpose-built apartment blocks, concentrated in the city centre (LA1) and Morecambe (LA3, LA4). For yield-focused investors, this discount creates entry points that can generate meaningful returns from modest rents. Apartments in Lancaster remain among the cheapest in the North West relative to national averages.
Detached houses sit 27.2% below England at £343,459. The rural postcodes of LA5, LA6, and PR3 account for most detached stock. These are not typical buy-to-let properties. Three of those postcodes have no rental data, which tells you the letting market for detached homes in Lancaster's rural fringe is thin.
Terraced houses average £179,662, a 26.6% discount. Terraces are the backbone of Lancaster's rental market, concentrated in the city centre (LA1) and Morecambe (LA3, LA4). They offer the combination of low entry prices and tenant demand that most buy-to-let investors look for.
Semi-detached houses show the narrowest gap at 22.9% below England. Semis attract owner-occupier families across all Lancaster postcodes. That owner-occupier competition keeps semi prices closer to the national average than any other type.
Property Data Sources
Our location guide relies on diverse, authoritative datasets including:
- HM Land Registry UK House Price Index
- Ministry of Housing, Communities and Local Government
- Ordnance Survey Data Hub
- Propertydata.co.uk
We update our property data quarterly to ensure accuracy. Last update: March 2026. All data is presented as provided by our sources without adjustments or amendments.
Price Per Square Foot in Lancaster
What are you actually paying for space in Lancaster? From £211 per square foot in LA4 to £288 in LA6, a 36% spread across seven postcodes. That is a narrower range than many cities, suggesting the underlying value of space is more consistent across this district than the headline asking prices imply. Price per square foot strips out size bias and shows what each postcode really costs per unit of floor area.
| Rank | Area | Price Per Sq Ft |
|---|---|---|
| 1 | LA4 (Morecambe) | £211 |
| 2 | LA3 (Morecambe (Heysham)) | £212 |
| 3 | LA1 (City Centre) | £223 |
| 4 | PR3 (Garstang, Longridge) | £250 |
| 5 | LA5 (Bolton-le-Sands, Carnforth) | £259 |
| 6 | LA2 (Lancaster (Rural), Galgate) | £264 |
| 7 | LA6 (Kirkby Lonsdale) | £288 |
LA4 and LA3 in Morecambe share the cheapest space in the district at £211 and £212 per square foot. These are the seaside postcodes where older terraced stock and ex-guesthouse conversions keep per-foot costs low. LA4 also delivers the second-highest yield among postcodes with rental data at 4.7%. Investors buying for income get the most space for their money here.
LA1 City Centre at £223 per square foot sits in the middle of the table despite asking prices of just £209,119. The student and young professional market in Lancaster's centre means smaller properties per listing, which pushes the price-per-foot figure higher relative to headline asking prices.
LA6 Kirkby Lonsdale at £288 per square foot reflects the Yorkshire Dales fringe premium. This is lifestyle-driven pricing. Larger period properties command rates that have nothing to do with the rental market. LA6 has no rental data and just 13 sales per month.
Figures reflect averages across all property types and ages. Individual values depend on condition, location within the postcode, and building age.
For Sale Asking Prices in Lancaster
Lancaster's cheapest postcode, LA4, has an asking price of £200,652. That is within £2,500 of Blackpool's district-wide mean of £198,183. At the other end, LA6 Kirkby Lonsdale asks £350,834. The three urban postcodes (LA1, LA3, LA4) all sit below £225,000. The four rural and semi-rural postcodes (LA2, LA5, LA6, PR3) all sit above £315,000. A clean split between urban buy-to-let territory and rural lifestyle markets.
| Rank | Area | Average Asking Price |
|---|---|---|
| 1 | LA4 (Morecambe) | £200,652 |
| 2 | LA1 (City Centre) | £209,119 |
| 3 | LA3 (Morecambe (Heysham)) | £224,265 |
| 4 | LA5 (Bolton-le-Sands, Carnforth) | £315,442 |
| 5 | PR3 (Garstang, Longridge) | £321,497 |
| 6 | LA2 (Lancaster (Rural), Galgate) | £325,854 |
| 7 | LA6 (Kirkby Lonsdale) | £350,834 |
LA4 Morecambe at £200,652 offers the lowest entry point in the district. Combined with a 4.7% gross yield and 22.8% five-year growth, this is a postcode that delivers across multiple metrics from the cheapest starting position. LA1 City Centre at £209,119 sits just above and adds the university tenant pool.
The jump from LA3 to LA5 is £91,177. That gap marks the boundary between urban buy-to-let postcodes and the rural fringe. LA5 Bolton-le-Sands, LA2, LA6, and PR3 are all above £315,000 and three of the four have no rental data. The investment case in these postcodes rests on capital growth rather than income.
The mean asking price across all seven Lancaster postcodes is £278,238. For anyone searching for property to buy in Lancaster, the urban postcodes offer a very different price bracket from the rural fringe. That district-wide figure appears in the comparison section later, where Lancaster is measured against Blackpool, Blackburn, Preston, and Carlisle.

House Price Growth in Lancaster
Lancaster's three cheapest postcodes delivered the strongest five-year growth: LA3 at 29.9%, LA4 at 22.8%, and LA1 at 19.3%. An investor who bought a £173,000 property in LA3 five years ago would be sitting on a property now asking £224,265. That is over £51,000 in equity growth from one of Lancaster's most affordable entry points. The five-year figure matters most for buy-to-let. It captures a full market cycle and filters out short-term noise.
| Area | 1 Year | 3 Years | 5 Years |
|---|---|---|---|
| LA3 (Morecambe (Heysham)) | 1.6% | 9.6% | 29.9% |
| LA4 (Morecambe) | 7.4% | 14.9% | 22.8% |
| LA1 (City Centre) | -1.1% | 1.6% | 19.3% |
| LA5 (Bolton-le-Sands, Carnforth) | 1.5% | -6.6% | 10.2% |
| LA2 (Lancaster (Rural), Galgate) | 6.7% | 15.8% | 8.4% |
| PR3 (Garstang, Longridge) | -4.2% | -5.3% | 8.0% |
| LA6 (Kirkby Lonsdale) | -16.4% | -7.6% | 1.2% |
LA4 Morecambe shows the strongest recent momentum at 7.4% one-year growth. LA4 also posted 14.9% over three years. That consistency across all three timeframes sets it apart from LA3, where one-year growth has slowed to 1.6% after a strong five-year run. Morecambe's regeneration push may be starting to show in the data.
LA6 Kirkby Lonsdale at 1.2% five-year growth and -16.4% one-year growth stands out at the bottom. A 16.4% annual decline in a rural postcode with just 13 monthly sales can be driven by a small number of lower-value transactions. The five-year figure of 1.2% is barely keeping pace with inflation. This is not a growth postcode.
LA2 shows an interesting pattern: strong one-year growth at 6.7% despite modest five-year growth of 8.4%. The three-year figure of 15.8% suggests most of that growth is recent. Rural Lancaster may be in a catch-up phase after lagging during the pandemic surge.
Monthly Property Sales in Lancaster
217 properties sell every month across Lancaster's seven postcodes, with LA1 City Centre accounting for 58 of them. If you need to sell a buy-to-let, transaction volume determines how quickly you exit. LA1 handles more than a quarter of all district sales. The standout figure is LA5 Bolton-le-Sands with a turnover rate of 102%, meaning properties change hands faster than new stock comes to market.
| Area | Sales Per Month | Turnover | Asking Price |
|---|---|---|---|
| LA1 (City Centre) | 58 | 27% | £209,119 |
| PR3 (Garstang, Longridge) | 39 | 20% | £321,497 |
| LA3 (Morecambe (Heysham)) | 34 | 27% | £224,265 |
| LA4 (Morecambe) | 32 | 10% | £200,652 |
| LA5 (Bolton-le-Sands, Carnforth) | 21 | 102% | £315,442 |
| LA2 (Lancaster (Rural), Galgate) | 20 | 7% | £325,854 |
| LA6 (Kirkby Lonsdale) | 13 | 8% | £350,834 |
LA4 Morecambe has a turnover of just 10% despite healthy sales of 32 per month. That tells you there is a large pool of stock that rarely comes to market. Landlords and owner-occupiers hold properties long-term in this area. Combined with LA4's position as the cheapest postcode and second-highest yield, the low turnover suggests other investors have already identified the same opportunity and are holding.
LA1 and LA3 both show 27% turnover with the highest raw sales volumes. These are the most liquid postcodes in the district. For exit strategy planning, the city centre and Morecambe offer the deepest buyer pool. LA6 and LA2 at 8% and 7% turnover are the least liquid. Selling in these rural postcodes may take longer.
Property Data Sources
Our location guide relies on diverse, authoritative datasets including:
- HM Land Registry UK House Price Index
- Ministry of Housing, Communities and Local Government
- Ordnance Survey Data Hub
- Propertydata.co.uk
We update our property data quarterly to ensure accuracy. Last update: March 2026. All data is presented as provided by our sources without adjustments or amendments.

Lancaster Rental Market Analysis
For investors weighing up whether rental property is a worthwhile investment in Lancaster, the data below breaks down average monthly rents and gross rental yields across the district's postcodes.
Rental data is available for 4 of 7 postcodes. LA2 (Lancaster Rural), LA5 (Bolton-le-Sands, Carnforth), and LA6 (Kirkby Lonsdale) have insufficient current listings for reliable figures. For the four with data, monthly rents range from £765 in LA3 to £1,122 in PR3 and gross yields range from 4.1% to 5.5%. If you are looking to build a property portfolio in the North West, Lancaster's combination of university-driven demand and affordable entry prices makes it a property investment location to examine closely.
Average Rent & Gross Rental Yields in Lancaster
LA1 delivers Lancaster's highest gross yield at 5.5%, where monthly rents of £955 meet asking prices of £209,119. At the other end, LA3 Morecambe at 4.1% reflects lower absolute rents of £765 against asking prices of £224,265. The yield spread across postcodes with data is 1.4 percentage points. Gross rental yield does not account for void periods, maintenance, management fees, or mortgage costs. It is a starting point for comparison, not a profit forecast.
| Area | Average Monthly Rent | Average Asking Price | Gross Yield |
|---|---|---|---|
| LA1 (City Centre) | £955 | £209,119 | 5.5% |
| LA4 (Morecambe) | £784 | £200,652 | 4.7% |
| PR3 (Garstang, Longridge) | £1,122 | £321,497 | 4.2% |
| LA3 (Morecambe (Heysham)) | £765 | £224,265 | 4.1% |
| LA2 (Lancaster (Rural), Galgate) | Not enough data | £325,854 | Not enough data |
| LA5 (Bolton-le-Sands, Carnforth) | Not enough data | £315,442 | Not enough data |
| LA6 (Kirkby Lonsdale) | Not enough data | £350,834 | Not enough data |
LA1 at 5.5% is the clear yield leader. The university drives consistent letting demand in Lancaster's city centre. Students, academic staff, and young professionals create a tenant pool that supports rents of £955 per month against asking prices that sit below the district average. That combination of affordable entry and reliable demand is what pushes the yield above the rest.
PR3 commands the highest absolute rent at £1,122 per month but delivers only 4.2% yield. Garstang and Longridge attract professional families and rural commuters willing to pay a premium. The yield is compressed by asking prices of £321,497. Investors here are buying for tenant quality and long-term appreciation rather than cash flow.
LA3 Morecambe at 4.1% has the lowest yield and the lowest rent at £765. Heysham and the eastern parts of Morecambe have a different tenant demographic from the city centre. But LA3 also delivered the strongest five-year growth in the district at 29.9%. The income is modest. The capital growth has not been.
Is Lancaster Rent High?
Rents in Lancaster range from 26.3% to 38.6% of the local median gross monthly salary across the four postcodes with data. The general benchmark is that rent becomes stretched above 30% of gross income. Two of Lancaster's four postcodes sit below that level, and one sits just above. For landlords, areas where rent consumes a lower share of income tend to produce more reliable tenants and fewer arrears.
The median gross weekly salary in Lancaster is £671.00, which equates to £2,908 per month or £34,890 per year. This is below the North West regional median of £720.10 per week and the Great Britain median of £752.40 per week. Data from the Nomis Labour Market Profile (ASHE 2025).
| Rank | Area | Rent as % of Income |
|---|---|---|
| 1 | PR3 (Garstang, Longridge) | 38.6% |
| 2 | LA1 (City Centre) | 32.8% |
| 3 | LA4 (Morecambe) | 26.9% |
| 4 | LA3 (Morecambe (Heysham)) | 26.3% |
| — | LA2 (Lancaster (Rural), Galgate) | Not enough data |
| — | LA5 (Bolton-le-Sands, Carnforth) | Not enough data |
| — | LA6 (Kirkby Lonsdale) | Not enough data |
PR3 at 38.6% looks stretched on paper. But PR3 covers Garstang and Longridge, where tenants typically earn above the Lancaster district median. Rural professional tenants are not on £34,890. The district-wide median understates what tenants in this postcode actually earn.
LA3 and LA4 in Morecambe both sit below the 30% threshold at 26.3% and 26.9%. That means tenants in these areas can comfortably sustain rental payments from local wages. Lower affordability pressure means lower arrears risk, even if the headline yields are more modest. For income-focused investors, affordable rents that tenants can actually pay reliably are more valuable than stretched rents that generate voids.
Thinking of Buying?
We have off-market investment properties averaging 8%+ annual yield.
View Property DealsBuy-to-Let Considerations
Are Lancaster House Prices High? Price-to-Earnings Ratios
Three of Lancaster's seven postcodes sit below the national price-to-earnings benchmark of 7.5x, with LA4 at 5.8x the most affordable entry point relative to local wages. The price-to-earnings ratio compares a postcode's average asking price to the local median annual salary. The national benchmark of 7.5x comes from England's average sold price of £291,865 against Great Britain's median annual salary of £39,125.
Purchasing a property in Lancaster requires between 5.8 and 10.1 times the median annual salary of £34,890. That salary figure comes from the Nomis Labour Market Profile for Lancaster (ASHE 2025). LA4, LA1, and LA3 all come in at 6.4x or below. These are the same three postcodes where rental data is available and yields are strongest. The four rural and semi-rural postcodes all sit above 9.0x, reflecting prices driven by lifestyle demand rather than local wages.
| Rank | Area | Price-to-Earnings Ratio |
|---|---|---|
| 1 | LA4 (Morecambe) | 5.8x |
| 2 | LA1 (City Centre) | 6.0x |
| 3 | LA3 (Morecambe (Heysham)) | 6.4x |
| 4 | LA5 (Bolton-le-Sands, Carnforth) | 9.0x |
| 5 | PR3 (Garstang, Longridge) | 9.2x |
| 6 | LA2 (Lancaster (Rural), Galgate) | 9.3x |
| 7 | LA6 (Kirkby Lonsdale) | 10.1x |
LA4 at 5.8x and LA1 at 6.0x are the most accessible entry points relative to local wages. Both sit well below the national benchmark. LA4 also offers 4.7% yield and the lowest deposit at £60,196. LA1 delivers the highest yield at 5.5% from a deposit of £62,736. These are the postcodes where the numbers stack up most clearly for buy-to-let.
LA6 at 10.1x is completely detached from local incomes. Kirkby Lonsdale's prices are driven by lifestyle buyers from outside the district, not by what Lancaster residents earn. LA5, PR3, and LA2 all cluster between 9.0x and 9.3x. These rural and semi-rural postcodes are priced for owner-occupiers, not rental income investors.
Deposit Requirements in Lancaster
A 30% deposit in Lancaster starts at £60,196 in LA4 and £62,736 in LA1, covering the two postcodes with the highest yields from under £63,000. Most buy-to-let mortgage lenders require a minimum 25% deposit. The table below uses a more conservative 30% to reflect the rates and products available at higher loan-to-value ratios, which matters for cash flow. The four rural postcodes all require deposits above £94,000. Investors looking for below market value properties may find opportunities in LA3 and LA4 where stock turnover is high.
| Rank | Area | 30% Deposit Required |
|---|---|---|
| 1 | LA4 (Morecambe) | £60,196 |
| 2 | LA1 (City Centre) | £62,736 |
| 3 | LA3 (Morecambe (Heysham)) | £67,279 |
| 4 | LA5 (Bolton-le-Sands, Carnforth) | £94,633 |
| 5 | PR3 (Garstang, Longridge) | £96,449 |
| 6 | LA2 (Lancaster (Rural), Galgate) | £97,756 |
| 7 | LA6 (Kirkby Lonsdale) | £105,250 |
The £2,540 difference between LA4 and LA1 deposits buys access to a significantly higher yield. LA4 at £60,196 delivers 4.7% gross yield. LA1 at £62,736 delivers 5.5%. That extra £2,540 upfront translates to roughly £171 more per month in gross rental income. On a like-for-like basis, LA1 offers the better return per pound of deposit.
A clear gap separates the sub-£68,000 tier from the rest. LA4, LA1, and LA3 all require deposits under £68,000. The next step up is LA5 at £94,633, a jump of £27,354. For investors with limited capital, the three cheapest postcodes cover the entire urban buy-to-let market in Lancaster and Morecambe.
Deposit is only part of the upfront cost. Budget for stamp duty (use our stamp duty calculator for an accurate figure), legal fees, and survey costs. For a full breakdown, see our guide to buy-to-let costs.
What the Lancaster Data Tells Buy-to-Let Investors
Lancaster's data splits the district in two: three urban postcodes with yields up to 5.5%, deposits under £68,000, and active rental markets, versus four rural postcodes priced above £315,000 with limited letting evidence. The numbers tell distinct stories depending on where in the district you look.
For yield, the numbers favour LA1 (5.5%) and LA4 (4.7%). Both sit at 6.0x or below on price-to-earnings with 30% deposits under £63,000. LA1 benefits from Lancaster University's student and academic tenant pool. LA4 in Morecambe offers the cheapest entry point in the district and the second-highest yield. Between them, they cover two distinct tenant demographics from very similar price points.
For growth, LA3 and LA4 in Morecambe have delivered the strongest five-year returns at 29.9% and 22.8%. LA3 also posted the highest five-year growth in the district from a low base. These are the postcodes where the seafront regeneration story is starting to show in the data. The Morecambe postcodes combine low entry prices, reasonable yields, and the strongest growth trajectory in the district.
LA2, LA5, LA6, and PR3 sit in a different bracket. All four have asking prices above £315,000, deposits above £94,000, and three of four have no rental data. LA6 Kirkby Lonsdale shows negative one-year and three-year growth with just 13 monthly sales. PR3 commands the highest rent at £1,122 but prices of £321,497 compress the yield to 4.2%. These postcodes work for investors with larger capital seeking rural properties, but the rental income case is thin.
Investors seeking entry below published asking prices may find opportunities through off-market property channels, particularly in the urban postcodes where stock turnover is higher.
Lancaster does not operate a selective licensing scheme at the time of writing. Morecambe has historically been discussed as a candidate for additional licensing. Lancaster City Council publishes its housing strategy, which covers future requirements for LA3 and LA4.
How Lancaster Buy-to-Let Compares to Nearby Areas
Lancaster's urban postcodes average £211,345, placing them between Blackpool (£198,183) and Blackburn (£221,601) for entry price. Investors looking at Lancaster as an investment property location are typically also considering other North West areas. The table below compares Lancaster against four nearby areas using the same methodology: mean asking price across all postcodes, mean monthly rent across postcodes with data, and top single-postcode gross yield.
| Location | Mean Asking Price | Mean Monthly Rent | Top Gross Yield |
|---|---|---|---|
| Blackpool | £198,183 | £750 | 6.3% |
| Blackburn | £221,601 | £816 | 4.7% |
| Preston | £249,695 | £999 | 6.2% |
| Carlisle | £276,315 | £779 | 5.7% |
| Lancaster | £278,238 | £906 | 5.5% |
Lancaster's mean asking price of £278,238 is the highest in this group, but that figure is skewed by the rural postcodes. Strip out LA5, LA6, and PR3 and the urban average drops to £211,345. On that basis, Lancaster's urban postcodes sit between Blackpool and Blackburn for affordability.
Preston and Blackpool both show higher top yields (6.2% and 6.3%). Preston has the advantage of a larger, more diverse economy with direct motorway links. Blackpool offers the lowest entry prices but carries a different tenant and stock profile. Lancaster sits between them on yield but adds the university economy that neither Blackpool nor Carlisle can match.
Lancaster's second-highest mean monthly rent of £906 reflects the PR3 premium pulling the average up. The urban postcodes achieve rents more comparable to Blackburn and Blackpool. The investment case for Lancaster rests on the university and NHS employment stability rather than headline yield or rent figures. For a data-driven comparison across all UK locations, see our guide to the best buy-to-let areas.
Frequently Asked Questions
What are the main areas of Lancaster for buy-to-let?
LA1, LA3, and LA4 are the three main buy-to-let postcodes in Lancaster. LA1 covers the city centre and surrounding residential streets where university demand drives the highest yield at 5.5%. LA3 and LA4 cover Morecambe and Heysham, where lower entry prices and seaside regeneration provide a different investment profile with yields of 4.1% and 4.7%. The rural postcodes (LA2, LA5, LA6, PR3) serve primarily owner-occupier and lifestyle markets with limited rental data.
Is Lancaster a good place to live for families?
Lancaster consistently ranks well for quality of life, with a population that grew 3.3% to 142,934 between 2011 and 2021. The district combines a historic city centre, Morecambe Bay coastline, and access to the Lake District and Yorkshire Dales. Two universities support cultural and social infrastructure beyond what a district of this size would normally have. For investors, this liveability translates into sustained tenant demand from professionals and families who choose to live in the district rather than commute elsewhere. The employment rate of 81.1% sits above both the North West and national averages.
Is student accommodation a good investment in Lancaster?
Lancaster University has around 16,000 students and ranks among the UK's top 15, supporting a 5.5% gross yield in the city centre postcode LA1. The university's campus is largely self-contained with significant on-campus accommodation, but many second and third-year students move into private rented housing and HMOs in LA1. The University of Cumbria adds a city centre campus. For a broader view of the sector, see our guide to purpose-built student accommodation.
How does Lancaster compare to Preston for property investment?
Preston offers higher top yields at 6.2% vs Lancaster's 5.5%, with a lower mean asking price of £249,695 vs Lancaster's £278,238. Preston has a more diverse economy with stronger transport links via the M6, M55, and West Coast Main Line hub. Lancaster's urban postcodes average closer to £211,000, narrowing the gap significantly. Lancaster's advantage is the university economy and a smaller, more contained market. Preston is the bigger, busier city with more stock and higher transaction volumes. Both sit in Lancashire and serve different investor profiles.
What is the population of Lancaster?
Lancaster's population was 142,934 at the 2021 Census, up 3.3% from 138,375 in 2011. Data from the ONS Census 2021. The district covers not just the city of Lancaster but also Morecambe, Heysham, Carnforth, and rural areas stretching to Kirkby Lonsdale. The university student population adds seasonal demand on top of the resident base.