Where to Buy Property Investments in Rochdale: Yields of 5.1%
Rochdale's gross rental yields range from 4.0% to 5.1% across postcodes with rental data, with OL16 delivering the highest returns. Average sold prices sit 28.1% below the England average, and the borough's population grew 5.7% to 223,773 between the 2011 and 2021 censuses.
Rochdale's average sold price of £209,799 makes it one of the most affordable metropolitan boroughs in Greater Manchester for buy-to-let property. That is 3.5% below the North West regional average and creates entry points that few locations in the region can match. Asking prices start from £232,205 in OL16, and rental data is available for 7 of the borough's 8 postcodes. For investors exploring property investment in the North West, Rochdale's combination of low entry costs and post-recovery growth makes it a location worth examining.
This guide covers all 8 Rochdale postcodes from BL9 to OL16 under the Metropolitan Borough of Rochdale (ONS code E08000005). Rochdale sits in the north-eastern corner of Greater Manchester, with the Pennines to the east and the M62 corridor providing direct links to Leeds and Manchester. Some postcodes straddle neighbouring boroughs: BL9 covers the Bury border area and OL2 extends into Oldham. Investors comparing options in the region may also consider Bolton, Oldham, or Manchester. Browse all our North West location guides.
Article updated: March 2026
Rochdale Buy-to-Let Market Overview 2026
Rochdale offers some of the lowest entry prices in Greater Manchester, with a 28.1% discount to England and five-year growth of 44.3% from a compressed post-crash base.
- Average sold price: £209,799 (28.1% below England's £291,865)
- Asking price range: £232,205 (OL16) to £277,741 (OL11)
- Rental yields: 4.0% (BL9, OL2) to 5.1% (OL16) across postcodes with rental data
- Rental income: Monthly rents from £892 (BL9) to £1,039 (M24)
- Price per sq ft: House prices from £213/sq ft (OL16) to £246/sq ft (M24)
- Market activity: Sales ranging from 17 per month (OL15) to 47 per month (BL9)
- Deposit requirements: 30% deposits range from £69,662 (OL16) to £83,322 (OL11)
- Affordability ratios: Property prices from 6.7 to 8.0 times Rochdale's median annual salary of £34,660
Contents

-
by Robert Jones, Founder of Property Investments UK
With two decades in UK property, Rob has been investing in buy-to-let since 2005, and uses property data to develop tools for property market analysis.

Property Data Sources
Our location guide relies on diverse, authoritative datasets including:
- HM Land Registry UK House Price Index
- Ministry of Housing, Communities and Local Government
- Ordnance Survey Data Hub
- Propertydata.co.uk
We update our property data quarterly to ensure accuracy. Last update: March 2026. All data is presented as provided by our sources without adjustments or amendments.
Why Invest in Rochdale?
Rochdale's median annual salary of £34,660 sits below both the North West (£37,445) and national (£39,125) averages, yet average sold prices of £209,799 create price-to-earnings ratios as low as 6.7x. The borough sits on the M62 corridor, the motorway that connects Manchester to Leeds and gives direct access to two of the North's largest employment centres. That connectivity drives logistics and distribution activity, with the Kingsway Business Park alone providing over 3 million square feet of commercial space near junction 21 of the M62.
Manufacturing remains a significant employer. The borough's industrial heritage has evolved into advanced manufacturing and materials science, reinforced by the Atom Valley Mayoral Development Zone that spans Rochdale, Bury, and Oldham. The first major facility, the Sustainable Materials and Manufacturing Centre at Kingsway, is expected to complete by summer 2026.
Between the 2011 and 2021 censuses, Rochdale's population grew from 211,699 to 223,773, a rise of 5.7%. That is below the England and Wales average of 6.3% but higher than many northern metropolitan boroughs. The growth is concentrated in the town centre and Heywood, where new housing development has expanded capacity.
Earnings in Rochdale sit below both the regional and national averages. The median annual salary is £34,660, compared to £37,445 across the North West and £39,125 for Great Britain. Lower local wages combined with affordable house prices create a market where rental yields hold up well. The gap between Rochdale wages and Greater Manchester employment opportunities also matters. Rochdale residents commuting into Manchester earn more than the local median but choose to rent locally, which supports demand across the borough's postcodes.
Rochdale Infirmary provides local hospital services and Fairfield General Hospital in Bury is the nearest major acute facility. The healthcare sector, combined with education and public services, creates a stable baseline of employment that underpins rental demand.
Rochdale Economic Summary
- Population: 223,773 (2021 Census). Growth of 5.7% from 2011.
- Median annual salary: £34,660 (Rochdale), £37,445 (North West), £39,125 (Great Britain)
- Employment rate: 68.0% (Rochdale), 74.2% (North West), 75.6% (Great Britain)
- Unemployment rate: 6.8% (Rochdale), 4.1% (North West), 4.3% (Great Britain)
- Key employment sectors: Advanced manufacturing, logistics and distribution, healthcare, public sector, retail
Source: ONS Census 2021, Nomis Labour Market Profile (ASHE 2025, Employment Oct 2024-Sep 2025)
Rochdale's employment rate of 68.0% sits well below the North West average of 74.2%. The unemployment rate of 6.8% is higher than both the regional 4.1% and national 4.3%. These figures reflect structural challenges in the local labour market that have persisted for over a decade. For buy-to-let investors, the lower employment rate is offset by proximity to Manchester's job market. Metrolink tram services connect Rochdale town centre to Manchester in under 40 minutes, and many tenants work outside the borough while renting within it.
Regeneration and Investment in Rochdale
Over £400 million is committed to Rochdale's regeneration across two major programmes: the transformation of the town centre, where £250 million has already been invested, and Atom Valley's plan for 20,000 jobs and 7,000 homes across three boroughs.
- Rochdale Town Centre Regeneration (ongoing, £400m+): Over £250 million has been invested in the town centre, with a further £150 million planned. Completed projects include Rochdale Riverside (retail and leisure), the Grade I-listed Town Hall restoration, and Upperbanks (242 apartments and a 146-room hotel). For investors, the town centre transformation directly supports rental demand in OL16 and OL11 postcodes. Updates at Rochdale Development Agency.
- Station Gardens and Rail Corridor (under construction, £15m): 81 new homes on a brownfield site near Rochdale railway station, with 33 additional apartments on the corner of Maclure Road and Station Road. These will be the first net zero homes delivered through a council-supported scheme, with completion expected by early 2028. Updates at Willmott Dixon.
- Atom Valley Mayoral Development Zone (in development, part of £400m+ GM programme): Spanning Rochdale, Bury, and Oldham, Atom Valley aims to create 1.6 million square metres of employment space, 20,000 jobs, and 7,000 new homes. The first facility, the Sustainable Materials and Manufacturing Centre at Kingsway, is under construction. New employment at this scale generates its own rental demand across surrounding postcodes. Updates at Rochdale Development Agency.

Rochdale Property Market Analysis
When Was the Last House Price Crash in Rochdale?
Rochdale's prices fell 23.7% from peak to trough after the 2008 crash and took 10 years and 10 months to recover. That was deeper than England's 18.2% decline and far longer than the national recovery. All sold property prices from HM Land Registry for this guide are recorded at the Rochdale metropolitan borough level. The full history from the HM Land Registry House Price Index runs from January 1995 to December 2025.
- 1995-2000 (Slow start): Rochdale began 1995 at £38,149. Growth was modest through the late 1990s. By January 2000, prices had reached just £43,354. A total increase of 13.6% over five years while southern England was already accelerating.
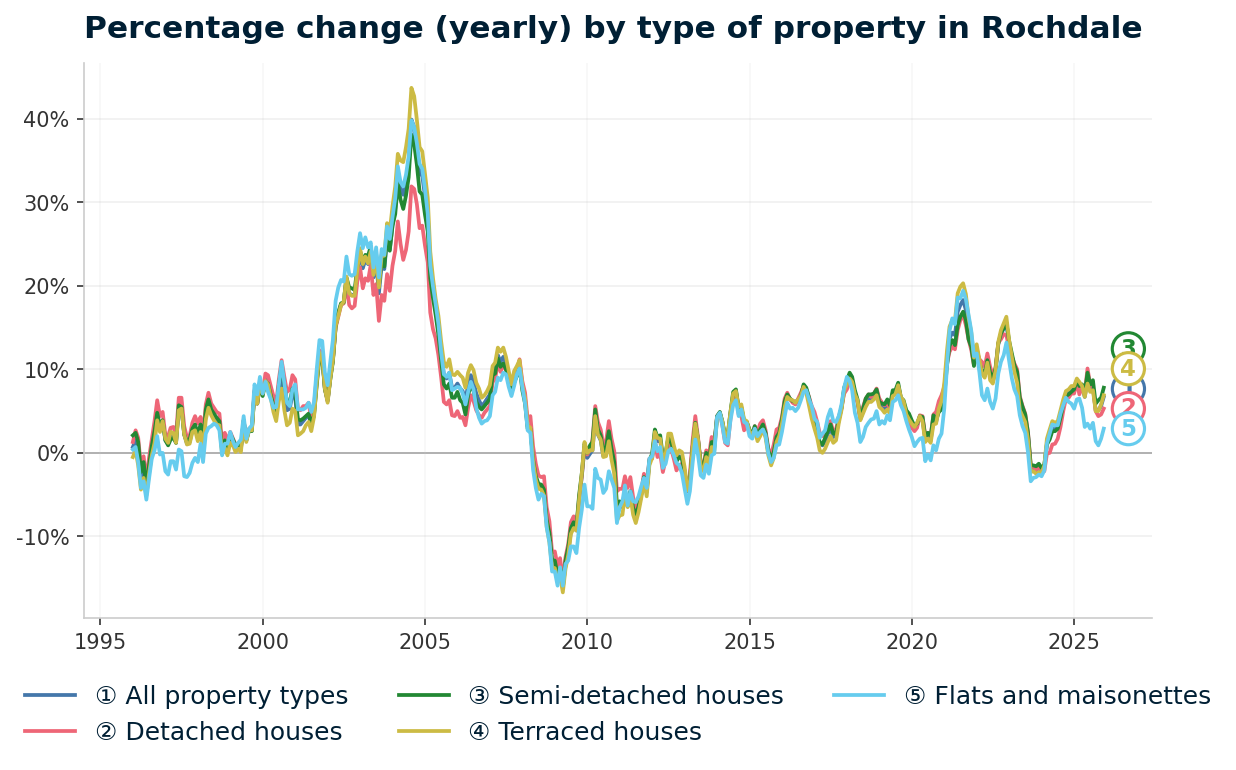
- 2000-2007 (The boom): Rochdale caught up fast. Prices nearly tripled from £43,354 in January 2000 to a peak of £128,118 in December 2007. The sharpest growth came in 2004-2005, when annual change hit 30.7% in January 2005. Cheap credit and rising wages pushed prices well beyond historic norms.
- 2007-2009 (The financial crisis): From the peak of £128,118 in December 2007 to April 2009, prices fell to £102,713. The worst annual change reading was -16.2% in April 2009. All property types fell steeply: detached -15.3%, semi-detached -15.7%, terraced -16.7%, flats -15.9%. Terraced houses, the dominant stock in Rochdale, took the hardest hit.
- 2009-2013 (Extended decline): This is where Rochdale's story diverges from the national pattern. England's market bottomed in March 2009. Rochdale kept falling. Prices drifted down from £102,713 in April 2009 to a trough of £97,807 in February 2013. Nearly four more years of decline after the initial crash. The total peak-to-trough loss was 23.7%, compared to 18.2% for England and 18.3% for the North West region.
Recovery and Rebound
- 2013-2016 (Stabilisation): Growth returned but at a glacial pace. By December 2013, prices were £103,130. By December 2015, £109,352. By December 2016, £114,579. Annual growth of 2-5% was slowly closing the gap, but Rochdale remained well below its pre-crash peak.
- 2017-2019 (Building momentum): Prices rose from £114,509 in January 2017 to £137,565 by December 2019. Annual growth peaked above 9% in early 2018 before settling to 4.1% by December 2019. The Metrolink extension to Rochdale (operational since 2013) was by now supporting commuter demand, and the town centre regeneration programme was gathering pace.
- Recovery milestone (October 2018): Rochdale prices finally exceeded the pre-crash peak in October 2018 at £128,980. That recovery took 10 years and 10 months from the December 2007 peak. England recovered by 2014. The North West region recovered by 2017. Rochdale was one of the last metropolitan boroughs in Greater Manchester to pass its pre-crash level.
- 2020-2022 (Pandemic surge): The stamp duty holiday and remote working shift accelerated growth sharply. Prices jumped from £133,840 in March 2020 to £186,235 by December 2022. That is 39.1% growth in under three years. Rochdale's affordability and M62 connectivity made it a beneficiary of the wider market surge.
- 2023 (Rate shock): Interest rate rises cooled the market. Prices dipped from £186,235 in December 2022 to £182,937 by December 2023. A decline of 1.8%. Brief and mild compared to the 2008 crash.
- 2024-2025 (Strong rebound): Prices recovered quickly. By December 2024, the average reached £196,682 (annual growth 7.5%). By December 2025, £209,799 (annual growth 6.7%). Rochdale now sits 63.8% above its pre-crash peak.
Long-Term Property Value Growth in Rochdale
- 5 years (2020-2025): +44.3% (£145,421 to £209,799)
- 10 years (2015-2025): +91.9% (£109,352 to £209,799)
- 15 years (2010-2025): +101.4% (£104,151 to £209,799)
- 20 years (2005-2025): +93.2% (£108,603 to £209,799)
- 30 years (1995-2025): +463.1% (£37,259 to £209,799)
The 2008 crash is the reference point for Rochdale investors assessing downside exposure. A 23.7% decline took nearly 11 years to recover. That was longer and deeper than the national average. But the extended suppression is also what compressed prices and created the current 28.1% discount to England.
The Atom Valley employment programme and town centre regeneration did not exist in 2007. The Metrolink tram link did not exist. The structural case for Rochdale is materially different now, even though property prices are never guaranteed.
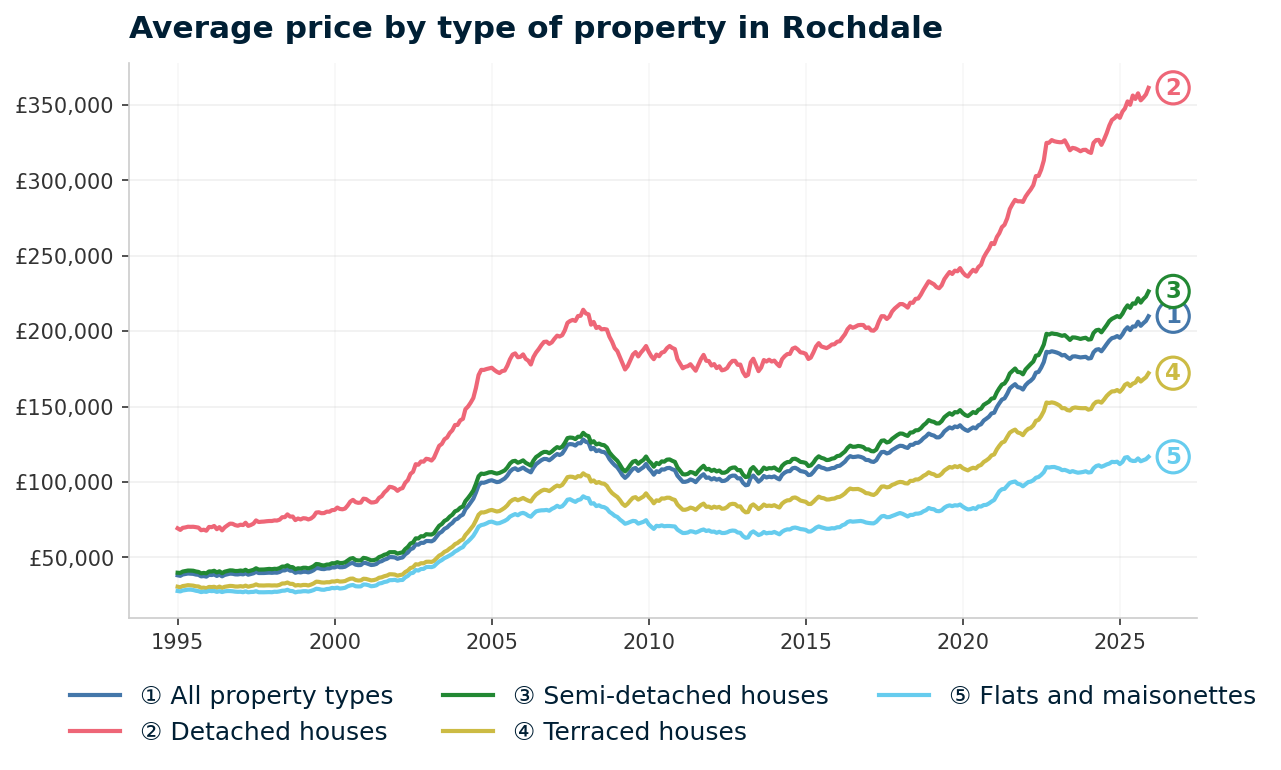
Source: HM Land Registry House Price Index for Rochdale, January 1995 to December 2025.
Thinking of Buying?
We have off-market investment properties averaging 8%+ annual yield.
View Property DealsSold House Prices in Rochdale
The latest sold house price index from the Land Registry confirms the scale of Rochdale's discount. The headline figure of £209,799 is 28.1% below England's £291,865 and 3.5% below the North West's £217,428. That positions Rochdale as cheaper than the regional average, which is itself one of the most affordable regions in England.
Flats in Rochdale average £116,682. That is 46.8% below the England average of £219,340. No other property type comes close to that gap. It reflects a borough where flat stock is predominantly older conversions and ex-local authority units rather than the premium new-build apartments that inflate flat prices in Manchester city centre.
| Property Type | Rochdale Average | England Average | Difference |
|---|---|---|---|
| Detached houses | £361,169 | £471,667 | -23.4% |
| Semi-detached houses | £226,251 | £289,135 | -21.7% |
| Terraced houses | £172,070 | £244,830 | -29.7% |
| Flats and maisonettes | £116,682 | £219,340 | -46.8% |
| All property types | £209,799 | £291,865 | -28.1% |
Semi-detached houses show the narrowest discount at 21.7%. Semis are the core family housing stock across Rochdale's suburban postcodes. Owner-occupier demand from families commuting into Manchester competes directly with investors, keeping semi prices closer to the England average than any other type. At £226,251, they are within £12,000 of the North West regional average of £238,258.
Detached houses sit 23.4% below England at £361,169. Detached stock is concentrated in the eastern postcodes (OL15 Littleborough and parts of OL12) where larger properties back onto the Pennine fringe. The discount exists because Rochdale lacks the commuter premium that inflates detached prices in areas like Altrincham or Wilmslow.
Terraced houses average £172,070, a 29.7% discount. Terraced housing dominates OL16 town centre, OL10 Heywood, and OL12 Whitworth. These are the traditional two-up-two-down streets that form the backbone of Rochdale's rental stock. Investors looking for renovation properties for sale will find the deepest stock in these postcodes. At £172,070, they sit almost exactly at the North West regional average of £174,873. For buy-to-let investors, terraced houses offer the most direct route to yield.
Flats at 46.8% below England represent the widest discount in Rochdale's market. At £116,682, a 30% deposit of £35,005 makes flat investment accessible. The discount also narrows when compared to the North West average of £140,410, where the gap reduces to 16.9%. The borough does not have the same scale of flat development as Manchester, which limits both stock and competition.
Property Data Sources
Our location guide relies on diverse, authoritative datasets including:
- HM Land Registry UK House Price Index
- Ministry of Housing, Communities and Local Government
- Ordnance Survey Data Hub
- Propertydata.co.uk
We update our property data quarterly to ensure accuracy. Last update: March 2026. All data is presented as provided by our sources without adjustments or amendments.
Price Per Square Foot in Rochdale
How much are you actually paying per square foot of space in Rochdale? Average asking prices can mislead because a postcode might look expensive simply because it has larger properties. Price per square foot strips out that size bias.
Rochdale's price per square foot ranges from £213 in OL16 to £246 in M24, a spread of just £33 across all eight postcodes. That is one of the tightest ranges of any location guide we publish. It tells you the underlying cost of space in Rochdale is remarkably consistent, and the asking price differences between postcodes are driven more by property size and type than by fundamentally different land values.
| Rank | Area | Price Per Sq Ft |
|---|---|---|
| 1 | OL16 (Town Centre, Milnrow) | £213 |
| 2 | OL12 (Whitworth, Rochdale North) | £216 |
| 3 | OL10 (Heywood) | £217 |
| 4 | OL11 (Castleton, Rochdale South) | £219 |
| 5 | BL9 (Bury) | £229 |
| 6 | OL15 (Littleborough) | £238 |
| 7 | OL2 (Royton) | £244 |
| 8 | M24 (Middleton) | £246 |
The four cheapest postcodes by price per square foot (OL16, OL12, OL10, OL11) are all Rochdale-core postcodes. These cover the town centre, northern suburbs, Heywood, and the southern fringe around Castleton. Prices between £213 and £219 per square foot are among the lowest in Greater Manchester. Investors buying in these areas are paying less per unit of space than almost anywhere else in the conurbation.
M24 Middleton at £246 is the most expensive space in the borough. Middleton sits closest to Manchester and benefits from strong transport links (both Metrolink and bus routes). OL2 Royton at £244 is similar. Both postcodes border higher-value areas in Manchester and Oldham respectively, which lifts per-foot costs.
The tight £33 spread means postcode selection in Rochdale is less about finding cheap space and more about matching your investment to the right tenant profile. OL16 offers the cheapest space and the highest yield. M24 offers the most expensive space but the highest absolute rents. Read this alongside the yield data to see where the numbers converge.
Figures reflect averages across all property types and ages. Individual values depend on condition, location within the postcode, and building age.
For Sale Asking Prices in Rochdale
Rochdale's cheapest postcode by asking price (OL16 at £232,205) undercuts the average entry point in Manchester, Bolton, and Oldham. Asking prices reflect what sellers and agents think the market will pay. They are not the same as sold prices, which capture what buyers actually paid, but in Rochdale the gap is narrower than in higher-value boroughs.
Asking prices range from £232,205 in OL16 to £277,741 in OL11. That is a spread of just £45,536 across eight postcodes. Compared to most locations we cover, Rochdale's asking price range is compressed. There is no extreme outlier postcode pulling the average up. Every postcode falls between £232,000 and £278,000.
| Rank | Area | Average Asking Price |
|---|---|---|
| 1 | OL16 (Town Centre, Milnrow) | £232,205 |
| 2 | OL12 (Whitworth, Rochdale North) | £238,201 |
| 3 | OL10 (Heywood) | £242,201 |
| 4 | OL15 (Littleborough) | £254,719 |
| 5 | M24 (Middleton) | £263,983 |
| 6 | BL9 (Bury) | £265,491 |
| 7 | OL2 (Royton) | £270,341 |
| 8 | OL11 (Castleton, Rochdale South) | £277,741 |
Three postcodes cluster below £245,000: OL16, OL12, and OL10. These are the most affordable entry points and between them account for 91 sales per month. OL16 at £232,205 is the cheapest and also delivers the highest yield (5.1%). An investor can access Rochdale's strongest rental return from its lowest asking price. That combination does not happen in every location.
OL11 at £277,741 is the most expensive postcode despite sitting in Rochdale's southern suburbs. Castleton and the surrounding area attract family buyers and commuters heading south towards Manchester, which pushes asking prices above the borough average. The 33.6% five-year growth confirms demand has been strong here, but the higher entry price compresses the yield to 4.3%.
The mean asking price across all eight Rochdale postcodes is £255,610. That figure appears in the comparison section later, where Rochdale is measured against Wigan, Bolton, Oldham, and Bury. Investors looking for below market value properties in the North West will find individual listings below these averages, particularly in the terraced stock that dominates OL16 and OL10.

House Price Growth in Rochdale
An investor who bought in OL10 Heywood five years ago has seen 37.6% growth. At the borough level, Rochdale's Land Registry average has risen 44.3% over five years. The five-year figure matters most for buy-to-let investors. It captures a full market cycle and filters out short-term noise.
All eight Rochdale postcodes delivered positive five-year growth, with OL10 Heywood leading at 37.6%. An investor who bought a £176,000 property in OL10 five years ago would be sitting on a property now asking £242,201. That is £66,200 in equity growth from one of Rochdale's most affordable postcodes.
| Area | 1 Year | 3 Years | 5 Years |
|---|---|---|---|
| OL10 (Heywood) | 2.3% | 7.3% | 37.6% |
| OL11 (Castleton, Rochdale South) | -0.8% | 7.9% | 33.6% |
| OL2 (Royton) | 0.1% | 12.2% | 31.8% |
| BL9 (Bury) | -0.9% | 11.2% | 31.2% |
| OL16 (Town Centre, Milnrow) | 1.8% | 9.3% | 31.0% |
| OL12 (Whitworth, Rochdale North) | 3.7% | 15.0% | 30.4% |
| M24 (Middleton) | 3.4% | 9.2% | 27.4% |
| OL15 (Littleborough) | -4.9% | -1.8% | 21.2% |
Six of eight postcodes delivered over 30% five-year growth. OL10, OL11, OL2, BL9, OL16, and OL12 all sit in the 30-38% range. That cluster of consistent growth across the borough tells you the trend is broad-based. It is not one postcode pulling the average up while others stagnate.
OL12 Whitworth shows the strongest recent momentum: 3.7% one-year growth and 15.0% three-year growth. That three-year figure is the highest in the borough and suggests OL12 is still in an acceleration phase. The postcode covers the northern suburbs and the Whitworth area, where relatively affordable stock has attracted both first-time buyers and investors.
OL15 Littleborough is the clear outlier at -4.9% one-year and -1.8% three-year. It still delivered 21.2% over five years, meaning the earlier gains have not been erased. But the recent decline, combined with no rental data and the lowest transaction volume (17 per month), points to a market with thinner demand. OL15 is a smaller, more rural postcode on the Pennine fringe where buyer pools are shallower.
Monthly Property Sales in Rochdale
Rochdale sees 266 property transactions per month across its eight postcodes. For buy-to-let investors, this is an exit strategy question. If you need to sell, can you? High volume and high turnover mean a liquid market. Low volume means you could wait months for a buyer.
Monthly sales range from 17 in OL15 to 47 in BL9. OL10 Heywood stands out with the highest turnover rate at 26%, meaning properties listed for sale are absorbed quickly relative to available stock.
| Area | Sales Per Month | Turnover | Asking Price |
|---|---|---|---|
| BL9 (Bury) | 47 | 21% | £265,491 |
| M24 (Middleton) | 40 | 20% | £263,983 |
| OL2 (Royton) | 38 | 16% | £270,341 |
| OL12 (Whitworth, Rochdale North) | 34 | 21% | £238,201 |
| OL11 (Castleton, Rochdale South) | 33 | 19% | £277,741 |
| OL10 (Heywood) | 32 | 26% | £242,201 |
| OL16 (Town Centre, Milnrow) | 25 | 19% | £232,205 |
| OL15 (Littleborough) | 17 | 20% | £254,719 |
OL10 Heywood's 26% turnover is the highest in the borough and tells a specific story. It also delivered the strongest five-year growth (37.6%). That combination of rapid turnover and strong appreciation means properties in Heywood are selling quickly at rising prices. The buyer pool is active and confident.
OL2 Royton at 16% has the lowest turnover despite strong sales volume (38 per month). That suggests a large stock of listed properties relative to transactions. OL2 sits on the Rochdale/Oldham boundary where two boroughs' agents compete for listings. More stock coming to market does not always mean more demand.
BL9 and M24 generate the highest absolute volumes (47 and 40 per month) because they cover the largest residential areas. Both straddle neighbouring boroughs, which deepens the buyer pool. For exit strategy planning, BL9, M24, and OL10 offer the strongest combination of volume and turnover.
Property Data Sources
Our location guide relies on diverse, authoritative datasets including:
- HM Land Registry UK House Price Index
- Ministry of Housing, Communities and Local Government
- Ordnance Survey Data Hub
- Propertydata.co.uk
We update our property data quarterly to ensure accuracy. Last update: March 2026. All data is presented as provided by our sources without adjustments or amendments.
Rochdale Rental Market Analysis
For investors weighing up whether rental property is a worthwhile investment in Rochdale, the data below breaks down average monthly rents and gross rental yields across the borough's postcodes.
Rental data is available for 7 of 8 postcodes. OL15 (Littleborough) has insufficient current listings for reliable figures. For the seven with data, monthly rents range from £892 in BL9 to £1,039 in M24 and gross yields range from 4.0% to 5.1%. If you are looking to build a property portfolio in the North West, Rochdale's combination of low entry prices and consistent rental demand across Greater Manchester commuters makes it a strong contender.
Average Rent & Gross Rental Yields in Rochdale
OL16 delivers Rochdale's highest gross yield at 5.1%, where monthly rents of £985 meet asking prices of £232,205. Gross yield is calculated from the average asking price and average monthly rent. It does not account for void periods, maintenance, management fees, or mortgage costs, but it is the standard starting point for comparison.
The yield spread across Rochdale's seven postcodes with data is just 1.1 percentage points (4.0% to 5.1%). That is a narrower range than many boroughs, which means Rochdale's rental returns are more consistent across areas than in locations with extreme postcode variation.
| Area | Average Monthly Rent | Average Asking Price | Gross Yield |
|---|---|---|---|
| OL16 (Town Centre, Milnrow) | £985 | £232,205 | 5.1% |
| OL12 (Whitworth, Rochdale North) | £979 | £238,201 | 4.9% |
| M24 (Middleton) | £1,039 | £263,983 | 4.7% |
| OL10 (Heywood) | £901 | £242,201 | 4.5% |
| OL11 (Castleton, Rochdale South) | £987 | £277,741 | 4.3% |
| BL9 (Bury) | £892 | £265,491 | 4.0% |
| OL2 (Royton) | £911 | £270,341 | 4.0% |
| OL15 (Littleborough) | Not enough data | £254,719 | Not enough data |
OL16 and OL12 form a clear top tier at 5.1% and 4.9%. Both are Rochdale-core postcodes with asking prices under £240,000. The rents (£985 and £979) are almost identical. The difference in yield comes entirely from OL16's lower asking price. For investors choosing between the two, OL12 offers stronger three-year growth (15.0% vs 9.3%) while OL16 offers a cheaper entry.
M24 Middleton commands the highest absolute rent at £1,039 per month but the asking price of £263,983 compresses the yield to 4.7%. Middleton sits close to Manchester and attracts tenants willing to pay for the commute advantage. The rent is strong in absolute terms, but the yield tells you the price has absorbed much of the rental premium.
BL9 and OL2 both sit at 4.0%, the lowest yields in the borough. Both postcodes border higher-value areas (Bury and Oldham respectively) where asking prices are pushed up by owner-occupier competition. The rents (£892 and £911) are below the borough average, which further compresses returns. These postcodes deliver better growth data than yield data.
Is Rochdale Rent High?
Rent in Rochdale ranges from 30.9% to 36.0% of the local median gross monthly salary across seven postcodes with data. That matters from both sides. For tenants, it determines whether they can sustain payments long-term. For landlords, areas where rent consumes a lower share of income tend to produce more reliable tenants and fewer arrears.
The median gross weekly salary in Rochdale is £666.50, which equates to £2,888 per month or £34,660 per year. This is below the North West regional median of £720.10 per week and the Great Britain median of £752.40 per week. Data from the Nomis Labour Market Profile (ASHE 2025).
Across Rochdale's seven postcodes with rental data, rent ranges from 30.9% to 36.0% of the local median gross monthly salary. The general benchmark is that rent becomes stretched above 30% of gross income. All seven postcodes sit at or above that level. This reflects Rochdale's lower earnings rather than unusually high rents. The absolute rents (£892 to £1,039) are modest by Greater Manchester standards, making Rochdale one of the more affordable rent areas near Manchester.
| Rank | Area | Rent as % of Income |
|---|---|---|
| 1 | M24 (Middleton) | 36.0% |
| 2 | OL11 (Castleton, Rochdale South) | 34.2% |
| 3 | OL16 (Town Centre, Milnrow) | 34.1% |
| 4 | OL12 (Whitworth, Rochdale North) | 33.9% |
| 5 | OL2 (Royton) | 31.5% |
| 6 | OL10 (Heywood) | 31.2% |
| 7 | BL9 (Bury) | 30.9% |
| — | OL15 (Littleborough) | Not enough data |
M24 Middleton at 36.0% is the most stretched postcode. The highest absolute rents in the borough (£1,039) push the ratio above the comfort zone when measured against Rochdale's local median. But M24 tenants frequently commute into Manchester, where salaries are higher than the Rochdale median. The local median understates what these tenants actually earn.
BL9 at 30.9% and OL10 at 31.2% sit closest to the 30% benchmark. BL9 has the lowest rent in the borough (£892), which keeps affordability pressure manageable. OL10 at £901 is similar. For investors prioritising tenant retention and low arrears, these postcodes offer the best affordability position relative to income.
Thinking of Buying?
We have off-market investment properties averaging 8%+ annual yield.
View Property DealsAre Rochdale House Prices High? Price-to-Earnings Ratios
Purchasing a property in Rochdale requires between 6.7 and 8.0 times the median annual salary. This is based on the Nomis Labour Market Profile for Rochdale showing the median gross annual income for Rochdale residents is £34,660. The national benchmark is 7.5x, calculated from England's average sold price of £291,865 against Great Britain's median annual salary of £39,125.
Four of Rochdale's eight postcodes sit below that 7.5x benchmark. OL16, OL12, OL10, and OL15 all come in at 7.3x or below. Half the borough offers entry points more affordable relative to income than the England average.
| Rank | Area | Price-to-Earnings Ratio |
|---|---|---|
| 1 | OL16 (Town Centre, Milnrow) | 6.7x |
| 2 | OL12 (Whitworth, Rochdale North) | 6.9x |
| 3 | OL10 (Heywood) | 7.0x |
| 4 | OL15 (Littleborough) | 7.3x |
| 5 | M24 (Middleton) | 7.6x |
| 6 | BL9 (Bury) | 7.7x |
| 7 | OL2 (Royton) | 7.8x |
| 8 | OL11 (Castleton, Rochdale South) | 8.0x |
OL16 at 6.7x is the most affordable postcode in Rochdale relative to income. It is also the highest-yielding. That alignment of affordability, yield, and low entry price is unusual. In most boroughs, the cheapest postcode by price-to-earnings has a data limitation that explains the low price.
OL16 has full rental data, 25 sales per month, and 31.0% five-year growth. The numbers simply favour this postcode.
OL11 at 8.0x is the most stretched, yet still below many national comparators. An 8.0x ratio in the South East would be unremarkable. In Rochdale, it represents the premium end of a market where even the most expensive postcode requires less capital relative to income than the average entry point in England.
Deposit Requirements in Rochdale
Rochdale's 30% deposit requirements range from £69,662 in OL16 to £83,322 in OL11. Most buy-to-let mortgage lenders require a minimum 25% deposit. The table below uses 30% to reflect the products available at higher loan-to-value ratios, which typically unlock better interest rates.
That is a total spread of just £13,660 across all eight postcodes. Every single postcode in Rochdale requires a 30% deposit under £84,000. There is no six-figure deposit barrier here.
| Rank | Area | 30% Deposit Required |
|---|---|---|
| 1 | OL16 (Town Centre, Milnrow) | £69,662 |
| 2 | OL12 (Whitworth, Rochdale North) | £71,460 |
| 3 | OL10 (Heywood) | £72,660 |
| 4 | OL15 (Littleborough) | £76,416 |
| 5 | M24 (Middleton) | £79,195 |
| 6 | BL9 (Bury) | £79,647 |
| 7 | OL2 (Royton) | £81,102 |
| 8 | OL11 (Castleton, Rochdale South) | £83,322 |
OL16 at £69,662 is the cheapest entry point in Rochdale and also delivers the highest yield (5.1%). For an additional £1,798, OL12 at £71,460 offers 4.9% yield with the strongest three-year growth in the borough (15.0%). The extra deposit buys access to a postcode that is growing faster on recent data.
The entire deposit range fits within a £14,000 window. That compression means investors with a budget between £70,000 and £84,000 can access any postcode in Rochdale. The decision is about yield, growth, and tenant profile, not about which postcodes are affordable. They all are.
Deposit is only part of the upfront cost. Budget for stamp duty (use our stamp duty calculator for an accurate figure), legal fees, and survey costs. For a full breakdown, see our guide to buy-to-let costs. For alternative funding routes, explore our guide to buying investment property with no deposit.
What the Rochdale Data Tells Buy-to-Let Investors
For yield, the numbers favour OL16 (5.1%) and OL12 (4.9%). Both sit in the Rochdale core with 30% deposits under £72,000 and price-to-earnings ratios below 7.0x. OL16 combines the highest yield with the lowest entry price in the borough at £232,205. OL12 delivers the second-highest yield with the strongest three-year growth (15.0%) across all eight postcodes.
For growth, OL10 Heywood stands out at 37.6% over five years with the highest turnover (26%). OL11 and OL2 each delivered over 31% five-year growth. All eight postcodes produced positive five-year returns, including OL15 at 21.2%. That broad base of growth, combined with the 44.3% increase in Land Registry sold prices over five years, confirms the post-recovery momentum is borough-wide.
OL15 Littleborough has no rental data and negative one-year growth of -4.9%. It is the smallest market by transaction volume (17 per month) and the only postcode showing negative three-year growth (-1.8%). M24 Middleton commands the highest rents (£1,039) but its asking price of £263,983 compresses the yield to 4.7%. BL9 and OL2 at 4.0% yield are the weakest performers on rental returns, both bordering higher-value neighbouring areas where investment property pricing spills across the postcode boundary.
Rochdale Council operates selective licensing schemes in parts of the borough, which add compliance costs for landlords in designated areas. Investors looking at off-market property in Rochdale may find opportunities in the OL16 and OL12 postcodes where the data is strongest.
How Rochdale Buy-to-Let Compares to Nearby Areas
Rochdale's mean asking price of £255,610 sits in the middle of its four nearest competitors, but matches Bolton and Oldham on top yield at 5.1%. The table below compares Rochdale against four nearby locations using the same methodology: mean asking price across all postcodes, mean monthly rent across postcodes with data, and top single-postcode gross yield.
| Location | Mean Asking Price | Mean Monthly Rent | Top Gross Yield |
|---|---|---|---|
| Wigan | £227,201 | £892 | 5.6% |
| Bolton | £248,685 | £936 | 5.1% |
| Rochdale | £255,610 | £956 | 5.1% |
| Oldham | £268,665 | £1,012 | 5.1% |
| Bury | £279,435 | £1,017 | 4.9% |
Rochdale sits in the middle of this group on price but matches Bolton and Oldham on top yield at 5.1%. Wigan offers the cheapest entry and the highest top yield (5.6%), making it the standout for pure income investors. Bolton delivers the same 5.1% top yield as Rochdale but from a lower mean asking price (£248,685).
Rochdale's advantage is the combination of yield with growth trajectory. The 44.3% five-year Land Registry growth is among the strongest in this group, driven by the extended post-crash recovery. Oldham commands higher rents (£1,012) but costs £13,000 more on average. Bury is the most expensive option at £279,435 with the lowest top yield (4.9%).
For investors comparing across the best buy-to-let areas in Greater Manchester, the choice comes down to what you prioritise.
Wigan for yield. Bolton for value. Rochdale for the combination of yield, growth, and regeneration pipeline. Oldham for higher rents. Bury for tenant quality and stability.
Frequently Asked Questions
What is the population of Rochdale?
The 2021 Census recorded Rochdale's population at 223,773. That is a rise of 5.7% (12,074 people) from 211,699 in 2011. Growth has been concentrated in the town centre and Heywood, where new housing developments have expanded capacity. The ONS mid-year population estimate for 2024 is approximately 235,500, reflecting continued growth since the census.
Is Rochdale a good place to live?
Rochdale is a metropolitan borough with property prices 28.1% below the England average and direct Metrolink tram connections to Manchester city centre in under 40 minutes. The M62 motorway provides road access to Leeds and Liverpool. Property prices sit 28.1% below the England average, which means more space for less money than most areas in the North West. Employment is heavily influenced by proximity to Manchester's job market. The borough's regeneration programme, including the £400m+ town centre transformation and Atom Valley development zone, is actively reshaping the town centre. The 2021 Census showed 5.7% population growth, indicating sustained demand for housing.
What are the main areas in Rochdale for buy-to-let?
Rochdale's eight postcodes break down into distinct areas. OL16 covers the town centre and Milnrow, offering the highest yield (5.1%) and lowest entry price. OL12 includes Whitworth and the northern suburbs with strong recent growth (15.0% over three years). OL10 (Heywood) is a self-contained town west of Rochdale with the highest turnover (26%) and strongest five-year growth (37.6%). OL11 covers Castleton and Rochdale's southern suburbs. M24 (Middleton) commands the highest rents (£1,039) due to its proximity to Manchester. BL9 covers the Bury border area with the highest transaction volume (47 per month). OL2 (Royton) sits on the Oldham boundary. OL15 (Littleborough) is the smallest, most rural postcode on the Pennine fringe.
How does Rochdale compare to Bolton and Oldham for buy-to-let?
All three boroughs share a 5.1% top gross yield, but the underlying numbers differ. Rochdale's mean asking price (£255,610) sits between Bolton (£248,685) and Oldham (£268,665). Bolton is the cheaper entry. Oldham commands higher rents (£1,012 mean vs Rochdale's £956). Rochdale's five-year Land Registry growth of 44.3% is a standout figure, driven by the extended post-crash recovery that kept prices suppressed until 2018. Rochdale also has the Atom Valley programme as a specific employment catalyst. Bolton has its own town centre regeneration and proximity to the M61. Oldham benefits from the Manchester tram extension. The data across all three is broadly similar, which makes specific postcode selection within each borough more important than the borough-level comparison.
When will Atom Valley affect Rochdale property prices?
The first Atom Valley facility is under construction and expected to complete by summer 2026, but the full employment impact is a decade-long programme. Atom Valley spans Rochdale, Bury, and Oldham with plans for 20,000 jobs and 7,000 homes. The first facility (the Sustainable Materials and Manufacturing Centre at Kingsway) is under construction and expected to complete by summer 2026. The broader programme is a decade-long commitment backed by Greater Manchester Combined Authority. The employment impact will build gradually as businesses occupy the new facilities. Property prices in the surrounding postcodes (OL10, OL16, OL12) have already shown strong five-year growth of 30-38%, though attributing this specifically to Atom Valley is difficult given the broader post-pandemic recovery. For investors, Atom Valley is a structural tailwind that supports long-term rental demand, not a short-term price catalyst. Full details at Rochdale Development Agency.
Can I find buy-to-let property in Rochdale under £150,000?
Individual terraced houses in OL16, OL10, and OL12 regularly list below £150,000. The average asking prices in this guide range from £232,205 (OL16) to £277,741 (OL11), but these are postcode averages across all property types. Individual terraced houses in OL16, OL10, and OL12 regularly list below £150,000. Rochdale's average terraced house price of £172,070 from the Land Registry confirms that sub-£150,000 stock exists at the lower end. Sources include repossessed houses for sale and auction listings. At that price point, a 30% deposit is under £45,000. Investors considering our property investment courses often target this price range in northern towns. Condition, lease terms, and service charges require careful assessment at the lower end of the market.
Is Rochdale good for residential investment property?
Rochdale's data profile combines low entry costs (28.1% below the England average), gross yields up to 5.1%, and five-year growth of 44.3%. The borough sits in Greater Manchester with Metrolink connections to Manchester city centre, and the Atom Valley programme is a long-term employment catalyst. Residential investment property in Rochdale is primarily terraced and semi-detached stock across the OL postcodes. Investors targeting residential investment typically look at OL16 and OL12 for yield, or OL10 for growth and turnover.
Are there new build homes for sale in Rochdale?
New build development in Rochdale is concentrated around the town centre and Heywood. The Station Gardens scheme near Rochdale railway station is delivering 81 new homes plus 33 apartments, expected to complete by early 2028. Atom Valley's broader plan includes 7,000 new homes across Rochdale, Bury, and Oldham. For new build homes in Littleborough (OL15), stock is limited and the postcode has the lowest transaction volume (17 per month). Investors looking for new houses for sale in Rochdale will find the largest pipelines in OL16 and OL10 postcodes.